Market Strength Buy Sell Indicator [TradeDots]A specialized tool designed to assist traders in evaluating market conditions through a multifaceted analysis of relative performance, beta-adjusted returns, momentum, and volume—allowing you to identify optimal points for long or short trades. By integrating multiple benchmarks (default S&P 500) and percentile-based thresholds, the script provides clear, actionable insights suitable for both day trading and higher-level timeframe assessments.
📝 HOW IT WORKS
1. Multi-Factor Composite Score
Relative Performance (RS Ratio): Compares your asset’s performance to a chosen benchmark (default: SPY). Values above 1.0 indicate outperformance, while below 1.0 suggest underperformance.
Beta-Adjusted Returns: Checks the ticker’s excess movement relative to expected market-related moves. This helps distinguish pure “alpha” from broad market effects.
Volume & Correlation: Volume spikes often confirm the momentum behind a move, while correlation measures how closely the asset tracks or diverges from its benchmark.
These components merge into a 0–100 composite score. Scores above 50 frequently imply bullish strength; drops below 50 often point to underperformance—potentially flagging short opportunities.
2. Intraday & Day Trading Focus
Monitoring Below 50: During the trading day, the script calculates live data against the benchmark, offering an intraday-sensitive composite score. A dip under 50 may indicate a short bias for that session, especially when accompanied by high volume or momentum shifts.
3. Higher Timeframe Monitoring
Daily Strategies: On daily or weekly charts, the script reveals overall relative strength or weakness compared to the S&P 500. This higher-level perspective helps form broader trading biases—crucial for swing or position trades spanning multiple days.
Long/Short Thresholds: Persistent readings above 50 on a daily chart typically reinforce a long bias, while consistent dips below 50 can sustain a short or cautious outlook.
4. Pair Trading Applications
Custom Benchmark Selection: By setting a specific ticker pair as your benchmark instead of the default S&P 500, you can identify spread trading opportunities between two correlated assets. This allows you to go long the outperforming asset while shorting the underperforming one when the spread reaches extreme levels.
4. Color-Coded Signals & Alerts
Visual Zones (25–75): Color-coded bands highlight strong outperformance (above 75) or pronounced underperformance (below 25).
Alerts on Strong Shifts: Automatic alerts can notify you of sudden entries or exits from bullish or bearish zones, so you can potentially act on new market information without delay.
⚙️ HOW TO USE
1. Select Your Timeframe: For scalping or day trading, lower intervals (e.g., 5-minute) offer immediate data resets at the session’s start. For multi-day insight, daily or weekly charts reveal broader performance trends.
2. Watch Key Levels Around 50: Intraday dips under 50 may be a cue to consider short trades, while bounces above 50 can confirm renewed strength.
3. Assess Benchmark Relationships: Compare your asset’s score and signals to the broader market. A stock falling below its pair’s relative strength line might lag overall market momentum.
4. Combine Tools & Validate: This script excels when integrated with other technical analysis methods (e.g., support/resistance, chart patterns) and fundamental factors for a holistic market view.
❗ LIMITATIONS
No Direction Guarantee: The indicator identifies relative strength but does not guarantee directional price moves.
Delayed Updates: Since calculations update after each bar close, sudden intrabar changes may not immediately reflect.
Market-Specific Behaviors: Some assets or unusual market conditions may deviate from typical benchmarks, weakening signal reliability.
Past ≠ Future: High or low relative strength in the past may not predict continued performance.
RISK DISCLAIMER
All forms of trading and investing involve risk, including the possible loss of principal. This indicator analyzes relative performance but cannot assure profits or eliminate losses. Past performance of any strategy does not guarantee future results. Always combine analysis with proper risk management and your broader trading plan. Consult a licensed financial advisor if you are unsure of your individual risk tolerance or investment objectives.
Pairtrading

Correlation Coefficient📊 Correlation Coefficient (CC)
This indicator measures the statistical correlation between two selected securities over a defined period, scaled from -100 to +100.
It helps you quickly assess whether assets are moving:
Together (positive correlation)
Opposite (negative correlation)
Independently (zero correlation)
🔧 Features:
Select any two symbols (default: NIFTY & BANKNIFTY)
Adjustable length parameter for short-term or long-term correlation analysis
Clean, color-coded plot with horizontal levels to easily identify key correlation zones
📈 Useful For:
Pair trading setups
Hedging strategies
Detecting market regime shifts or intermarket divergences
⚠️ Disclaimer: This is not trading or investment advice.
This indicator is intended for informational purposes only and is not recommended for making
direct trading decisions.

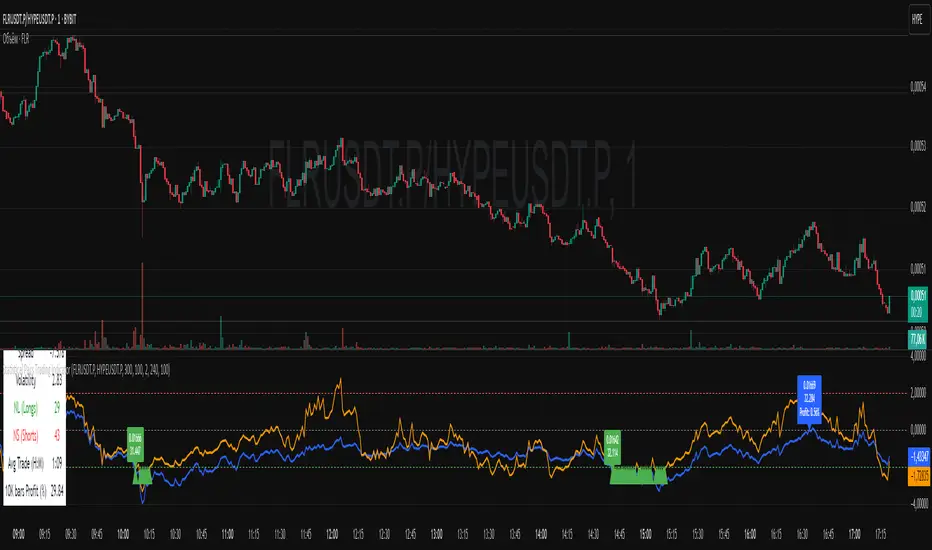
Statistical Pairs Trading IndicatorZ-Score Stat Trading — Statistical Pairs Trading Indicator
📊🔗
---
What is it?
Z-Score Stat Trading is a powerful indicator for statistical pairs trading and quantitative analysis of two correlated assets.
It calculates the Z-Score of the log-price spread between any two symbols you choose, providing both long-term and short-term Z-Score signals.
You’ll also see real-time correlation, volatility, spread, and the number of long/short signals in a handy on-chart table!
---
How to Use 🛠️
1. Add the indicator to your chart.
2. Select two assets (symbols) to analyze in the settings.
3. Watch the Z-Score plots (blue and orange lines) and threshold levels (+2, -2 by default).
4. Check the info table for:
- Correlation
- Volatility
- Spread
- Number of long (NL) and short (NS) signals in the last 1000 bars
5. Set up alerts for signal generation or threshold crossings if you want to be notified automatically.
---
Trading Strategy 💡
- This indicator is designed for statistical arbitrage (mean reversion) strategies.
- Long Signal (🟢):
When both Z-Scores drop below the negative threshold (e.g., -2), a long signal is generated.
→ Buy Symbol A, Sell Symbol B, expecting the spread to revert to the mean.
- Short Signal (🔴):
When both Z-Scores rise above the positive threshold (e.g., +2), a short signal is generated.
→ Sell Symbol A, Buy Symbol B, again expecting mean reversion.
- The info table helps you quickly assess the frequency of signals and the current statistical relationship between your chosen assets.
---
Best Practices & Warnings 🚦
- Avoid high leverage! Pairs trading can be risky, especially during periods of divergence. Use conservative position sizing.
- Check for cointegration: Before using this indicator, make sure both assets are cointegrated or have a strong historical relationship. This increases the reliability of mean reversion signals.
- Check correlation: Only use asset pairs with a high correlation (preferably 0.8–0.9 or higher) for best results. The correlation value is shown in the info table.
- Scale in and out gradually: When entering or exiting positions, consider doing so in parts rather than all at once. This helps manage slippage and risk, especially in volatile markets.
---
⚠️ Note on Performance:
This indicator may work a bit slowly, especially on large timeframes or long chart histories, because the calculation of NL and NS (number of long/short signals) is computationally intensive.
---
Disclaimer ⚠️
This script is provided for educational and informational purposes only .
It is not financial advice or a recommendation to buy or sell any asset.
Use at your own risk. The author assumes no responsibility for any trading decisions or losses.
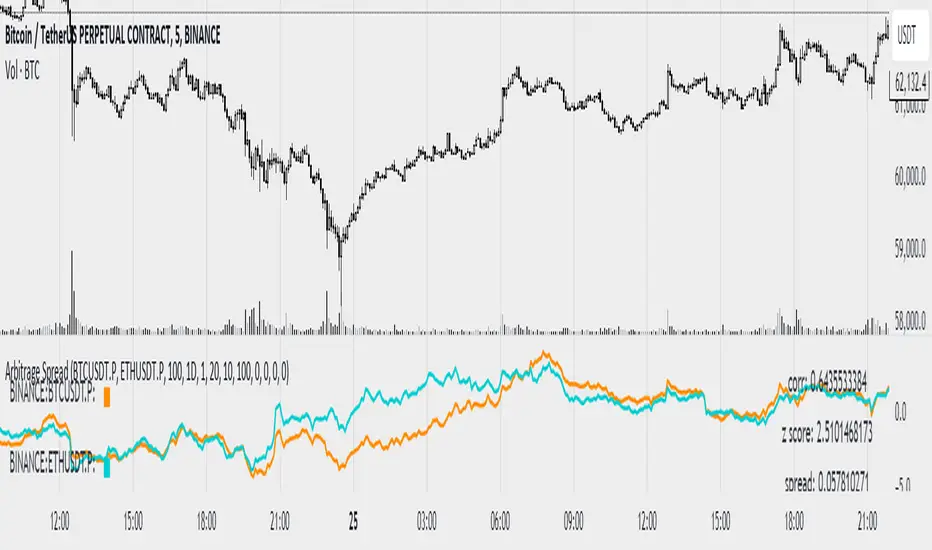
Arbitrage Synthetic Spread Chart v2Powerful tool for analyzing market divergences and identifying arbitrage opportunities! It creates a synthetic spread chart between two assets, displaying it in a clear format and helping traders spot moments of maximum decorrelation.
How does it work?
The indicator takes the closing prices of two assets and calculates their difference (spread):
spread = price1 - price2
Then, it constructs a price channel based on the highest and lowest values of the spread over a given period:
-Upper boundary: The highest spread value over the period
- Lower boundary: The lowest spread value over the period
- Middle line: The average of the upper and lower boundaries
Additionally, the indicator calculates the **correlation** between the two assets, helping traders assess their relationship strength.
How to use it?
When the spread reaches the channel boundaries, it may indicate an abnormal divergence between the assets. This serves as a signal for arbitrage trading:
✅ At the upper boundary: Sell Asset 1 and buy Asset 2
✅ At the lower boundary: Buy Asset 1 and sell Asset 2

Statistical Arbitrage Pairs Trading - Long-Side OnlyThis strategy implements a simplified statistical arbitrage (" stat arb ") approach focused on mean reversion between two correlated instruments. It identifies opportunities where the spread between their normalized price series (Z-scores) deviates significantly from historical norms, then executes long-only trades anticipating reversion to the mean.
Key Mechanics:
1. Spread Calculation: The strategy computes Z-scores for both instruments to normalize price movements, then tracks the spread between these Z-scores.
2. Modified Z-Score: Uses a robust measure combining the median and Median Absolute Deviation (MAD) to reduce outlier sensitivity.
3. Entry Signal: A long position is triggered when the spread’s modified Z-score falls below a user-defined threshold (e.g., -1.0), indicating extreme undervaluation of the main instrument relative to its pair.
4. Exit Signal: The position closes automatically when the spread reverts to its historical mean (Z-score ≥ 0).
Risk management:
Trades are sized as a percentage of equity (default: 10%).
Includes commissions and slippage for realistic backtesting.

Symbols Correlation, built for pair tradingOverview:
This script is designed for pairs trading. If you are not familiar with pairs trading, I suggest learning about it, as it can be a profitable strategy in neutral markets (or neutral trends between two assets). The correlation between two assets is the foundation of pairs trading, and without it, the chances of making a profit are low.
Correlation can be described in two opposite ways:
1: Absolute positive correlation (meaning the asset prices move together).
-1: Absolute negative correlation (meaning the asset prices move in opposite directions).
Any value between 1 and -1 indicates some degree of correlation, but generally, values higher than 0.7 or lower than -0.7 are considered significant.
Features:
Typically, correlation is measured using the closing prices. This script adds three more correlation studies based on open, high, and low prices. By using all four lines, we can get a better understanding of the pair's correlation.
How to Read This Indicator:
To use this indicator effectively, you need to input your pair as a ratio. For example, if your pair is TSN and ZBH, enter it in the symbol search as: TSN/ZBH
Gray Area : This area indicates "no high correlation" (default is between -0.8 and 0.8, adjustable in the settings).
Gray Line : This represents the close correlation within the "no high correlation" range.
Green Line : This represents the close correlation within the "high correlation" range.
Dot Lines : These represent the open, high, and low correlations.
Example Interpretations:
A : All four lines are close together & the line is green – very good correlation!
B : The line is gray, and the dot lines are apart – not a strong correlation.
C : When the close correlation remains green for a long time, it signals a strong correlation.
Application in Pairs Trading:
In pairs trading, aim for the highest possible correlation, and it is important to have a sustained correlation over a long period. Pairs that correlate only part of the year but not consistently are less reliable for pairs trading.
This is an example for good correlation for pairs trading:
This is an example for bad correlation for pairs trading:
Here is a view of my full indicators when doing pairs trading:

Trend Momentum Strength Indicator, Built for Pairs TradingOverview:
This script combines multiple indicators to provide a comprehensive analysis of both trend strength and trend momentum. It is tailored specifically for pairs trading strategies but can also be used for other trading strategies.
Benefit of Comprehensive Analysis:
Having an indicator that evaluates both trend strength and trend momentum is crucial for traders looking to make informed decisions. It allows traders to not only identify the direction and intensity of a trend but also gauge the momentum behind it. This dual capability helps in confirming potential trade opportunities, whether for entering trades with strong trends or considering reversals during overbought or oversold conditions. By integrating both aspects into one tool, traders can gain a holistic view of market dynamics, enhancing their ability to time entries and manage risk effectively.
Features:
* Trend Strength:
Enhanced ADX Formula: The script includes modifications to the standard ADX formula along with DI+ and DI- to provide more responsive trend strength readings.
Directional Indicators: DI+ (green line) indicates positive directional movement, while DI- (red line) indicates negative directional movement.
Trend Momentum:
Modified Stochastic Indicators: The script uses %K and %D indicators, modified and combined with ADX to give a clear indication of trend momentum.
Momentum Strength: This helps determine the strength and direction of the momentum.
Trading Signals:
Combining Indicators: The script combines ADX, DI+, DI-, %K, and %D to generate comprehensive trading signals.
Optimal Entry Points: Designed to identify optimal entry points for trades, particularly in pairs trading.
Colored Area at Bottom:
This area provides two easy-to-read functions:
Color:
Green: Upward momentum (ratio above 1)
Red: Downward momentum (ratio below 1)
Height:
Higher in green: Stronger upward momentum
Lower in red: Stronger downward momentum
Legend:
Green Line: DI+ (Positive)
Red Line: DI- (Negative)
Black Line: ADX
How to Read This Indicator:
1) Trend Direction:
DI+ above DI-: Indicates an upward trend.
DI- above DI+: Indicates a downward trend.
2) Trend Strength:
ADX below 20: Indicates a neutral trend.
ADX between 20 and 25: Indicates a weak trend.
ADX above 25: Indicates a strong trend.
Trading Signals in Pairs Trading:
Neutral Trend: Ideal for pairs trading when no strong trend is detected.
Overbought/Oversold: Uses %K and %D to identify overbought/oversold conditions that support trade decisions.
Entry Signals: Green signals for long positions, red signals for short positions, based on combined criteria of neutral trend strength and supportive momentum.
Application in Pairs Trading:
Neutral trend: In pairs trading strategies, where neutral movement is often sought, this indicator provides signals that are especially relevant during periods of neutral trend strength and supportive momentum, aiding traders in identifying optimal entry
Risk Management: Combining signals from ADX, DI+, DI-, %K, and %D helps traders make more informed decisions regarding entry points, enhancing risk management.
Example Chart (The indicator is on the upper right corner):
Clean Presentation: The chart only includes the necessary elements to demonstrate the indicator’s functionality.
Demonstrates: Overbought/oversold conditions, upward/downward/no momentum, and trading signals with/without specific scenarios.

Arbitrage SpreadThis indicator helps to find spreads between cryptocurrencies, assess their correlation, spread, z score and atr z score.
The graphs are plotted as a percentage. Because of the limitation in pine tradingview for 5000 bars a period was introduced (after which a new starting point of the graph construction will be started), if you want it can be disabled
The multiplier parameter affects only the construction of the joint diagram on which z score and atr z score are calculated (construction of the diagram is done by dividing one pair by another and multiplying by the multiplier parameter) is shown with a red line
To create a notification you have to specify the data for parameters other than zero which you want to monitor. For parameters z score and atr z score data are counted in both directions
The data can be tracked via the data window
Link to image of the data window prnt.sc
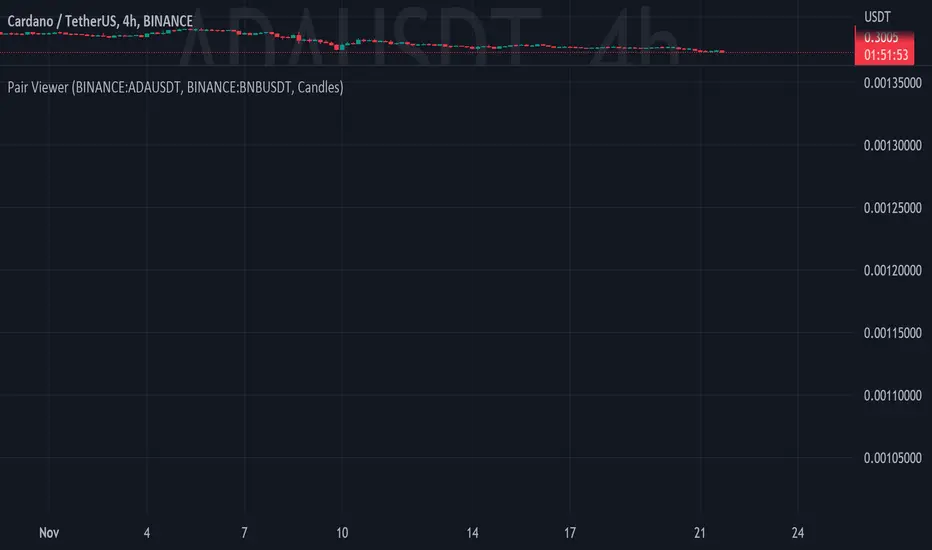
Pair ViewerPair-Trading is a recognized and widely used trading method, this indicator is a tool that allows via several display interfaces (2 at the moment) to see relative performance ratios of two assets.
The inputs are pretty simple to understand but here is the list of them :
- Ticker #1 : The first Asset's ticker // numerator of the ratio
- Ticker #2 : The second Asset's ticker // denominator of the ratio
- View as : Display Method
- Up Color : Color of positive candle (when close > open)
- Down Color : Color of negative candle (when close < open)
Of course, this indicator only shows stuff at the chart, it does NOT provide any investment advice.
two_leg_spread_diffThis script helps you discern the relative change of each leg in a two-legged spread over a given period. The main plot is a difference in log return over the number of bars identified by the "lag" parameter. E.g. if "lag" is 10 and leg one has increased 3% over the past ten bars, while leg two has only increased 1%, the plot value is 2%. The main plot is also colored blue when leg one increases while leg two decreases on a given bar, and red if the opposite is true. This feature identifies periods where the correlation between the two legs diminishes. The one and two standard deviation of the main plot is also plotted in faint background lines. Additionally, a table indicates the percentage in which the main plot is within one standard deviation (acc 1) and two standard deviations (acc 2). Note that the standard deviation updates on each bar, so the current standard deviation is not the one used to calculate the accuracy. Rather, if there are N bars, N different standard deviation readings have been used to compute the accuracy statistics.
The inputs are:
- timeframe: the timeframe of the chart
- leg1_sym: the symbol of the first leg
- leg2_sym: the symbol of the second leg
- lag: the number of bars back to reference for computing the log return of each leg
- anchor_to_session_start: for intraday charts only, this overwrites the "lag" input so that the "lag" always sets the point of comparison to the session start. This setting is used to compute the relative change over a single session.

Bollinger Pair TradeNYSE:MA-1.6*NYSE:V
Revision: 1
Author: @ozdemirtrading
Revision 2 Considerations :
- Simplify and clean up plotting
Disclaimer: This strategy is currently working on the 5M chart. Change the length input to accommodate your needs.
For the backtesting of more than 3 months, you may need to upgrade your membership.
Description:
The general idea of the strategy is very straightforward: it takes positions according to the lower and upper Bollinger bands.
But I am mainly using this strategy for pair trading stocks. Do not forget that you will get better results if you trade with cointegrated pairs.
Bollinger band: Moving average & standard deviation are calculated based on 20 bars on the 1H chart (approx 240 bars on a 5m chart). X-day moving averages (20 days as default) are also used in the background in some of the exit strategy choices.
You can define position entry levels as the multipliers of standard deviation (for exp: mult2 as 2 * standard deviation).
There are 4 choices for the exit strategy:
SMA: Exit when touches simple moving average (SMA)
SKP: Skip SMA and do not stop if moving towards 20D SMA, and exit if it touches the other side of the band
SKPXDSMA: Skip SMA if moving towards 20D SMA, and exit if it touches 20D SMA
NoExit: Exit if it touches the upper & lower band only.
Options:
- Strategy hard stop: if trade loss reaches a point defined as a percent of the initial capital. Stop taking new positions. (not recommended for pair trade)
- Loss per trade: close position if the loss is at a defined level but keeps watching for new positions.
- Enable expected profit for trade (expected profit is calculated as the distance to SMA) (recommended for pair trade)
- Enable VIX threshold for the following options: (recommended for volatile periods)
- Stop trading if VIX for the previous day closes above the threshold
- Reverse active trade direction if VIX for the previous day is above the threshold
- Take reverse positions (assuming the Bollinger band is going to expand) for all trades
Backtesting:
Close positions after a defined interval: mark this if you want the close the final trade for backtesting purposes. Unmark it to get live signals.
Use custom interval: Backtest specific time periods.
Other Options:
- Use EMA: use an exponential moving average for the calculations instead of simple moving average
- Not against XDSMA: do not take a position against 20D SMA (if X is selected as 20) (recommended for pairs with a clear trend)
- Not in XDSMA 1 DEV: do not take a position in 20D SMA 1*standart deviation band (recommended if you need to decrease # of trades and increase profit for trade)
- Not in XDSMA 2 DEV: do not take a position in 20D SMA 2*standart deviation band
Session management:
- Not in session: Session start and end times can be defined here. If you do not want to trade in certain time intervals, mark that session.(helps to reduce slippage and get more realistic backtest results)

TASC 2022.07 Pairs Rotation With Ehlers Loops█ OVERVIEW
TASC's July 2022 edition of Traders' Tips includes an article by John Ehlers titled "Pairs Rotation With Ehlers Loops". This is the code that implements the Ehlers Loops applied to pairs rotation trading.
█ CONCEPTS
John Ehlers developed Ehlers loops as a tool to visualize the performance of one data stream versus another. Initially, he used this tool to chart price versus volume. However, Ehlers loops proved to be suitable for determining the timing of the pairs rotation strategy . This strategy works by having a long position in only one of two securities, depending on which one is considered stronger at a given time.
When the prices of two securities (filtered and scaled with a standard deviation for consistent presentation) are plotted against each other, the curvature and direction of rotation on the chart can help guide decisions on long positions. For example, when plotting a stock versus a referenced symbol, a vertical upward movement while rotating clockwise is a sign of going long the stock. Similarly, a horizontal movement to the right while rotating counterclockwise is the sign to go long the reference. A higher probability of a reversal is expected when the price moves more than one or two standard deviations.
█ CALCULATIONS
The script uses the following steps to calculate the Ehlers Loops:
The price data of both securities in the pair are individually filtered using identical high-pass and SuperSmoother filters. This results in two band-limited data streams, having a nominally zero mean. The input parameters Low-Pass Period and High-Pass Period control the filter bandwidth and thus can modify the shape of the Ehlers Loops.
Subsequently, the filtered data streams are scaled in terms of standard deviation by dividing each of them by their root-mean-square (RMS) values. These data streams are plotted as zero-mean oscillators.
Finally, the scaled data streams are displayed one against another for the selected time interval (defined by the input parameter Loop Segments ). In the resulting scatterplot, the thicker line corresponds to the later data points. The fluctuations of the filtered price data of the chart symbol are plotted along the y -axis, and the price changes of the referenced symbol are shown along the x -axis.


R2D2 v1.0Скрипт для парного трейдинга.
Можно анализировать дельту между 2 инструментами.
Гистограмма показывает силу расхождения между ними.
Добавлен коэффициент умножения для каждого тикера, что бы выравнять баланс между инструментами.
Можно работать на любом ТФ. Не забывайте, что данный скрипт работает на МА, поэтому при выборе больших числовых значений возможно запаздывание.
______________
Script for pair trading.
You can analyze the Delta between 2 tools.
The histogram shows the strength of the discrepancy between them.
Added a multiplication factor for each Ticker to even out the balance between instruments.
You can work on any TF. Do not forget that this script works on MA, so when selecting large numeric values, there may be a delay.

RW Simple Pairs TradeA Simple Implementation of a Pairs Trading Strategy
It uses a simple moving average of specified length (default = 20) and enters at cutoffs set by Entry ZScore. Trades are exited at the moving average.
It is intended to be run on pairs of stocks. To Spread KO and PEP, for example, use the ticker KO / PEP * 1000
To visualise the trade better add Bollinger bands to your charts, corresponding to the SMA length and Entry ZScore criteria you specified.

Pair traderI figured I'd post this.
It's an indicator that plots the spread between two selectable instruments and also each individual instrument's line chart, with a colored fill to make it more clear visually when trading ratios.
In cointegrated pairs like audcad-0.50% , you can trade the range extremes, and buy the laggard/sell the leader when overbought/sold conditions are met + distance from the 66/253 EMAs, as outlined in my AUDCAD-0.50% post. (see related ideas)
Hope you find it useful!
Cheers,
Ivan.
