Sideways Scalper Peak and BottomUnderstanding the Indicator
This indicator is designed to identify potential peaks (tops) and bottoms (bottoms) within a market, which can be particularly useful in a sideways or range-bound market where price oscillates between support and resistance levels without a clear trend. Here's how it works:
RSI (Relative Strength Index): Measures the speed and change of price movements to identify overbought (above 70) and oversold (below 30) conditions. In a sideways market, RSI can help signal when the price might be due for a reversal within its range.
Moving Averages (MAs): The Fast MA and Slow MA provide a sense of the short-term and longer-term average price movements. In a sideways market, these can help confirm if the price is at the upper or lower extremes of its range.
Volume Spike: Looks for significant increases in trading volume, which might indicate a stronger move or a potential reversal point when combined with other conditions.
Divergence: RSI divergence occurs when the price makes a new high or low, but the RSI does not, suggesting momentum is weakening, which can be a precursor to a reversal.
How to Use in a Sideways Market
Identify the Range: First, visually identify the upper resistance and lower support levels of the sideways market on your chart. This indicator can help you spot these levels more precisely by signaling potential peaks and bottoms.
Peak Signal :
When to Look: When the price approaches the upper part of the range.
Conditions: The indicator will give a 'Peak' signal when:
RSI is over 70, indicating overbought conditions.
There's bearish divergence (price makes a higher high, but RSI doesn't).
Volume spikes, suggesting strong selling interest.
Price is above both Fast MA and Slow MA, indicating it's at a potentially high point in the range.
Action: This signal suggests that the price might be at or near the top of its range and could reverse downwards. A trader might consider selling or shorting here, expecting the price to move towards the lower part of the range.
Bottom Signal:
When to Look: When the price approaches the lower part of the range.
Conditions: The indicator will give a 'Bottom' signal when:
RSI is below 30, indicating oversold conditions.
There's bullish divergence (price makes a lower low, but RSI doesn't).
Volume spikes, suggesting strong buying interest.
Price is below both Fast MA and Slow MA, indicating it's at a potentially low point in the range.
Action: This signal suggests that the price might be at or near the bottom of its range and could reverse upwards. A trader might consider buying here, expecting the price to move towards the upper part of the range.
Confirmation: In a sideways market, false signals can occur due to the lack of a strong trend. Always look for confirmation:
Volume Confirmation: A significant volume spike can add confidence to the signal.
Price Action: Look for price action like candlestick patterns (e.g., doji, engulfing patterns) that confirm the reversal.
Time Frame: Consider using this indicator on multiple time frames. A signal on a shorter time frame (like 15m or 1h) might be confirmed by similar conditions on a longer time frame (4h or daily).
Risk Management: Since this is designed for scalping in a sideways market:
Set Tight Stop-Losses: Due to the quick nature of reversals in range-bound markets, place stop-losses close to your entry to minimize loss.
Take Profit Levels: Set profit targets near the opposite end of the range or use a trailing stop to capture as much of the move as possible before it reverses again.
Practice: Before trading with real money, practice with this indicator on historical data or in a paper trading environment to understand how it behaves in different sideways market scenarios.
Key Points for New Traders
Patience: Wait for all conditions to align before taking a trade. Sideways markets require patience as the price might hover around these levels for a while.
Not All Signals Are Equal: Sometimes, even with all conditions met, the market might not reverse immediately. Look for additional context or confirmation.
Continuous Learning: Understand that this indicator, like any tool, isn't foolproof. Learn from each trade, whether it's a win or a loss, and adjust your strategy accordingly.
By following these guidelines
Peaks

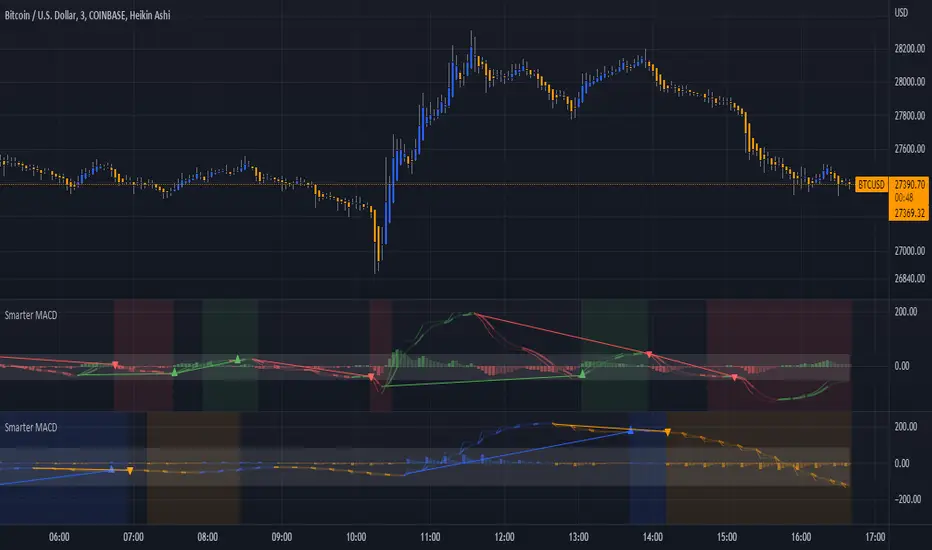
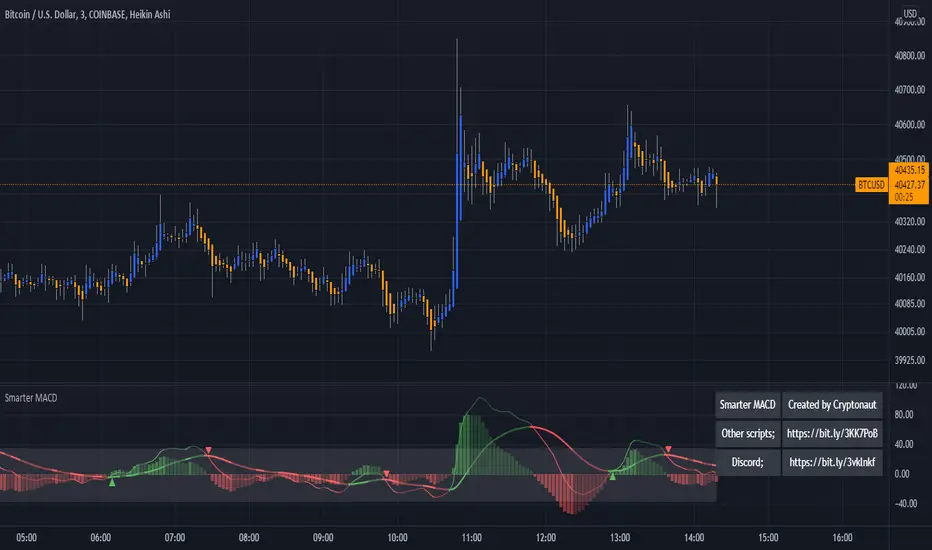
Smarter MACDA classic MACD with average peak and dip lines. The lighter green and red horizontal lines are the average peak and dip of the entire span, respectively. The second, bolder of the two lines are the averages of the peaks and dips above and below the overall peak and dip averages. The filled in color is to help visualize these averages and possible trade setups. Rework of the MACD + Averages script.
Lev Umanov Sin EquationThis indicator is taken from the calculations made by Lev Umanov. It predicts the peaks of Bitcoin. The indicator works with most BTCUSD pairings.

MACD + AveragesA classic MACD with average peak and dip lines. The lighter green and red horizontal lines are the average peak and dip of the entire span, respectively. The second, bolder of the two lines are the averages of the peaks and dips above and below the overall peak and dip averages. The filled in color is to help visualize these averages and possible trade setups.
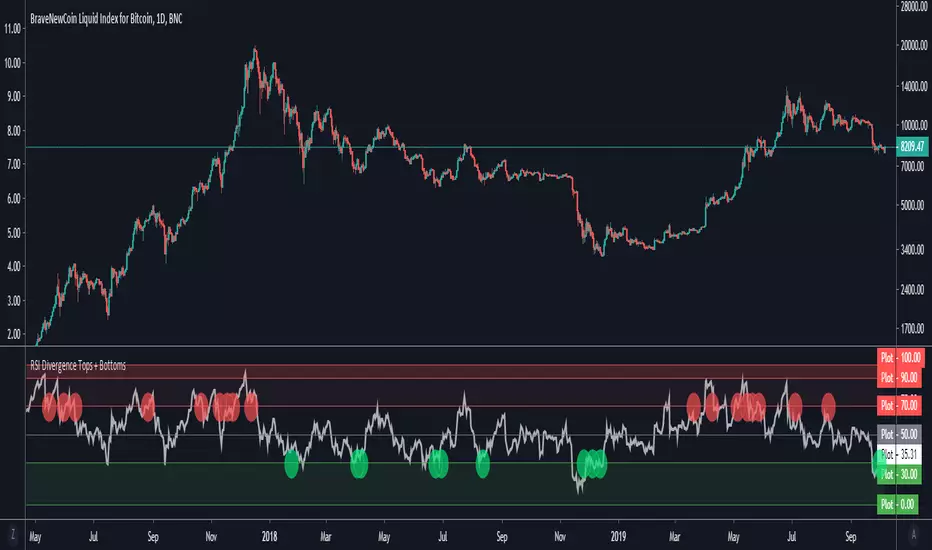
RSI Divergence Tops + BottomsRSI Indicator which plots local peaks and troughs in divergence.
Divergence is specified as:
- A higher price, with reduced RSI --> Potential Sell Point
- A lower price, with higher RSI --> Potential Buy Point
RSI Divergence should be used in combination with other indicators. This indicator identifies local tops and bottoms, with potential for macro trend shifts.
Read more about trading RSI Divergence on Investopedia here: www.investopedia.com
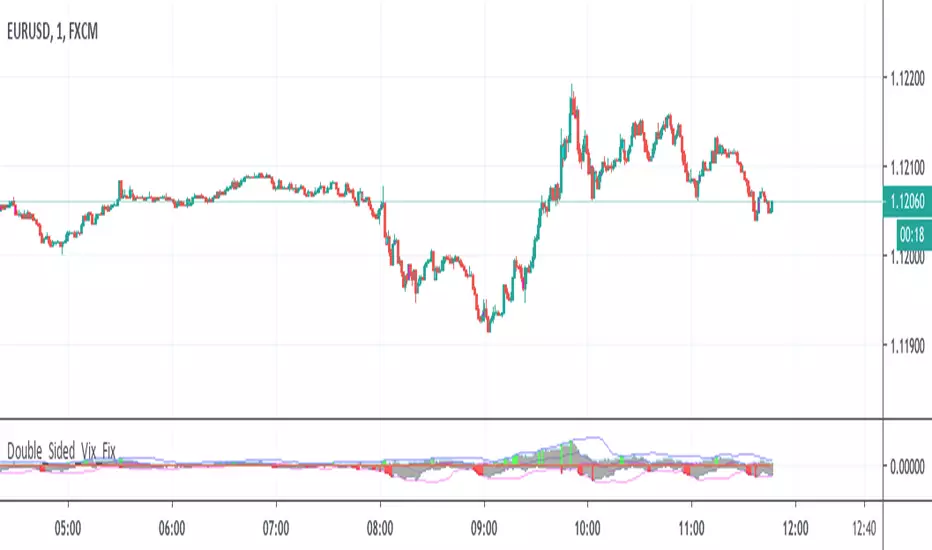
Double Sided Vix FixVixFix Enhanced by PeterO - Inverse Vix_Fix added, so now this is a dual-sided script (original VixFix shows only lows)
Note from the author: I wouldn't advise betting your strategies entirely on VixFix concept.
Original VixFix created by ChrisMoody on 12-26-2014...V3 MAJOR Update on 1-05-2014
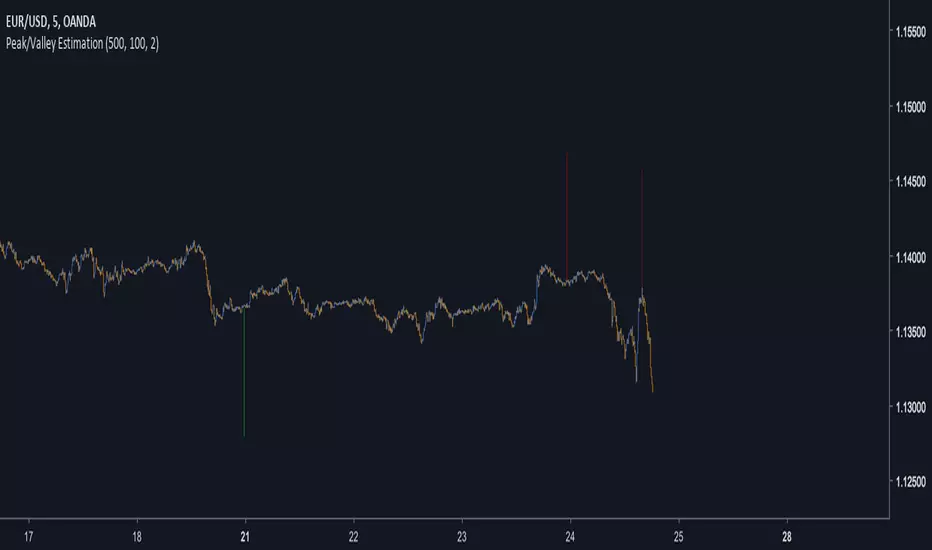
Peak/Valley EstimationEarly Signal
Estimating the Peaks and Valleys or extrema of the price is one of the best way to catch up early movements of a trend. Of course there is no perfect way to do so, if we want a perfect estimation of peaks and valleys then we must use a non causal indicator ( repainting ), if we want a causal indicator ( non repainting ) then we will need to tradeoff accuracy for allowing our indicator to be causal, its always a matter of tradeoff at the end when trying to have a desired effect (smoothness/lag for filters) .Our indicator is causal, it wont repaint but the accuracy will depend on various parameters.
In order to detect peaks and valleys in a certain period we must detrend the price, this mean subtracting it by its moving average. We take the absolute value of this result and we filter it with a local linear regression ( LSMA ) in order to eliminate noise, then we make the assumption that the highest of our result is or a peak or a valley of the price, so we divide our detrended calculation by its highest and we get a scaled result. Lets call this final result the peak index .
Parameters
There are 3 parameters in this indicator, a length parameter who control the period of the highest mentioned above, a smooth parameter who smooth our detrended price, and finally a mod parameter who select the trigger method for estimating a peak/valley.
Here are how mods work :
mod = 1 : when the peak index is equal to 1 and the previous value is not equal to 1 then we have a peak/valley. Its the fastest of the 3 mods but the one with less accuracy.
mod = 2 : when the peak index crossunder 0.8 then we have a peak/valley. This method is more robust but slower than the previous one.
mod = 3 : when the peak index is not equal to 1 and the previous peak index is equal to 1 then we have a peak/valley. Its an average of the precedents mod in term of speed and accuracy.
Lower length values tend to estimate the peak/valley of short periods of time but can also lead to the reverse desired effect ( breakouts signals ). Smoothing is important since it reduce the number of noise in our calculation and therefore help to get better results, its a parameter that should be high, sometimes higher than length if this one is low.
Estimation of medium terms peaks/valleys with length and smooth parameter both period 100 and mod = 3
Estimation peaks in palladium way to early, an example of bad accuracy. Such behaviour can be fixed with a change in the parameters.
Complementarity With Classics Indicators
As i said before its always a matter of tradeoff, here we get faster signals but we loose in accuracy, at the contrary classics indicators often have slower signals but with more accuracy. Mixing both of them can provide additional robustness in a strategy, lets take back our palladium case, using mod 3 could have been better, but its still not optimal, so lets use a classic indicator such as a moving average of period 200, our conditions are :
Long when our peak/valley estimator estimated a valley and the price crossover our moving average.
Short when our peak/valley estimator estimated a peak and the price crossunder our moving average.
here is an exemple of such signal :
We balanced our tradeoff in a way to fix both methods problems, of course its still not a perfect fix but it provide more robustness.
Other Uses
The indicator can also be used only as an order closing indicator, its safer than taking a position based on its estimation. The indicator can also give a use to the peak index used in the calculation as a trend strength indicator.
Values below 0.5 indicate a ranging market while values over 0.5 indicate a trending market.Since its a scaled measure you can use it a smoothing constant in a adaptive filter.
Conclusions
I showed how to estimate peaks and valleys and how to use such information in order to make better decision when using classical indicators, of course at the end nothing is perfect and considering the non stationarity of the markets the parameters efficiency could change drastically.
For any questions/demands feel free to pm me, i would be happy to help you
Normalized Average True RangeThis indicator was originally developed by John Forman (Stocks & Commodities, V.24:6 (May, 2006): "Cross-Market Evaluations With Normalized Average True Range").
Mr. Forman uses a normalized average true range indicator to analyze tradables across markets.
Good luck!

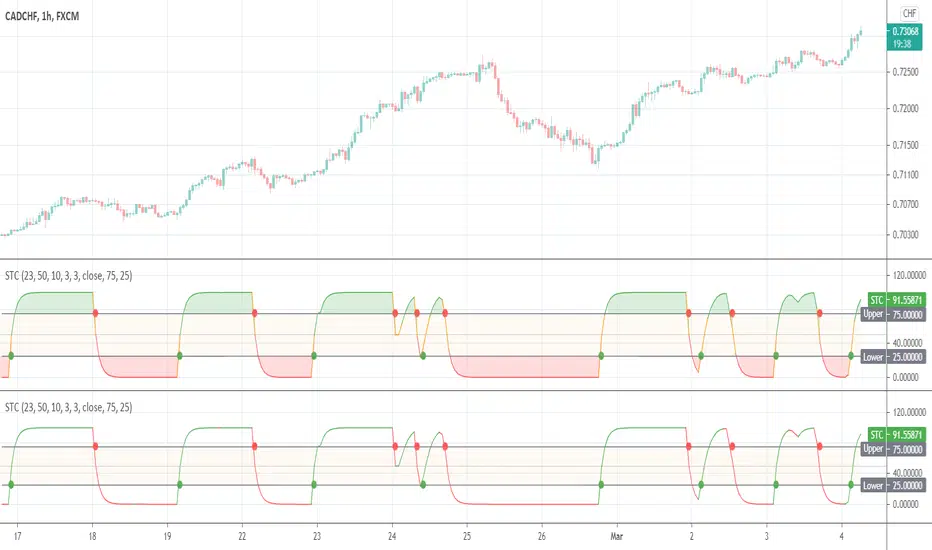
Schaff Trend CycleThis indicator was originally developed by Doug Schaff in the 1990s (published in 2008).