Click Draw TrendLine [UhoKang] v2
This is an indicator that directly draws a trend line by clicking on the candle.
Click to Create Trend lines !!
Create a trend line by connecting A, B, and C with three vertices.
1. Draw Bear Trend line
Click pivot high : First pivothigh of the downtrend line
Click pivot low : pivotlow of the downtrend line
Click pivot high : Second pivothigh of the downtrend line
2. Draw Bull Trend line
Click pivot low : First pivotlow of the uptrend line
Click pivot high : pivothigh of the uptrend line
Click pivot low : Second pivotlow of the uptrend line
Modefiy Trendlines
1. Edit Bear Trend line
Drag Red , ,
2. Edit Bull Trend line
Drag Green , ,
Pivot points and levels

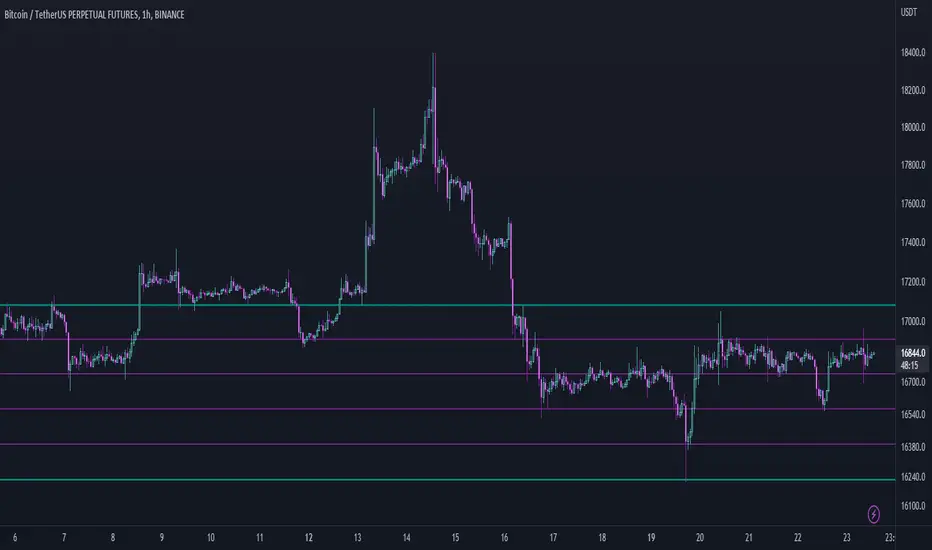
Margin Pressure ThresholdsIf you thought margin trading liquidation levels only mattered to those trading with leverage, think again. Margin traders wield significantly more capital than your average retail investor, and their collective behavior can move markets quite predictably. The basic premise (theory popularized by Forrest @Cryptostackers YouTube) is that margin traders will have their liquidation points protected by strong support (for longs) or resistance (for shorts). Therefore, by simply identifying strong support/resistance levels, we can predict the thresholds at which margin buying and selling pressure will subside.
This indicator is interactive, so it just takes a click. Select a strong support level to see where margin buying pressure is likely to drop off, i.e. where to expect resistance and a potential local top. Or, select a strong resistance level to see expected support and anticipate the local bottom. Even better, look at long and short levels together to identify high probability support/resistance zones where levels align.
And for margin traders, this indicator makes life easy. Just click to select the support/resistance you want protecting your liquidation level, and quickly see the amount of leverage is safe to trade with.

Divergence Finder [Multigrain]█ OVERVIEW
This indicator is a divergence finder, designed to be overlayed on top of any oscillator. By utilizing an Exponential Moving Average, rather than built-in pivot functions, this allows for insignificant pivots of the oscillator to be filtered out. Additionally, by sampling more than just the previous oscillator pivot, this allows for divergences to be found that would otherwise be overlooked through other methods.
█ CONCEPTS
Interim Price Threshold
A new metric used when determining valid divergences is the Interim Price Threshold (IPT). The IPT is the maximum percent delta the price is allowed to "poke-through" the divergent line at any given time.
Interim Oscillator Threshold
Similar to the Interim Price Threshold, the Interim Oscillator Threshold (IOT) is the maximum percent delta the oscillator is allowed to "poke-through" the divergent line at any given time.
Dynamic Midline
Commonly a static midline is utilized when determining whether a divergence may be bullish or bearish. By utilizing the built-in percentile nearest rank function, the midline is automatically and dynamically determined based on the previous 250 bars. As a result certain divergences which may otherwise be overlooked will be discovered.
█ SETTINGS
Oscillator Source: The oscillator in which you want find divergences from. Default to a MACD oscillator when unchanged.
Price Source: The price source in which you want to find divergences from.
Moving Average Length: The length of the exponential moving average used when determining the pivot points of the selected oscillator.
█ USAGES
Divergence in technical analysis can indicate a significant bullish or bearish price move. A bullish divergence occurs when an asset's price makes a new low while an indicator begins to rise. A bearish divergence occurs when the price makes a new high but the indicator under consideration makes a lower high.

Sw1tchFX - Average Daily RangeDESCRIPTION AND OVERVIEW
The Average Daily Range is a measure of volatility (typically across 5 days for the FX markets). I originally saw this being used in a trading system called ANTSSYS by Daryll Guppy and some other developers. I couldn't find it anywhere so I decided to build it from scratch.
What this does is allow you to measure volatility across various FX assets (I will apply other asset classes in the future that this is applicable to i.e. Crypto, Commodities, Blue Chip Stocks), and set realistic targets based off that volatility. Overall, this makes much more sense to me in the FX markets rather than support and resistance lines because it's based off the actual movement of the asset class. Market research shows that an asset class has a 80-85% chance to reach 75% of it's Average Daily Range (ADR).
Let's take a look at the daily ADR on the GBPNZD 15m chart. Notice how the values of the ADR act as real support and resistance based off the volatility of the asset. In this case, price did not quite reach the 75% ADR target.
Let's take a look at another example on EURNZD 15m chart. In this case, price hit the 75% target.
It's important to note that these levels do not bound the price. The probability that price exceeds it's 75% ADR is fairly low, but not impossible. Especially during important news events. Let's look at the recent USDCHF 15m chart for example.
Additionally, you can use these values to measure longer term movements (Weekly, and Monthly)
Here is a weekly view:
And a monthly view:
HOW I USE THIS
I use this in conjunction with some other indicators I've developed. Typically, I use range bars since I only care about price, not time. Additionally, averages are smoother when time is not taken into account and only price.
HOW THE CANDLE OPEN AND CLOSE IS CALCULATED
This is done based off of your own specific time zone and from the daily candle. So for me on PST, the daily candle will close at 1400. Once closed, a new ADR value is automatically calculated and added to the chart. There is an option to show past ADR values if you would like to see them or conduct additional research.

The Only EURUSD Trading Strategy You Need - KaspricciThe Only EURUSD Trading Strategy You Need
I got the idea to this strategy from a youtube video uploaded by Trade Beta. It is designed to capture the early market move of major forex pair EURUSD at beginning of New York Stock Exchange (13:30 GMT). Trade Beta tested his strategy on the 5 minute chart. I have set all parameters to same values as shown in the video.
The strategy creates two pending orders at the recent swing high and low. Once the first pending order entered, the remaining one is cancelled. Latest at the end of market session all pending orders are cancelled and all open trade are closed as well.
In rare case that price at session opening is above swing high, only a pending sell stop order is created at swing high price. And in case price is below swing low, a pending buy stop order is created.
Settings
Trading Time - default: New York Stock Exchange opening hours. Pending orders are created at the close of the first candle within the session.
Swing High Source / Bars - default: High / 5 bars. Used to find the latest swing high within a range of 5 bars left and right. Price is used for buy stop order.
Swing Low Source / Bars - default: Low / 5 bars. Used to find the latest swing low within a range of 5 bars left and right. Price is used for sell stop order.
Stop Loss Type - default: ATR. You can switch between stop loss calculation based on Average True Range value or fixed value.
ATR Length / Factor / TP Ratio - default: 14 / 2.0 / 2.0. Used to calculate the Stop Loss as ATR * Factor and Take Profit as Stop Loss * TP Ratio.
FIX Stop Loss / Take Profit - default: 10 pips / 20 pips. In case you select Stop Loss Type = FIX, these value swill be used.
This strategy is for educational purposes only! It is not meant to be a financial advice.

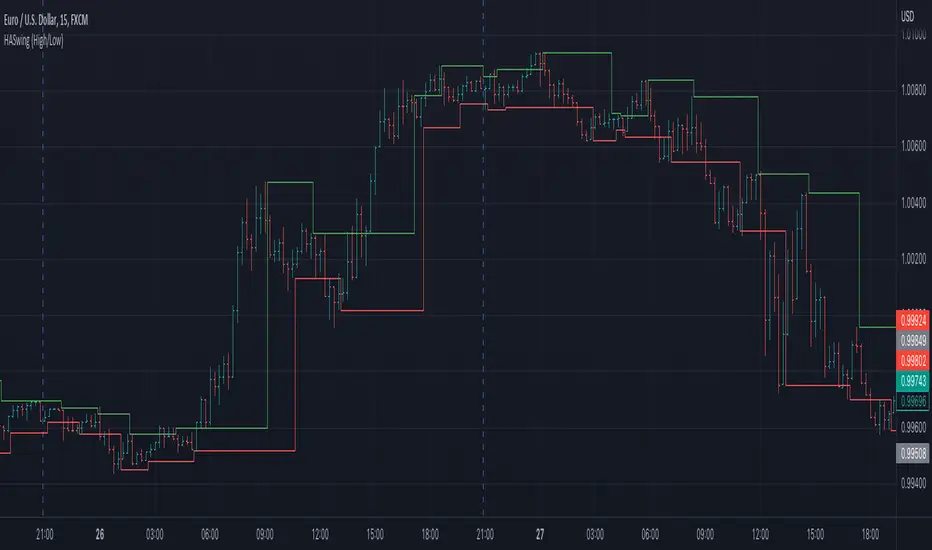
Heiken Ashi Swing High/LowIt uses Heiken Ashi candles to detect recent swing high and low.
It can be used as a stop-loss or support/resistance indicator.
Q-TrendQ-Trend is an multipurpose indicatorm that can be used for swing- and trend-trading equally on any timeframe (non-volatile markets are better for this thing).
Settings:
Trend period - used to calculate trend line in the special moments(will explain below);
ATR Multiplier - changes sensitivity. The higher the multiplier = the more sensitive it is.
Also option to smooth source data (helps get cleaner signals, as always).
How to use?
Signals are given on the chart. Also ou can use trend line as S/R line.
The idea behind:
Terms:
SRС = Source
TL = trend line;
MP = ATR multiplier;
ATR = ATR :)
TL = (highest of source P-bars back + lowest of source P-bars back) / 2
Epsilon = MP * ATR
I was thinking for a week about combining volatility and relation between highest and lowest price point. That why I called indicator Q-Trend = Quantitative Trend , as I was trying to think about price in a mathematical way.
Okay, time to go philosophical:
1) TL is shows good price trend, but as it is slow enough and not enough informative, we need add additional conditions to produce signals.
2) Okay, so what can we add as conditions? We need to take volatility into account, as it is crucial in the moments of market uncertainty. So let's use ATR (Average True Range) somehow. My idea is that if SRC breaks TL + ATR , then it means that there will be upmove and we update our TL . Analogically for SRC breaking TL - ATR (breaks are crosses of TL +- ATR lines) .
Conclusion:
- if SRC breaks TL + ATR , it is a BUY signal and update of trend line;
- if SRC breaks TL - ATR , it is a SELL signal and update of trend line;
I think that such indicator already exisits on TradingView, as I've already saw something similar, but long ago, so please don't report, if such thing already exists.
But if not, then I hope, that you will gain some profits with Q-Trend :)
I will continue my work on this thing, so stay tuned.
Trade with your own risks and have your profits!
Wish you all the best!
- Tarasenko Fyodor

Opening Range with Infinite Price TargetsOpening Range with Infinite Price Targets is an ORB indicator that automatically generates price targets into infinity based on a user-defined % of range.
This indicator includes many nice-to-have features missing from other indicators. Such as:
Price Target Labels with Price tooltip, want to know exactly what price pt3 is at? Hover over it and see.
Custom Defined Range time, Set your Range Start and end time to whatever you need, Doesn't have to be pinned to opening range!. Note: Time is in chart time.
Historical View (Default off), Tired of your chart looking messy with a ton of lines from historical data? No problem! You can choose to view or not view historical data.
Alerts for Range Breaks, First Range Breaks, and Discovery Price Target hits. As well as Exported Values for Range High, Low, and Mean to set your own alerts from custom sources.
Custom Price Targets, set your price targets to a % of the range based on your own strategy.
Last but not Least, Infinitely Generating Price Targets. They just keep building. New Targets will be generated when the price closes above/below the current farthest target.
Enjoy!

Pivot PointsIndicator calculates the basic pivot points from previous day's h/l/c on intraday charts

Range SlicerThis is a tool I quickly put together to work along side of my round number and Quarter Theory Scripts. This script allows you to set a price range between to values and slice them up into equal price zones. Happy Trading!
RSI & BB QQE Mod (highlight)This script is a combination of the RSI, QQE and BB
Here is an explanation on how I combined them, and how they are used:
- RSI (Relative Strength Index)
- Display a smoothed version of the RSI to identify "oversold" and "overbought" market phases
- Used to calculate a QQE
- QQE (Quantitative Qualitative Estimation)
- Used to identify trend direction and trend strength
- Used to set a basis for the BB
- BB (Bollinger Bands)
- Used with QQE as a basis to determine a relative definition of "high RSI" and "low RSI"
- Used with QQE as a basis to determine the volatility of the RSI at a given moment
- Used to predict pivot points
Here are the main signals:
- When "RSI Smoothed" line above the Upper BB then "RSI Smoothed" line turns green
- Also , display green background color highlight
- Also , and if "RSI Smoothed" is above the overbought line then display a second green background color highlight
- When "RSI Smoothed" line bellow the Lower BB then "RSI Smoothed" line turns red
- Also , display red background color highlight
- Also , and if "RSI Smoothed" is bellow the oversold line then display a second red background color highlight
A tool codded to be aesthetically pleasing and VERY customisable:
- Designed for both light theme and dark theme users
- Value can be easily modified in the settings
- Colors can be easily swapped in the settings
- Opacity of "fill" & "bgcolor" regrouped as a single input
A tool codded to be easy to read and to learn from:
- Sources and inspirations all listed within the script
- Structure easily identifiable (to understand with little to no effort how the script works)
Notes :
- This script is lagging, because of that I do recommend using it on relatively large timeframe
- This script is OpenSource, feel free to reuse it, but if so please remember to include a link to my script in your sources
- This script is not a magical tool, use at your own risk

Support & Resistance Trendlines with PP + Fib. Channel█ Support & Resistance Trendlines with Pivot Points + Fibonacci Channel
This script automatically draw support and resistance trend lines based on pivot points and add a fibonacci channel.
It will show potential patterns with the help of support and resistance lines as well as breakout target and pullback entry with the fibonacci extension and retracement levels.
It is based on atolelole's script, I only made it more configurable so please check out his script.
I added the possibility to change values and add additional retracement and extension levels.
I also made it customizable with the possibility to change lines color, width and style.

Convert ETF to Futures/IndexThis indicator is used to automatically map an ETF's VWAP and 10 levels above and below the strike of your choice, to the futures or index instrument currently being viewed/traded. This works very well when using both SPY to ES/MES/SPX or QQQ to NQ/MNQ/NDX to plot the ETF strikes and can lead to some incredible trades, especially when trading level to level. Since SPY, QQQ, IWM, and DIA have the same price action as their futures iteration, there seems to be a direct correlation between their levels and VWAP . This indicator is made to easily map these key levels to the appropriate futures instrument. If you have a way to measure GEX centered around a certain level, I recommend color coding the lines to help indicate whether the level will have strong positive or negative gamma hedging associated with it.

Bodies X Wix Version of Smart Money Tools by makuchaku & eFeThis is the same Script as Super Fair Value Gaps / FVG /BoS / by makuchaku & eFe. Mine Should Default to Large Text instead of small. The Super Order Blocks I believe was meant to for you to find one of the many Smart Money tools such as turn on the Fair Value gap but leave the others off, or Turn on where the Break of Structure and leave the others off. The reason I believe this is because the default values for each of the structures were default colored (green for positive and red for negative) for all.
Mine has a different Color for every possible structure. As long as you can read with the larger text that I added, then you can create your own boxes positive for break of structure, rejection block, order blocks and fair value gaps for any time frame. The reason I did that is because There's only certain things I believe I will need to mark for myself in each time frame, and then from there You can stretch iyour own box out further in time because if price touches a fair value gap for example, the fair value gap should conyinue in time until at least 2 candles have filed the Fair valu gap going both directions. That's truly when the fair value gap should is mitigated and will from off the chart. However, If I knew How to add the code for that, I would.
Additionally, I have the Max Boxes per chart, so you should have the ability to see every OB, FVG,RJB, & BoS on the chart
I tried my hardest to create a colored border that was different from the box. But the way the original was coded was almost impossible to do. Because they defined each of the structures (FVG, OB, BoS, RJB) outer levels, when the outer levels connect via math in the code, then it joins all the outside lines for a rectangle. When creating a box, the coloe will always be the same as the border unfortunately. (Unless I replan this from the beginning)
I also Changed the default labels for reach structure from a hard to read gray to a white that pops out.
Also, chart indicators are a little large as well. Such as the cross, sideways cross, The green Triangle, and the white Diamond. You'll get used to it or you can change it as well.
Creating videos for students, you need something they can see.
So, I just wanted to ensure everything was a little more unique and easily usable when showing this to my students when I send them private videos for our weekly lessons. I'm trying to learn how to use the IPFS for THAT, (which i see has invaded PineScript) Hope this indicator helps.
If you're to borrow this, Just make sure you keep the authors in the name makuchaku & efe

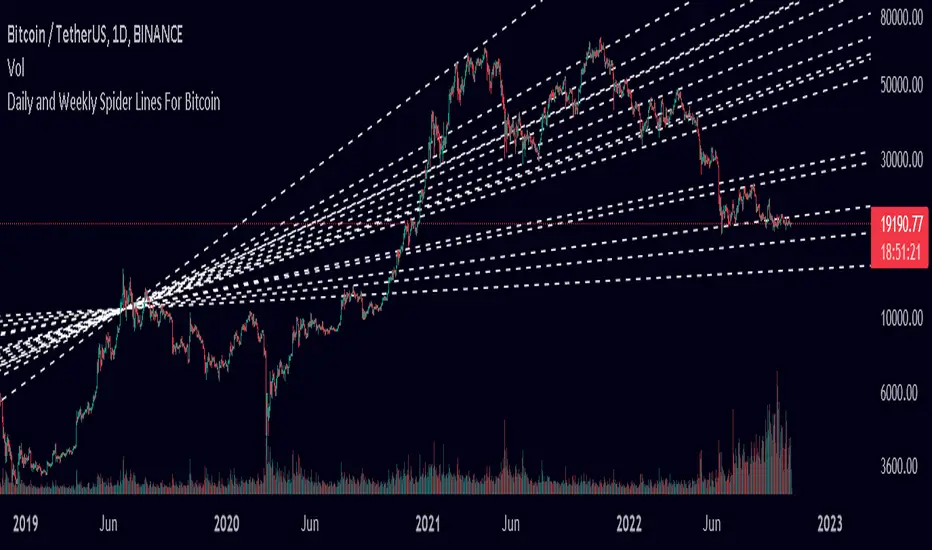
Spider Lines For Bitcoin (Daily And Weekly)I haven't seen any indicator do this, so I decided to publish this to form automatic Spider Charts without actually going through the effort of drawing them!
This script charts dotted lines (spider lines) all over, depicting support and resistance levels.
It works by connecting some candles from the 2018 bear market to the candle from 1st July 2019, followed by extending the lines to the right, making support and resistance levels for the future. The script works only for the daily and weekly charts for Bitcoin.
The levels are accurate to a good extent.
If the lines don't load, zoom out until the 2018 bear market top and it should load then.
Have fun with this indicator!