Random Price Action Visible Chartplots randomly generated price (closing basis) from LHS of the chart. Re-plots each time you scroll
-just a curiosity really; perhaps a lesson in seeing patterns where there are none; 'fooled by randomness' etc.
-always anchors/starts from the real close of the asset on the visible Left hand side of the chart.
-adjust ATR as you like (bigger = probably more reliable/realistic).
-adjust ATRmultiple as you like (discretionary; basically how many ATR ranges above/below last bar's random close, will the maximum random value above/below be; default is 1.5x (arbitrary).
Priceaction

Big 8 Intraday TICKAt the start of each trading day (0930 EST), this indicator calculates the intraday price difference between open and close for the eight largest market cap stocks (AAPL, AMZN, GOOGLE, META, MSFT, NFLX, NVDA, and TSLA), assigns a +/-1 for each, and then plots the cumulative change. An EMA has been added for smoothing purposes that is set to 5 but can be changed. Please note indicator is best used on lower timeframes (15 min or less) and has no applicability to time frames above 1 hour.
The thought behind this indicator is those eight major stocks drive a majority of intraday price change in indices like SPY and QQQ that are heavily weighted towards these stocks, therefore they should be a leading indicator in price change. You can often catch a move in SPY or QQQ one to two bars (on 1 min chart) ahead of the actual move because you see this indicator moving strong to one direction.
It's not perfect as there are divergences you will see when you compare historical charts, but oftentimes those divergences ultimately lead to significant price swings in the same direction as this indicator, so recommend being on watch to pull the trigger when you see those and price confirms.
You can use this indicator in a few ways:
1. Confirmation that your current trade is in the same direction as this indicator
2. Use the zero cross as a trigger for put or call entry
3. Focusing only on calls/longs if the value is above 0, or only puts/shorts if the value is below zero. Just be sure to keep an eye on reversals.
If you have recommendations on how to improve, let me know and I'll do my best to make changes.

Weekday Change & Volume Average TableHaving a reference point for comparing with current data has always been an important task in market analysis. This script tried to give a better understanding based on weekdays.
This script shows that in the current ticker, what is the average movement of the price (High-Low) and volume for each weekday. Depending on the market and the exchange it should be different.
The Interesting point is that, for example in BINANCE:BTCUSDT , on Saturday and Sunday, volume is about 30% less and the price movement is about 20% less.
The script can be used on any timeframe and any symbol, just remember that the data shown is based on the candles on the chart, so it is different also based on your tradingview's account since Historical bars available for Basic is 5K, Pro & Pro+ is 10K and Premium is 20K; And in lower timeframes it is calculating more recent data.

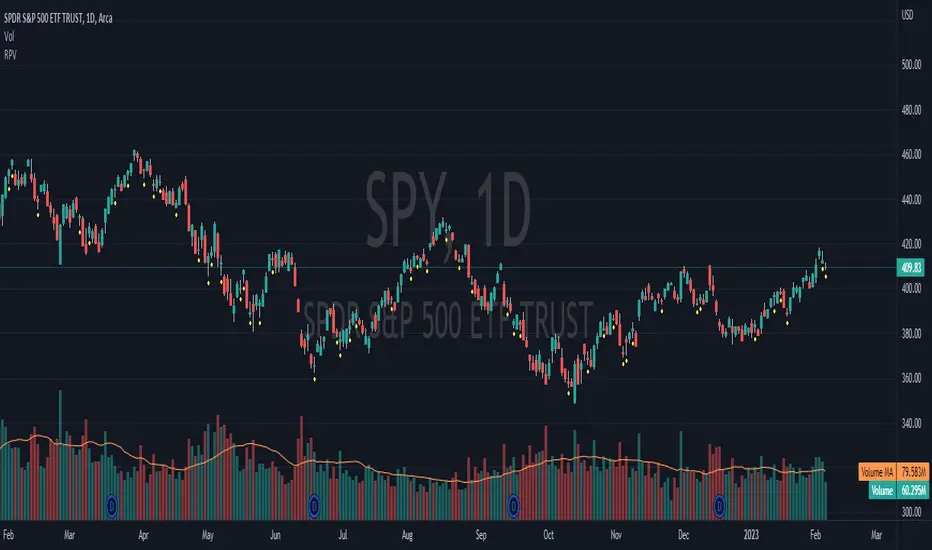
Relative Price Volume
Relative Price Volume is an indicator which shows anomalies between price and volume on a chart over a given period. The goal is to identify potential reversal and/consolidation areas for price as it relates to volume. It is a simple variation of a Volume at Price indicators. It can also be used to mark potential support and resistance lines on the chart as the areas it signals is where the price battles are waged.
Settings:
Period = length for which to calculate average candle body and average volume
Long Factor = relative size multiplier to determine if a candle is larger than average or if volume is higher than average
Short Factor = relative size multiplier to determine if a candle is smaller than average or if volume is lower than average
Anomaly Conditions
1. If a candle is larger than average and volume is lower than average, then this is an anomaly, and we should be on alert for a change in momentum.
2. if a candle is smaller than average and volume is higher than average, then this too is an anomaly and should put us on alert.
The indicator will draw a cross on the chart indicating the candle is that is flashing the warning that the run is done and a potential consolidation and/or reversal is pending. Used in conjunction with support and resistance levels this could signal a time to enter or exit a trade.
The default size factors considers a candle or volume:
1. Larger than average if it is 60% or more (.6) larger than average.
2. Smaller than average if it is 40% or less (.4) smaller than average.
Hope this helps! Happy trading!
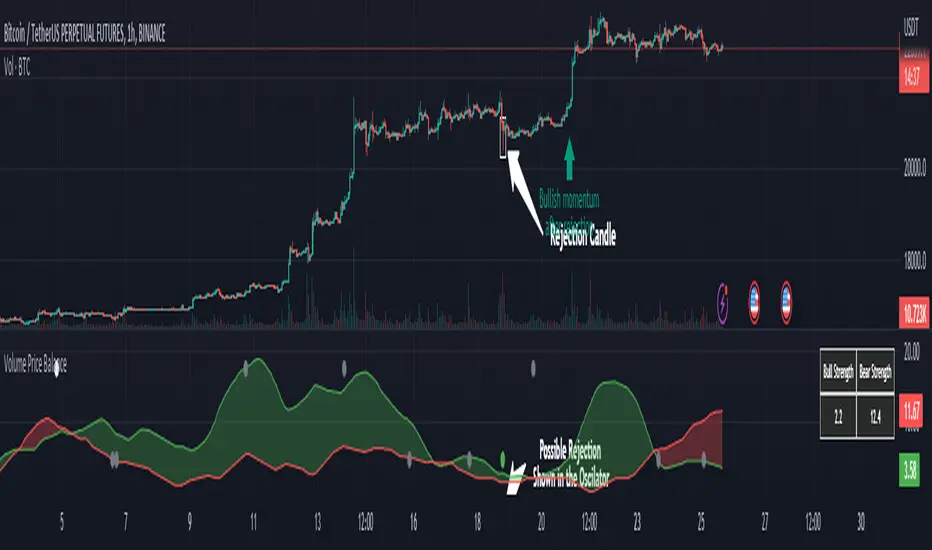
Volume Price Balance by serkany88This idea has been in my mind for a while. We all know how important volume is to technical analysis but volume and price itself doesn't mean much when volatility and momentum of the current trend is not taken into account. With this oscillator we try to combine all these factors into one indicator and provide a simplified interpretation of this relationship with spread analysis. This indicator can be used in all timeframes but higher timeframes like 1 hour and above will provide most stable results.
How it works?
This oscillator tries to analyze volume spread along with price spread based on wyckoff methods and attains certain "strength value" for each candle and it's relationship with the volume. After this calculation preferably we remove detected rejection candles from overall calculation and draw them as plots. The multipliers of the strengths can be changed from the settings.
Green Line Above Red Line = Bullish momentum stronger
Red Line Above Green Line = Bearish momentum stronger
Top circles mean possible bullish reversal candle detected. Gray is weak, White is normal and Red top circle means strong possible reversal detected.
Bottom circles mean possible bearish reversal candle detected. Gray is weak, White is normal and Green bottom circle means strong possible reversal detected.
Let's check the example below
As you can see we see a green dot appear in a somewhat weakening bullish momentum, this can mean possible reversal can happen soon and it does.
Below is a bearish example
In this example we see a possible strong reversal signal in a increasing bullish momentum and the price reacts immediately after the candle.
We also have a table that shows the current non-smoothed result of trend strength based on calculated price-volume spread at top right of the oscillator.
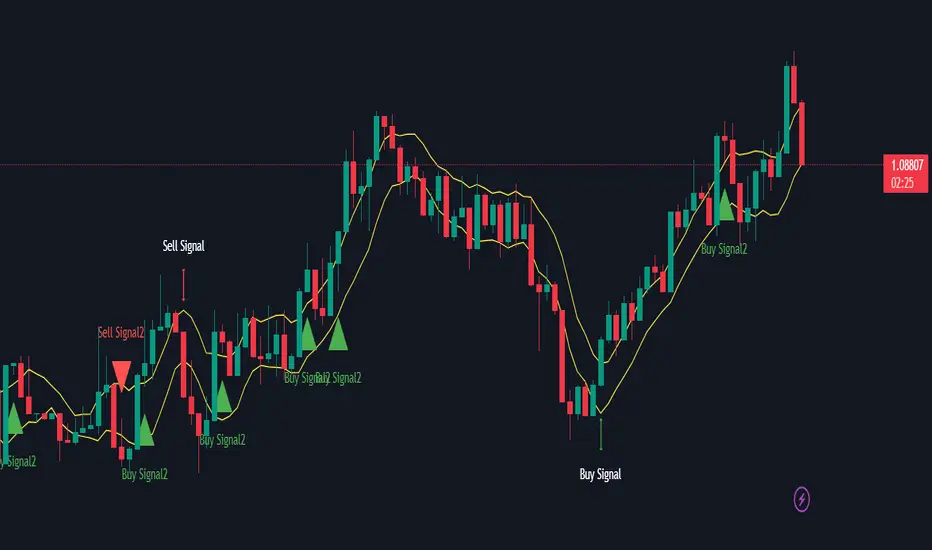
PAC newThis indicator will alert you when a candle goes above or below the price action channel (PAC) but only on the first or second candle after a colour change in candle.
When price is above the price action channel that is a bullish sign, when price is below the PAC that is a bearish sign.
The idea is that a sudden change in price is a cause to investigate further price action moving in that direction so the indicator aims to identify reversal
Scalping strategy that works on 5 min chart and aims to gain 10 pips. Do not act on every signal. Further investigation is required, for example by looking at RSI oversolf and overbought levels. For example, at an oversold area, a buy signal is more valid
MATHR3E RAMP-MA█ OVERVIEW
MATHR3E RAMP-MA (R-MA) is a trend following indicator.
█ CONCEPTS
Disclaimer:
MATHR3E RAMP-MA indicator is intended for advanced traders and may fit your profile, whether you are a day trader or a long-term investor.
It was originally developed by a renowned market analyst and documented in numerous books. Among them is the author Jason Perl.
It is recommended to have read the trading techniques mentioned in the books covering this indicator beforehand.
How to use:
MATHR3E RAMP-MA is useful for determining if a market is trending and when so, to procure entry points to initiate a trade in line with the expected directional move.
It can be applied to markets as a stop-loss, as well as a low-risk entry qualifier in conjunction with other indicators of the same author.
Moving Average (R-MA I):
Only displayed when market is trending
• Bull trend: Green (moving avg Lows/Period)
• Bear trend: Red (moving avg Highs/Period)
Moving Average (R-MA II):
Always displayed
• Bullish outlook on the market: the 3-day moving average must be positioned above the 34-day moving average
• Bearish outlook on the market: the 3-day moving average must be positioned below the 34-day moving average
█ FEATURES & BENEFITS
Versatile:
This indicator is based on relative price action, so you can apply it to any market or time frame without having to change the default settings.
Rate of Change:
The ROC is calculated for the fast and slow periods of the R-MA (II).
R-MA (II) is colored blue when its rate of change is advancing and maroon when it is declining.
Breakout Qualifier:
A close above/below the moving average R-MA (I) that is confirmed by the following price bar's opening price
Materialized on chart with Flags:
• Green when bear trend ends
• Red when bull trend ends
Alerts
Get notified on:
• UpTrend breakout
• DnTrend breakout
• Any breakout Signal

RSI Accumulation/Distribution [M]Hello everyone,
After my long tests, I observed that the rate of change of direction of the price was high after the periods when the RSI spent a long time outside the band. As a result of my observations, I prepared this indicator.
This indicator shows you the accumulation and distribution areas that occur outside the rsi band.
There are 3 different levels available.
Level 1 = 5 Bars
Level 2 = 7 Bars
Level 3 = 9 Bars
For example, if the RSI spends more than 9 bars below the 30 level or above the 70 level, it will paint that area red. Levels can be changed from the indicator settings. The rsi is smoothed with simple moving average to reduce fake signals.
Using the RSI A/D indicator with different indicators or patterns will increase your success rate.
Examples:

Big Poppa Code Strat & Momentum Strategy IndicatorThis indicator is a combination of a few things in order to work with a unique trading style gleaned from Callme100k, jrgreatness, TrustMyLevels , FaithInTheStrat, Rob Smith and Saty Mahajan.
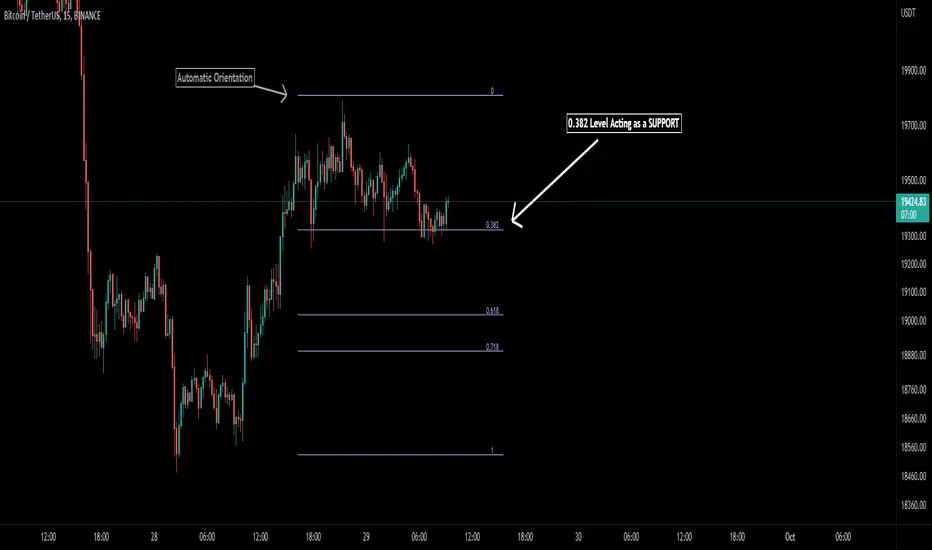
This Indicator is created to help you day trade using, ATR Fibonacci Levels, Price Action and Momentum.
It displays Fibonacci Levels Based on ATR to indicate when a security is 0.236, 0.382 +- the Days Open, +- the Days Open, 0.618 +- the Days Open and 1.0 +- Days Open.
To understand this script you need to understand
Average True Range (ATR)
1 Bar Inside Bar
2 Bar Outside Bar (Break either the top or bottom)
3 Bar Engulfing Bar
Strat Setups - 212, 322, 312
Fibonacci - 0.236, 0.382, 0.618, 1.0
Moving Averages
A Trend is considered bullish when (green)
Current Price is greater than the Fast EMA Value (8)
Fast EMA is greater than PIVOT EMA Value (21)
Pivot EMA is greater than SLOW EMA Value (34)
OR Hull is trending up and the Price is above the Volume Weighted Moving Average and price is above VWAP
A trend is considered Bearish when (red)
Current Price is less than the Fast EMA Value (8)
Fast EMA is less than PIVOT EMA Value (21)
Pivot EMA is less than SLOW EMA Value (34)
OR Hull is trending down and the Price is below the Volume Weighted Moving Average and price is below VWAP
If these conditions are not met then the Momentum is in Conflict (orange)
The Momentum band will match the color of the current trend
The table that is present can be turned off at any time lets you see
1) If Moving Averages are showing bullish, bearish or in conflict
2) If There us Time Frame Continuity, (if 5 min up, are all the other timeframes up also)
3) How much of the ATR have we moved on the day
4) Are we in Call or Put range for the day based on ATR Fib Levels
The Ideal situation for entering a call
1) Momentum is Green
2) FTFC on Green
3) A Strat Actionable Signal is present
4) You are in the call range, 0.236 - 0.618 ATR + the Price
5) The ATR still has room, I.e only 50% of the ATR has been run already
Ideal situation from entering a put
1) Momentum is red
2) FTFC on Red
3) A Strat Actionable Signal is present
4) You are in the put range, 0.236 - 0.618 ATR - the Price
5) The ATR still has room, I.e only 50% of the ATR has been run already
Exit the trade for these reasons you entered (for profit or loss)
1) ATR has no more room
2) FTFC is now in conflict
3) Momentum has shifted
Take Profit when
1) You reach a new ATR Level 0.618, 1.0 , -0.618, -1, etc
Passive Stop Loss
1) Open Price if you are aggressive
2) Next ATR Level Down or Up
Feel free to take profit and leave runners
This script does not give signals, you should do your own research, I am not a financial advisors, I am simply applying principles of seasoned veterans to code. You make all decisions about how you buy, sell and trade. The creator of this script makes no promises and takes no responsibility for your personal trading.
To research the methods described above look up
Rob Smith : The Strat
Saty Mahajan : ATR Levels
Fibonacci
Using the HULL Moving Average
Exponential Moving Averages
VWAP
VWMA

Percent ResearchPercent Research is an indicator that will plot a color / column on the chart in case custom requirements are met.
The requirements are:
- Price : Price requirement (equal or above input).
- Change % Up : Amount the price have moved up in percent (equal or above input).
- Change % Down : Amount the price have moved down in percent (equal or below input).
- Change Interval : Amount of bars the above move happened over.
- Volume : Volume requirement (equal or above input).
- Volume Interval : Amount of bars in a row that each require the above volume.
Example: In case one wants to plot whenever price has made a 20 percent move up or down in a week with minimum 100 000 volume for each of the last 2 days one can use.
Change % Up: 20
Change % Down: -20
Change Interval: 5
Volume: 100 000
Volume Interval: 2
The indicator will plot a color on the chart whenever the requirements are met, which then can be used to look into price action for each colored time period.
The values can be customized dependent on preference, example 100% movers over a month or 20% movers over a week etc.

Munich GuppyWELCOME to the Munich Guppy!
This is a simple moving average indicator that will help you determine the trend of your chart using historical moving averages.
The indicator consists of 3 EMA's and one ALMA moving average. Using these 4 moving averages I have programmed the relationship between the moving averages to color the background of your chart.
If your background is red, this means that the alma moving average has fallen below the EMA's (EMA1 and EMA 2) as well as (EMA 1 and EMA 2) are postured in a down trending/up trending fashion
For example, the 21EMA is greater than the 55EMA, this signals that the chart has been outperforming its intermediate averages. Now if the ALMA is below both the 21ema and 55ema, in this instance, your chart background will become green.
The ALMA has color options '+CoC' and '-Coc', this simply means if the candle closes below the alma, it will turn red, if closure above it will turn green.
EMA 3 which is default set to 200, has no affect on the color of the background.
Now I hope I have thoroughly explained the simplicity of this indicator, if you have any questions leave them below or private message me for any other requests,
Good Trading!
-CheatCode1

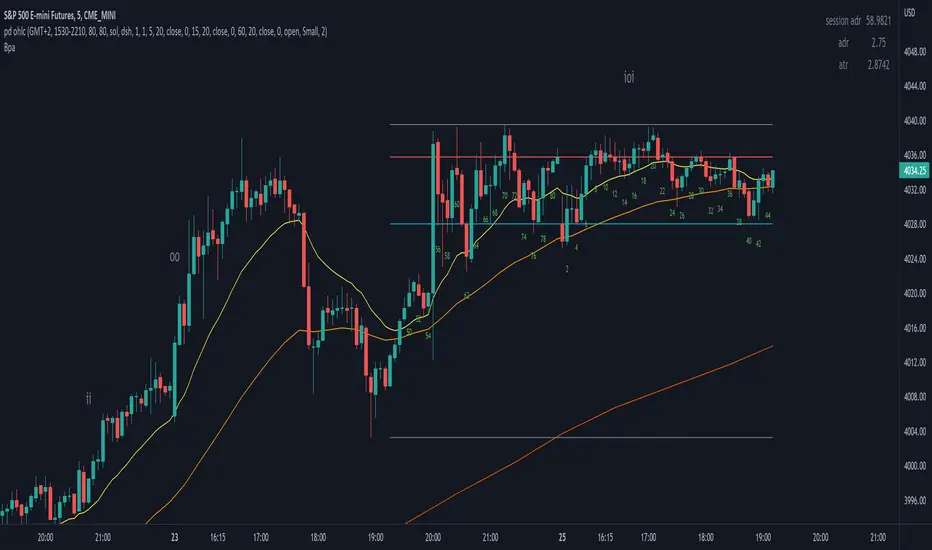
BpaLibrary "Bpa"
TODO: library of Brooks Price Action concepts
isBreakoutBar(atr, high, low, close, open, tail, size)
TODO: check if the bar is a breakout based on the specified conditions
Parameters:
atr : TODO: atr value
high : TODO: high price
low : TODO: low price
close : TODO: close price
open : TODO: open price
tail : TODO: decimal value for a percent that represent the size of the tail of the bar that cant be preceeded to be considered strong close
size : TODO: decimal value for a percent that represents by how much the breakout bar should be bigger than others to be considered one
Returns: TODO: boolean value, true if breakout bar, false otherwise
Smart Money Concepts (SMC) [LuxAlgo]This all-in-one indicator displays real-time market structure (internal & swing BOS / CHoCH), order blocks, premium & discount zones, equal highs & lows, and much more...allowing traders to automatically mark up their charts with widely used price action methodologies. Following the release of our Fair Value Gap script, we received numerous requests from our community to release more features in the same category.
"Smart Money Concepts" (SMC) is a fairly new yet widely used term amongst price action traders looking to more accurately navigate liquidity & find more optimal points of interest in the market. Trying to determine where institutional market participants have orders placed (buy or sell side liquidity) can be a very reasonable approach to finding more practical entries & exits based on price action.
The indicator includes alerts for the presence of swing structures and many other relevant conditions.
Features
This indicator includes many features relevant to SMC, these are highlighted below:
Full internal & swing market structure labeling in real-time
Break of Structure (BOS)
Change of Character (CHoCH)
Order Blocks (bullish & bearish)
Equal Highs & Lows
Fair Value Gap Detection
Previous Highs & Lows
Premium & Discount Zones as a range
Options to style the indicator to more easily display these concepts
Settings
Mode: Allows the user to select Historical (default) or Present, which displays only recent data on the chart.
Style: Allows the user to select different styling for the entire indicator between Colored (default) and Monochrome.
Color Candles: Plots candles based on the internal & swing structures from within the indicator on the chart.
Internal Structure: Displays the internal structure labels & dashed lines to represent them. (BOS & CHoCH).
Confluence Filter: Filter non-significant internal structure breakouts.
Swing Structure: Displays the swing structure labels & solid lines on the chart (larger BOS & CHoCH labels).
Swing Points: Displays swing points labels on chart such as HH, HL, LH, LL.
Internal Order Blocks: Enables Internal Order Blocks & allows the user to select how many most recent Internal Order Blocks appear on the chart.
Swing Order Blocks: Enables Swing Order Blocks & allows the user to select how many most recent Swing Order Blocks appear on the chart.
Equal Highs & Lows: Displays EQH/EQL labels on chart for detecting equal highs & lows.
Bars Confirmation: Allows the user to select how many bars are needed to confirm an EQH/EQL symbol on chart.
Fair Value Gaps: Displays boxes to highlight imbalance areas on the chart.
Auto Threshold: Filter out non-significant fair value gaps.
Timeframe: Allows the user to select the timeframe for the Fair Value Gap detection.
Extend FVG: Allows the user to choose how many bars to extend the Fair Value Gap boxes on the chart.
Highs & Lows MTF: Allows the user to display previous highs & lows from daily, weekly, & monthly timeframes as significant levels.
Premium/Discount Zones: Allows the user to display Premium, Discount, and Equilibrium zones on the chart
Usage
Users can see automatic CHoCH and BOS labels to highlight breakouts of market structure, which allows to determine the market trend. In the chart below we can see the internal structure which displays more frequent labels within larger structures. We can also see equal highs & lows (EQH/EQL) labels plotted alongside the internal structure to frequently give indications of potential reversals.
In the chart below we can see the swing market structure labels. These are also labeled as BOS and CHoCH but with a solid line & larger text to show larger market structure breakouts & trend reversals. Users can be mindful of these larger structure labels while trading internal structures as displayed in the previous chart.
Order blocks highlight areas where institutional market participants open positions, one can use order blocks to determine confirmation entries or potential targets as we can expect there is a large amount of liquidity at these order blocks. In the chart below we can see 2 potential trade setups with confirmation entries. The path outlined in red would be a potential short entry targeting the blue order block below, and the path outlined in green would be a potential long entry, targeting the red order blocks above.
As we can see in the chart below, the bullish confirmation entry played out in this scenario with the green path outlined in hindsight. As price breaks though the order blocks above, the indicator will consider them mitigated causing them to disappear, and as per the logic of these order blocks they will always display 5 (by default) on the chart so we can now see more actionable levels.
The Smart Money Concepts indicator has many other features and here we can see how they can also help a user find potential levels for price action trading. In the screenshot below we can see a trade setup using the Previous Monthly High, Strong High, and a Swing Order Block as a stop loss. Accompanied by the Premium from the Discount/Premium zones feature being used as a potential entry. A potential take profit level for this trade setup that a user could easily identify would be the 50% mark labeled with the Fair Value Gap & the Equilibrium all displayed automatically by the indicator.
Conclusion
This indicator highlights all relevant components of Smart Money Concepts which can be a very useful interpretation of market structure, liquidity, & more simply put, price action. The term was coined & popularized primarily within the forex community & by ICT while making its way to become a part of many traders' analysis. These concepts, with or without this indicator do not guarantee a trader to be trading within the presence of institutional or "bank-level" liquidity, there is no supporting data regarding the validity of these teachings.

Auto Fibonacci [Misu]█ This indicator shows an automatic Fibonacci retracement levels.
This indicator is designed based on highs, lows, and trend interpretation to orientate the fibonacci retracement in the good direction.
Fibonacci analysis uses a logical sequence of numbers to predict trends and price action.
█ Usages:
The Fibonacci retracement is used to identify hidden support and resistance levels that an investor can use for entry, exit, and stop placement.
Depending on your usage, you can track breakouts above and below retracement levels to provide early entry points for major breakouts and breakdowns.
█ Features:
> Choose Fib levels
> Color Fib Levels all in one
> Color Fib Levels Individually
█ Parameters:
Deviation: A parameter used to calculate pivots.
Depth: A parameter used to calculate pivots.
UI Settings: Select Fibs levels and colors.
((Bearish)) Candle Above EMASGood Morning from the UK.
Todays script is a simple vieweing of when candles close above a certain moving average - when the market is bearish conditions - candle which close above the moving average can be viewed as a bearish signal along with confluences such as price action. This script is best on the Daily and we can expect big price moves away from this area.
The below example, we have a bearish set up with a break of trendline and then a break of a base which would 1) strong area as price is unlikely to go past this area which would make this a supply zone.
This was then followed by the signal of the candle closing above the 100ema and the 50ema.
The script is likened to my one of my previous scripts which portrays the bullish ema candle closes.
I will be making a price action publish soon if that is of interest to the public.

PA Swings [TTA]Hello traders!
This script helps identify swing high levels of resistance and swing low levels of support via price action.
The indicator is designed to help identify support and resistance by measuring retracements. When the retracement has reached the threshold, the indicator identifies the high or low with a horizontal, solid line.
This line will continue until it is violated. Once it is violated it will adjust to a dashed line and continue until it is violated again (retested).
Therefore, a solid line resembles an unviolated swing level; a dashed line resembles a violated swing level that has yet to be retested.
Ideally, this script will filter some movements by identifying impulses in the market. Knowing that price is in a trending move rather than bouncing around in a range can help traders in their analysis. In range bound conditions the indicator will show small impulses, sometimes trapped by a support and/or resistance line. In trending markets there will be separation between the support and resistance lines.
Retests are also identified by the indicator.
Retests of swing highs and lows may induce precise, repeatable price moves - something a trader might find advantageous. A log is included to help identify potential price levels based on historical actions when an impulse or a retest occurs.
Consequently, this may help traders identify take-profit targets and avoid stop losses that are too close to the entry point.
The indicator has a color identity panel to help you get familiar with the colored lines, line types, and what they mean. The color panel is concealable. Additional customization options are available, such as toggling the chart labels. These labels distinguish impulses up and down, retests, and the distance price has traveled since breaking or creating a support or resistance level.
This can be toggled off. A High-Volume Swings only option is available for those that wish to filter out low volume movements (such as extended market hours).
You also have the option of hiding far away lines and can define what is “far away” for them % wise. It is defaulted to 15% which may need to be adjusted on lower timeframes.
Inactive lines can be shown or they can be removed in the settings as well. While this indicator can find some great levels of support or resistance it is important to remember that, should you find this script helpful, it is a tool in your toolbox!! (:
Hope you enjoy and thank you for checking this out!

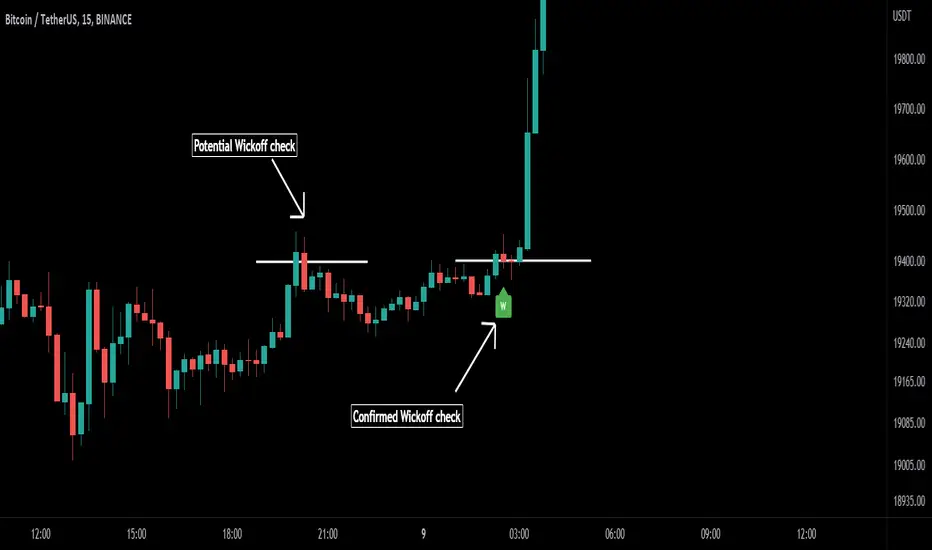
Wick-off Check Pattern [Misu]█ This Indicator shows a wick-off check pattern.
This pattern appears when a candle goes below a level (support or resistance) and closes above it OR when it goes above a level and finishes below it. This causes a wick to go through the level: a wick-off check .
This can confirm a pullback or a breakout.
█ Usages:
This indicator can be used to validate a resistance or support level.
It can also be used to validate breaking levels.
█ Parameters:
Deviation: Parameter used to calculate pivots.
Depth: Parameter used to calculate pivots.
Wickoff Mode: Mode used to detect Wickoff check pattern.
> counter pattern: only shows "pullback" wickoff check.
> breakout pattern: only shows "breakout moves" wickoff check.
> both: shows both.
Lenght Avg Body: Lenght used to calculate the average body size.
First Breakout Factor:
Lenght Avg Wick Validation: This factor multiplied by the "body avg" filters out the non-significant breakout.
Factor Avg Wick Validation: Lenght used to calculate the average wick size.
Max Bars Wickoff: This factor multiplied by the "wick avg", filters out the non-significant wickoff signals.
SBS AlgoHello traders, I am here again with a new and improved indicator.
This indicator is based on a pivot breakout algorithm which gives buy and sell signals according to the breakout of trendline. This is an advanced version of another script. It also takes price action into consideration along with some basic indicators like MACD and ADX to give good entry signals.
NOTE: This indicator is not designed to take entries completely based on signals it gives. Please use it along with your trading strategy to add more confluence to your trading system and maximize your profits.
I hope you guys will like this one too .Enjoy 👍
In case you find any bug, please do report in comment section .Thank you.

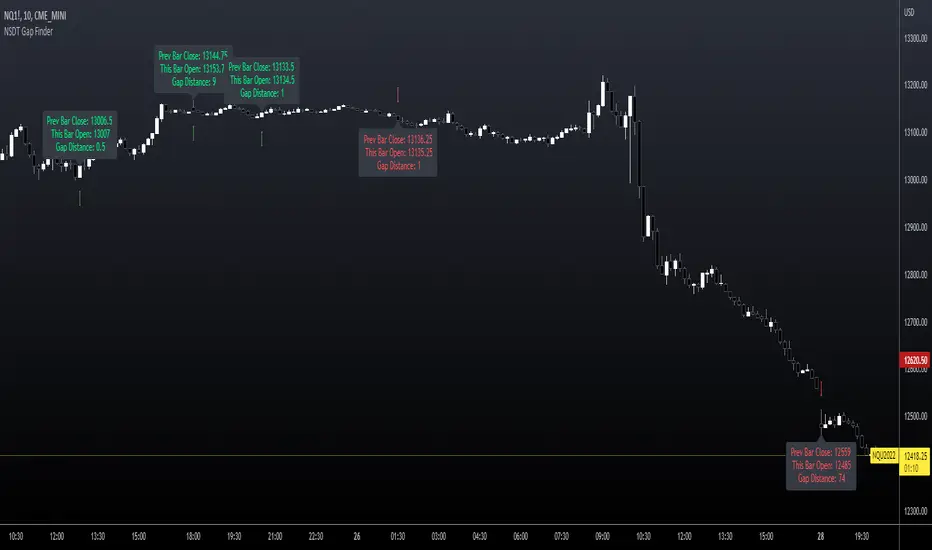
NSDT Gap FinderThis script plots gaps between candles.
It uses the "round_to_mintick" feature in the Pinescript code, so it works on any instrument out to 3 decimal places.
If there is a Gap Up (open of current candle is greater than the close of previous candle) it will plot a green arrow under the current candle and plot a label above the current candle to show the Gap Amount.
If there is a Gap Down (open of current candle is less than the close of previous candle) it will plot a red arrow over the current candle and plot a label below the current candle to show the Gap Amount.
You can turn the label and/or the arrow on and off.
I created this indicator to more easily identify gaps in the market. The probability of a gap being filled is extremely high. Some are right away (intraday candle to candle), some take a while (gap from previous day close to current day open), and some make take a long time (close at end of previous week to open at beginning of current week).
This is published free to use and open source code.
Please see my other similar Gap Indicators.
Daily Gap Range
USA Session - Previous Day Close Gap to Current Day Open
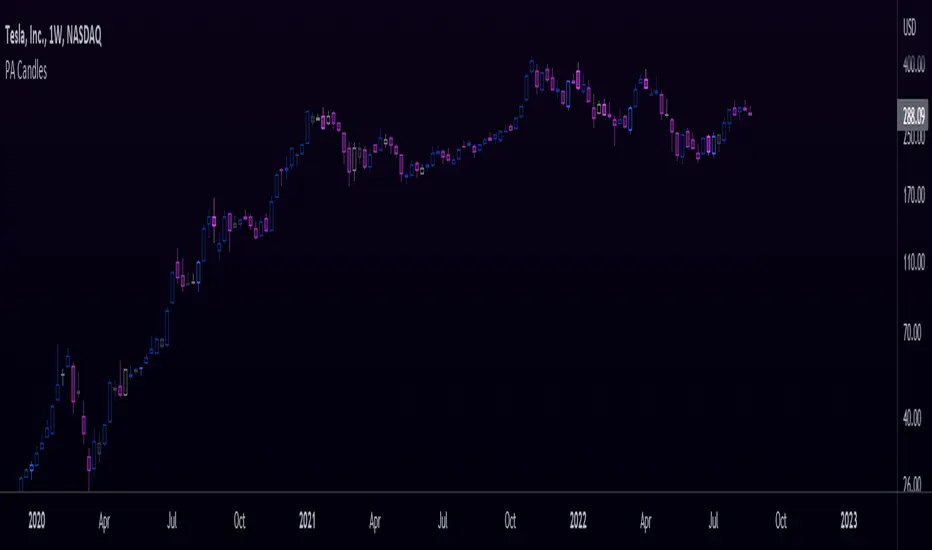
Price Action CandlesThis simple script provides a visual aid for price action traders by coloring outside & inside candles, which in effect leaves the trader with 6 possible candle colors:
-Regular bullish candle
-Outside bullish candle
-Inside bullish candle
-Regular bearish candle
-Outside bearish candle
-Inside bearish candle
These candlesticks may provide powerful signals when used in conjunction with key levels, market structure and chart patterns.
Make sure to disable the regular candlesticks (body, borders and wicks) in the symbol tab inside the configuration menu!
Hope it can help someone!
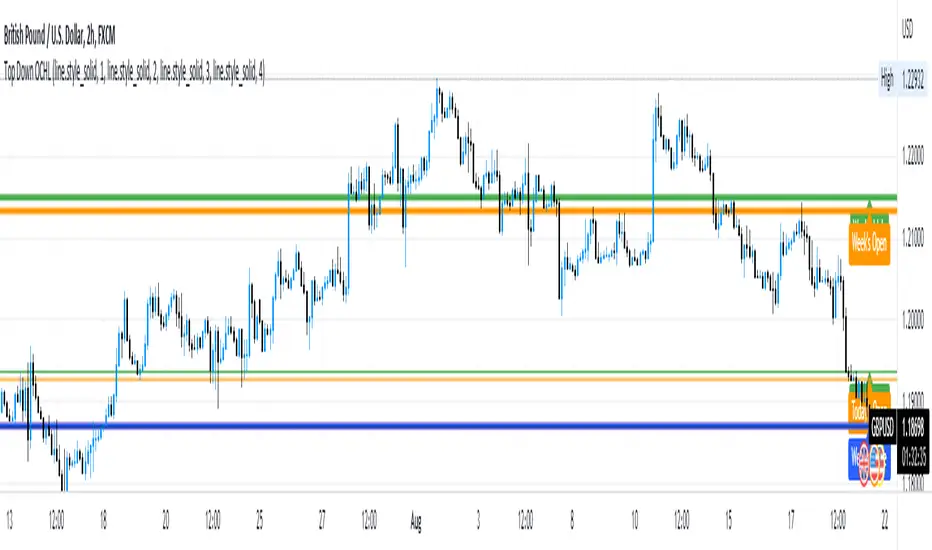
Opens, Closes, Highs and Lows.Hello Traders, the script below is designed to display the monthly, weekly, previous days' and current days' open, close, high and low.
I designed it to assist in top down analysis by knowing the monthly and weekly opens and closes it makes it a lot easier to make trading decisions on the lower timeframes.
As the user you can choose which price values you'd like displayed on the chart by selecting them in the user inputs.
Enjoy!!
Inside Bar SetupScript Details
- This script plots Inside Bar for given day in selected time-frame (applicable only for Timeframes < Day)
- Basis plotted inside bar, relevant targets are marked on the chart
- Targets can be customised from script settings. Example, if range of mother candle is 10 points, then T1 is 10 * x above/below mother candle and T2 is 10 * y above/below mother candle. This x & y are configured via script settings
How to use this script ?
- This script works well on 10-15 mins timeframe for stocks, 15/30 mins timeframe for nifty index and 30/60 mins time frame for bank nifty index
- If mother candle high is broken, take long trade with SL of mother candle low and if low is broken, take short trade with SL of mother candle high
Remember:
1. Above logic is to be combined with support/resistances i.e. price action. This script is an add-on to price action analysis giving you more conviction.
2. If range of mother candle is very high, it is recommended to avoid the trade.
3. Basis inside bar formed on higher time frame, take trade on basis of lower time frame i.e if inside bar is formed on 60 mins, take trade on the basis of 10-15 mins time frame
Example:
1. As seen in the chart, Nifty is near it's resistance and we are seeing Inside Bar being formed, In such scenario, even if High of Mother Candle is broken, we should be more interested to short as we are near resistance and probability of getting our targets in long side is less.
2. So, if I see breakdown of mother candle i.e. price going below low of mother candle, we will short with SL of high of mother candle.
3. As seen in the chart, both the targets are achieved.
Additional Info:
1. Targets on Long/Short Side can be configured via settings. For indices 1 times/1.5 times the range works well.
2. This script plots targets basis the first inside bar formed in the day for selected time frame.
3. Inside bars formed through out the day are coloured separately but lines are plotted only on the basis of 1st formed inside bar as this strategy works well for the first formed inside bar)
4. Don't forget to check volume in case of breakout/breakdown.
Note:
1. Mother Candle - First Candle of Inside Bar
2. Child Candle - Candle formed inside Mother Candle (Second Candle of Inside Bar)
Happy Trading :)

Fibonacci + Support/Resistant + Trendline (Price action)This is opening source code version: Fibonacci + Support/Resistant + Trendline (One of Advanced Price action Analysis).
How it works:
It find entry Long/Short by combining: Fibonacci + Support/Resistant + Trendline
1. Find Impulse wave:
To findind Impulse wave, It uses Pivot High/Low to find Impulse wave. In case find entry Long, If having Pivot High higher Pivot High before, it will draw an Impulse wave.
2. Find entry at Fibonacci levels:
Draw Fibonacci fibonacci retracement from Pivot Low to Pivot High. A Fibonacci retracement forecast is created by taking two extreme points on a chart and dividing the vertical distance by important Fibonacci ratios. 0% is considered to be the start of the retracement, while 100% is a complete reversal to the original price before the move. Horizontal lines are drawn in the chart for these price levels to provide support and resistance levels. Common levels are 23.6%, 38.2%, 50%, and 61.8%
3. Find entry at Support/Resistant Zone:
Support/Resistant Zone drawed from Pivot High before, which price just breaken and return to retest.
4. Find entry at Trendline:
Trendline drawed from Pivot High/Low before, which price just breaken and return to retest.
How do use it:
+ You can customize the thickness of the lines.
+ You can set up an alert when the price touchs important areas.
