Mutanabby_AI | Algo Pro Strategy# Mutanabby_AI | Algo Pro Strategy: Advanced Candlestick Pattern Trading System
## Strategy Overview
The Mutanabby_AI Algo Pro Strategy represents a systematic approach to automated trading based on advanced candlestick pattern recognition and multi-layered technical filtering. This strategy transforms traditional engulfing pattern analysis into a comprehensive trading system with sophisticated risk management and flexible position sizing capabilities.
The strategy operates on a long-only basis, entering positions when bullish engulfing patterns meet specific technical criteria and exiting when bearish engulfing patterns indicate potential trend reversals. The system incorporates multiple confirmation layers to enhance signal reliability while providing comprehensive customization options for different trading approaches and risk management preferences.
## Core Algorithm Architecture
The strategy foundation relies on bullish and bearish engulfing candlestick pattern recognition enhanced through technical analysis filtering mechanisms. Entry signals require simultaneous satisfaction of four distinct criteria: confirmed bullish engulfing pattern formation, candle stability analysis indicating decisive price action, RSI momentum confirmation below specified thresholds, and price decline verification over adjustable lookback periods.
The candle stability index measures the ratio between candlestick body size and total range including wicks, ensuring only well-formed patterns with clear directional conviction generate trading signals. This filtering mechanism eliminates indecisive market conditions where pattern reliability diminishes significantly.
RSI integration provides momentum confirmation by requiring oversold conditions before entry signal generation, ensuring alignment between pattern formation and underlying momentum characteristics. The RSI threshold remains fully adjustable to accommodate different market conditions and volatility environments.
Price decline verification examines whether current prices have decreased over a specified period, confirming that bullish engulfing patterns occur after meaningful downward movement rather than during sideways consolidation phases. This requirement enhances the probability of successful reversal pattern completion.
## Advanced Position Management System
The strategy incorporates dual position sizing methodologies to accommodate different account sizes and risk management approaches. Percentage-based position sizing calculates trade quantities as equity percentages, enabling consistent risk exposure across varying account balances and market conditions. This approach proves particularly valuable for systematic trading approaches and portfolio management applications.
Fixed quantity sizing provides precise control over trade sizes independent of account equity fluctuations, offering predictable position management for specific trading strategies or when implementing precise risk allocation models. The system enables seamless switching between sizing methods through simple configuration adjustments.
Position quantity calculations integrate seamlessly with TradingView's strategy testing framework, ensuring accurate backtesting results and realistic performance evaluation across different market conditions and time periods. The implementation maintains consistency between historical testing and live trading applications.
## Comprehensive Risk Management Framework
The strategy features dual stop loss methodologies addressing different risk management philosophies and market analysis approaches. Entry price-based stop losses calculate stop levels as fixed percentages below entry prices, providing predictable risk exposure and consistent risk-reward ratio maintenance across all trades.
The percentage-based stop loss system enables precise risk control by limiting maximum loss per trade to predetermined levels regardless of market volatility or entry timing. This approach proves essential for systematic trading strategies requiring consistent risk parameters and capital preservation during adverse market conditions.
Lowest low-based stop losses identify recent price support levels by analyzing minimum prices over adjustable lookback periods, placing stops below these technical levels with additional buffer percentages. This methodology aligns stop placement with market structure rather than arbitrary percentage calculations, potentially improving stop loss effectiveness during normal market fluctuations.
The lookback period adjustment enables optimization for different timeframes and market characteristics, with shorter periods providing tighter stops for active trading and longer periods offering broader stops suitable for position trading approaches. Buffer percentage additions ensure stops remain below obvious support levels where other market participants might place similar orders.
## Visual Customization and Interface Design
The strategy provides comprehensive visual customization through eight predefined color schemes designed for different chart backgrounds and personal preferences. Color scheme options include Classic bright green and red combinations, Ocean themes featuring blue and orange contrasts, Sunset combinations using gold and crimson, and Neon schemes providing high visibility through bright color selections.
Professional color schemes such as Forest, Royal, and Fire themes offer sophisticated alternatives suitable for business presentations and professional trading environments. The Custom color scheme enables precise color selection through individual color picker controls, maintaining maximum flexibility for specific visual requirements.
Label styling options accommodate different chart analysis preferences through text bubble, triangle, and arrow display formats. Size adjustments range from tiny through huge settings, ensuring appropriate visual scaling across different screen resolutions and chart configurations. Text color customization maintains readability across various chart themes and background selections.
## Signal Quality Enhancement Features
The strategy incorporates signal filtering mechanisms designed to eliminate repetitive signal generation during choppy market conditions. The disable repeating signals option prevents consecutive identical signals until opposing conditions occur, reducing overtrading during consolidation phases and improving overall signal quality.
Signal confirmation requirements ensure all technical criteria align before trade execution, reducing false signal occurrence while maintaining reasonable trading frequency for active strategies. The multi-layered approach balances signal quality against opportunity frequency through adjustable parameter optimization.
Entry and exit visualization provides clear trade identification through customizable labels positioned at relevant price levels. Stop loss visualization displays active risk levels through colored line plots, ensuring complete transparency regarding current risk management parameters during live trading operations.
## Implementation Guidelines and Optimization
The strategy performs effectively across multiple timeframes with optimal results typically occurring on intermediate timeframes ranging from fifteen minutes through four hours. Higher timeframes provide more reliable pattern formation and reduced false signal occurrence, while lower timeframes increase trading frequency at the expense of some signal reliability.
Parameter optimization should focus on RSI threshold adjustments based on market volatility characteristics and candlestick pattern timeframe analysis. Higher RSI thresholds generate fewer but potentially higher quality signals, while lower thresholds increase signal frequency with corresponding reliability considerations.
Stop loss method selection depends on trading style preferences and market analysis philosophy. Entry price-based stops suit systematic approaches requiring consistent risk parameters, while lowest low-based stops align with technical analysis methodologies emphasizing market structure recognition.
## Performance Considerations and Risk Disclosure
The strategy operates exclusively on long positions, making it unsuitable for bear market conditions or extended downtrend periods. Users should consider market environment analysis and broader trend assessment before implementing the strategy during adverse market conditions.
Candlestick pattern reliability varies significantly across different market conditions, with higher reliability typically occurring during trending markets compared to ranging or volatile conditions. Strategy performance may deteriorate during periods of reduced pattern effectiveness or increased market noise.
Risk management through stop loss implementation remains essential for capital preservation during adverse market movements. The strategy does not guarantee profitable outcomes and requires proper position sizing and risk management to prevent significant capital loss during unfavorable trading periods.
## Technical Specifications
The strategy utilizes standard TradingView Pine Script functions ensuring compatibility across all supported instruments and timeframes. Default configuration employs 14-period RSI calculations, adjustable candle stability thresholds, and customizable price decline verification periods optimized for general market conditions.
Initial capital settings default to $10,000 with percentage-based equity allocation, though users can adjust these parameters based on account size and risk tolerance requirements. The strategy maintains detailed trade logs and performance metrics through TradingView's integrated backtesting framework.
Alert integration enables real-time notification of entry and exit signals, stop loss executions, and other significant trading events. The comprehensive alert system supports automated trading applications and manual trade management approaches through detailed signal information provision.
## Conclusion
The Mutanabby_AI Algo Pro Strategy provides a systematic framework for candlestick pattern trading with comprehensive risk management and position sizing flexibility. The strategy's strength lies in its multi-layered confirmation approach and sophisticated customization options, enabling adaptation to various trading styles and market conditions.
Successful implementation requires understanding of candlestick pattern analysis principles and appropriate parameter optimization for specific market characteristics. The strategy serves traders seeking automated execution of proven technical analysis techniques while maintaining comprehensive control over risk management and position sizing methodologies.
Relative Strength Index (RSI)

Market Regime Matrix [Alpha Extract]A sophisticated market regime classification system that combines multiple technical analysis components into an intelligent scoring framework to identify and track dominant market conditions. Utilizing advanced ADX-based trend detection, EMA directional analysis, volatility assessment, and crash protection protocols, the Market Regime Matrix delivers institutional-grade regime classification with BULL, BEAR, and CHOP states. The system features intelligent scoring with smoothing algorithms, duration filters for stability, and structure-based conviction adjustments to provide traders with clear, actionable market context.
🔶 Multi-Component Regime Engine Integrates five core analytical components: ADX trend strength detection, EMA-200 directional bias, ROC momentum analysis, Bollinger Band volatility measurement, and zig-zag structure verification. Each component contributes to a sophisticated scoring system that evaluates market conditions across multiple dimensions, ensuring comprehensive regime assessment with institutional precision.
// Gate Keeper: ADX determines market type
is_trending = adx_value > adx_trend_threshold
is_ranging = adx_value <= adx_trend_threshold
is_maximum_chop = adx_value <= adx_chop_threshold
// BULL CONDITIONS with Structure Veto
if price_above_ema and di_bullish
if use_structure_filter and isBullStructure
raw_bullScore := 5.0 // MAXIMUM CONVICTION: Strong signals + Bull structure
else if use_structure_filter and not isBullStructure
raw_bullScore := 3.0 // REDUCED: Strong signals but broken structure
🔶 Intelligent Scoring System Employs a dynamic 0-5 scale scoring mechanism for each regime type (BULL/BEAR/CHOP) with adaptive conviction levels. The system automatically adjusts scores based on signal alignment, market structure confirmation, and volatility conditions. Features decision margin requirements to prevent false regime changes and includes maximum conviction thresholds for high-probability setups.
🔶 Advanced Structure Filter Implements zig-zag based market structure analysis using configurable deviation thresholds to identify significant pivot points. The system tracks Higher Highs/Higher Lows (HH/HL) for bullish structure and Lower Lows/Lower Highs (LL/LH) for bearish structure, applying structure veto logic that reduces conviction when price action contradicts the underlying trend framework.
// Define Market Structure (Bull = HH/HL, Bear = LL/LH)
isBullStructure = not na(last_significant_high) and not na(prev_significant_high) and
not na(last_significant_low) and not na(prev_significant_low) and
last_significant_high > prev_significant_high and last_significant_low > prev_significant_low
isBearStructure = not na(last_significant_high) and not na(prev_significant_high) and
not na(last_significant_low) and not na(prev_significant_low) and
last_significant_low < prev_significant_low and last_significant_high < prev_significant_high
🔶 Superior Engine Components Features dual-layer regime stabilization through score smoothing and duration filtering. The score smoothing component reduces noise by averaging raw scores over configurable periods, while the duration filter requires minimum regime persistence before confirming changes. This eliminates whipsaws and ensures regime transitions represent genuine market shifts rather than temporary fluctuations.
🔶 Crash Detection & Active Penalties Incorporates sophisticated crash detection using Rate of Change (ROC) analysis with severity classification. When crash conditions are detected, the system applies active penalties (-5.0) to BULL and CHOP scores while boosting BEAR conviction based on crash severity. This ensures immediate regime response to major market dislocations and drawdown events.
// === CRASH OVERRIDE (Active Penalties) ===
is_crash = roc_value < crash_threshold
if is_crash
// Calculate crash severity
crash_severity = math.abs(roc_value / crash_threshold)
crash_bonus = 4.0 + (crash_severity - 1.0) * 2.0
// ACTIVE PENALTIES: Force bear dominance
raw_bearScore := math.max(raw_bearScore, crash_bonus)
raw_bullScore := -5.0 // ACTIVE PENALTY
raw_chopScore := -5.0 // ACTIVE PENALTY
❓How It Works
🔶 ADX-Based Market Classification The Market Regime Matrix uses ADX (Average Directional Index) as the primary gatekeeper to distinguish between trending and ranging market conditions. When ADX exceeds the trend threshold, the system activates BULL/BEAR regime logic using DI+/DI- crossovers and EMA positioning. When ADX falls below the ranging threshold, CHOP regime logic takes precedence, with maximum conviction assigned during ultra-low ADX periods.
🔶 Dynamic Conviction Scaling Each regime receives conviction ratings from UNCERTAIN to MAXIMUM based on signal alignment and score magnitude. MAXIMUM conviction (5.0 score) requires perfect signal alignment plus favorable market structure. The system progressively reduces conviction when signals conflict or structure breaks, ensuring traders understand the reliability of each regime classification.
🔶 Regime Transition Management Implements decision margin requirements where new regimes must exceed existing regimes by configurable thresholds before transitions occur. Combined with duration filtering, this prevents premature regime changes and maintains stability during consolidation periods. The system tracks both raw regime signals and final regime output for complete transparency.
🔶 Visual Regime Mapping Provides comprehensive visual feedback through colored candle overlays, background regime highlighting, and real-time information tables. The system displays regime history, conviction levels, structure status, and key metrics in an organized dashboard format. Regime changes trigger immediate visual alerts with detailed transition information.
🔶 Performance Optimization Features efficient array management for zig-zag calculations, smart variable updating to prevent recomputation, and configurable debug modes for strategy development. The system maintains optimal performance across all timeframes while providing institutional-grade analytical depth.
Why Choose Market Regime Matrix ?
The Market Regime Matrix represents the evolution of market regime analysis, combining traditional technical indicators with modern algorithmic decision-making frameworks. By integrating multiple analytical dimensions with intelligent scoring, structure verification, and crash protection, it provides traders with institutional-quality market context that adapts to changing conditions. The sophisticated filtering system eliminates noise while preserving responsiveness, making it an essential tool for traders seeking to align their strategies with dominant market regimes and avoid adverse market environments.

Clean Multi-Indicator Alignment System
Overview
A sophisticated multi-indicator alignment system designed for 24/7 trading across all markets, with pure signal-based exits and no time restrictions. Perfect for futures, forex, and crypto markets that operate around the clock.
Key Features
🎯 Multi-Indicator Confluence System
EMA Cross Strategy: Fast EMA (5) and Slow EMA (10) for precise trend direction
VWAP Integration: Institution-level price positioning analysis
RSI Momentum: 7-period RSI for momentum confirmation and reversal detection
MACD Signals: Optimized 8/17/5 configuration for scalping responsiveness
Volume Confirmation: Customizable volume multiplier (default 1.6x) for signal validation
🚀 Advanced Entry Logic
Initial Full Alignment: Requires all 5 indicators + volume confirmation
Smart Continuation Entries: EMA9 pullback entries when trend momentum remains intact
Flexible Time Controls: Optional session filtering or 24/7 operation
🎪 Pure Signal-Based Exits
No Forced Closes: Positions exit only on technical signal reversals
Dual Exit Conditions: EMA9 breakdown + RSI flip OR MACD cross + EMA20 breakdown
Trend Following: Allows profitable trends to run their full course
Perfect for Swing Scalping: Ideal for multi-session position holding
📊 Visual Interface
Real-Time Status Dashboard: Live alignment monitoring for all indicators
Color-Coded Candles: Instant visual confirmation of entry/exit signals
Clean Chart Display: Toggle-able EMAs and VWAP with professional styling
Signal Differentiation: Clear labels for entries, X-crosses for exits
🔔 Alert System
Entry Notifications: Separate alerts for buy/sell signals
Exit Warnings: Technical breakdown alerts for position management
Mobile Ready: Push notifications to TradingView mobile app
Market Applications
Perfect For:
Gold Futures (GC): 24-hour precious metals trading
NASDAQ Futures (NQ): High-volatility index scalping
Forex Markets: Currency pairs with continuous operation
Crypto Trading: 24/7 cryptocurrency momentum plays
Energy Futures: Oil, gas, and commodity swing trades
Optimal Timeframes:
1-5 Minutes: Ultra-fast scalping during high volatility
5-15 Minutes: Balanced approach for most markets
15-30 Minutes: Swing scalping for trend following
🧠 Smart Position Management
Tracks implied position direction
Prevents conflicting signals
Allows trend continuation entries
State-aware exit logic
⚡ Scalping Optimized
Fast-reacting indicators with shorter periods
Volume-based confirmation reduces false signals
Clean entry/exit visualization
Minimal lag for time-sensitive trades
Configuration Options
All parameters fully customizable:
EMA Lengths: Adjustable from 1-30 periods
RSI Period: 1-14 range for different market conditions
MACD Settings: Fast (1-15), Slow (1-30), Signal (1-10)
Volume Confirmation: 0.5-5.0x multiplier range
Visual Preferences: Colors, displays, and table options
Risk Management Features
Clear visual exit signals prevent emotion-based decisions
Volume confirmation reduces false breakouts
Multi-indicator confluence improves signal quality
Optional time filtering for session-specific strategies
Best Use Cases
Futures Scalping: NQ, ES, GC during active sessions
Forex Swing Trading: Major pairs during overlap periods
Crypto Momentum: Bitcoin, Ethereum trend following
24/7 Automated Systems: Algorithmic trading implementation
Multi-Market Scanning: Portfolio-wide signal monitoring

B-Xtrender MTF Companion (custom colors + zero)B-Xtrender MTF Companion (Custom Colors + Zero)
This indicator is a multi-timeframe companion tool for the B-Xtrender system, designed to track momentum shifts across your current chart timeframe and up to two higher timeframes — all in one panel.
Key Features:
Multi-Timeframe Momentum: Plots histogram + signal line for current TF, HTF-1, and HTF-2, with independent color/offset settings for easy visual stacking.
Custom Styling: Full color and width control for bullish/bearish histograms, signal lines, and the zero line.
Smoothing Options: Choose between EMA or T3 smoothing for cleaner signals.
Momentum Flip Alerts: Built-in alert conditions for bullish or bearish flips on each timeframe.
Zero Line Control: Toggle, recolor, and restyle the zero reference line.
How It Works:
The B-Xtrender MTF Companion calculates the difference between two EMAs, applies RSI normalization, and then plots it as a centered oscillator. The signal line slope and histogram color indicate momentum direction, while higher-timeframe signals help confirm trend strength and avoid false entries.
Best Use:
Pair with price action or your primary B-Xtrender setup for trend confirmation.
Monitor higher timeframe momentum while trading intraday.
Combine alert flips with your entry rules for more timely trade triggers.

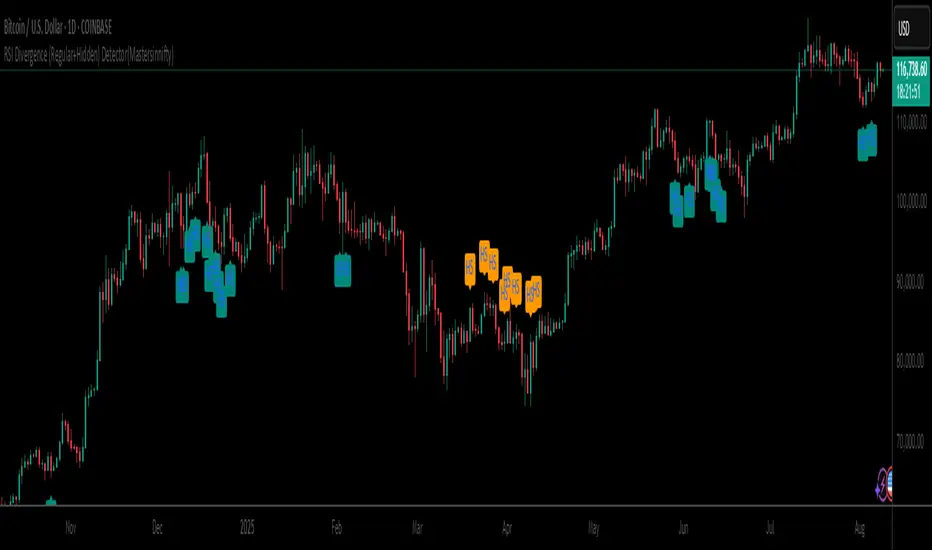
RSI Divergence (Regular+Hidden) Detector(Mastersinnifty)Description
The RSI Divergence (Regular + Hidden) Detector identifies both regular and hidden divergences between price and the Relative Strength Index (RSI). It automatically marks divergence points on the chart using short-form labels for quick recognition:
RB – Regular Bullish Divergence
RS – Regular Bearish Divergence
HB – Hidden Bullish Divergence
HS – Hidden Bearish Divergence
This tool helps traders spot potential reversals or trend continuation setups with clear, on-chart visual signals.
How It Works
Calculates RSI based on user-selected source and length.
Scans a specified lookback range for matching high/low points in price and RSI.
Validates divergences based on minimum RSI difference and minimum price percentage difference.
Marks detected divergences with short-form labels directly on the price chart.
Allows toggling between regular and hidden divergence detection.
Inputs
RSI Length – Period for RSI calculation.
Lookback Bars – Number of bars to scan for divergence.
Minimum RSI Difference – Minimum required RSI value change between points.
Minimum Price Difference (%) – Minimum required price percentage change between points.
Overbought / Oversold Levels – RSI thresholds for signal validation.
Show Regular Divergences – Enable/disable regular divergence detection.
Show Hidden Divergences – Enable/disable hidden divergence detection.
Use Case
Identify potential reversal points using regular divergences.
Spot possible trend continuation opportunities with hidden divergences.
Enhance entry/exit timing by combining divergence signals with other technical tools.
Apply in any market and timeframe, from scalping to swing trading.
Disclaimer
This indicator is for educational and research purposes only. It does not guarantee future performance. Always combine signals with your own analysis and risk management strategy before making trading decisions.
RSI + MACD Long-Only StrategyRSI + MACD Long-Only Strategy
Overview: Momentum-based, long-only strategy combining RSI and MACD. Entries favor upside momentum; exits trigger on momentum fades or risk targets. Signals are state-gated so you get one exit per entry (no multiple exits without a prior entry).
Entry conditions:
RSI crosses above the midline (default 50) while MACD is bullish (MACD > Signal, optionally MACD > 0), OR
MACD crosses above its Signal while RSI is at/above the midline.
Optional filters:
EMA trend filter: only enter if price > EMA(n).
Oversold context: only enter within N bars after RSI dipped below the oversold threshold.
Exit conditions:
RSI crosses below the midline, OR
MACD crosses below its Signal with MACD histogram ≤ 0.
Optional risk exit: Take Profit / Stop Loss based on percentage from average entry price.
Risk management:
Inputs: Use TP/SL (on/off), TP% (default 3.0), SL% (default 1.5).
Implements protective strategy.exit (limit/stop) while in position.
Signal-based exit uses strategy.close to flatten.
Position management:
Long-only, no pyramiding (single position at a time).
Internal state ensures entries occur only when flat and exits only when in a position.
Inputs you can tune:
RSI: length, overbought, oversold, midline.
MACD: fast length, slow length, signal length; toggle “Require MACD > 0”.
Signals: oversold lookback window; EMA trend on/off and EMA length.
Risk: TP% and SL%.
Visuals: show entry/exit markers, bar coloring; optional debug background on raw triggers.
Visuals and alerts:
Plots EMA (optional), draws entry/exit markers, optional bar coloring, and a faint background on raw long triggers to aid tuning.
Alert conditions provided for entries and exits.
Notes:
Designed for bar-close evaluation; performance varies by symbol/timeframe—tune inputs accordingly.
Long-only; intended for trend-following momentum with basic risk control.
Not financial advice.

EMA Crossover Buy/Sell Signals (Mark804)FX:EURUSD
Indicator Overview — Buy/Sell Signal Arrows
The Buy/Sell Signal Arrows indicator visually enhances trading charts by clearly marking entry and exit opportunities via dynamic arrow overlays. Utilizing robust technical analysis techniques, this tool aims to streamline decision-making by highlighting potential buy signals and sell signals in real-time.
Key Features
Intuitive Visual Cues: Displays green arrows below the chart to denote buy signals and red arrows above for sell signals, ensuring rapid recognition.
Multiple Signal Algorithms: Supports various proven methods such as:
Moving Average Crossovers (e.g., short-term vs. long-term EMAs) — upward cross indicates buy; downward cross indicates sell
Relative Strength Index (RSI) thresholds — buy when oversold (RSI < 30), sell when overbought (RSI > 70)
MACD Signal Line Crossovers — buy when MACD crosses above its signal line, sell when it crosses below
Flexible Configuration: Customize periods, thresholds, and signal types, adapting the indicator to different assets and trading styles.
Benefits
Enhances Clarity: Simplifies complex data into actionable visual signals.
Signal Confirmation: Reduces ambiguity by combining momentum, trend, and volatility indicators.
Adaptable for Different Market Conditions: Effective in both trending and ranging environments by selecting appropriate algorithms.
Usage Guidelines & Best Practices
Combine with Complementary Tools: For improved accuracy, pair with support/resistance, volume analysis, or chart patterns
Conduct Thorough Back testing: Evaluate historical performance by measuring win rates, risk-to-reward ratios, and drawdowns
Hedge Fund Signals
.
Use as Part of a Broader Strategy: Indicators offer signals, not guarantees. Affirm trades with broader analysis and implement sound risk management (e.g., stop-loss, position sizing

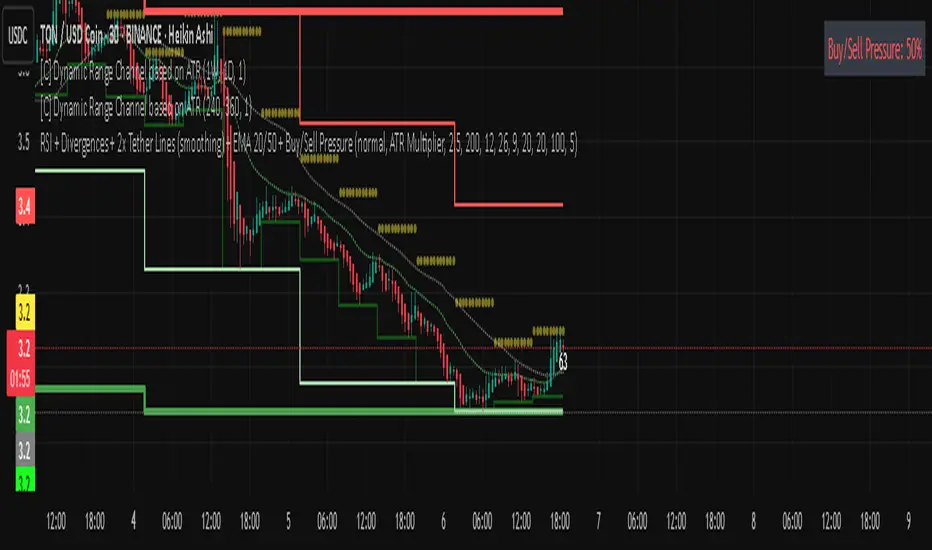
Rsi bar, divergences, tether line, ema 20,50 -Ema 20,50
-Tether Line dominance
-Buy/sell pressure
-Rsi last candle
-byu sell signal
-rsi divergence
-macd divergence
-Coloured candles 25,30 rsi and 70 rsi
TDPO-RSI (Time-Decaying Percentile RSI)TDPO-RSI (Time-Decaying Percentile RSI)
TDPO-RSI is a modern, statistically-enhanced momentum indicator that improves on traditional RSI by using percentile-based analysis with exponential time decay. Instead of averaging gains and losses equally, this indicator ranks them by size and weights recent data more heavily—resulting in a more responsive and noise-resistant signal.
How it works:
Calculates percentile rank of gains and losses over a lookback window
Applies a decay factor (lambda) to give more weight to recent price action
Outputs a percentile-based RSI value between 0 and 100
Optional smoothing via EMA for clearer crossover signals
Key Uses:
Identify overbought/oversold zones (default: 70/30)
Use raw vs. smoothed RSI crossovers for entries
Detect momentum shifts earlier than traditional RSI
Suitable for scalping, trend continuation, and reversal setups
Inputs:
Lookback Length: Number of bars used for percentile calculation
Decay Factor (lambda): How quickly older data fades in influence (0.80–0.99)
Smoothing EMA: Smooths the final output to reduce noise
Tip: Combine with price structure and volume for best results. Higher timeframes can be used for trend context, while lower timeframes help with precise entries.
This tool is ideal for traders who want adaptive momentum analysis rooted in statistical behavior.

Multi-Indicator Trading System v2Multi-Indicator Trading System (MITS)
Purpose:
Using WVMA (Volume Weighted Moving Average) + EMA 50 + Bollinger Bands to capture trend reversal points and generate buy/sell signals.
What It Does:
WVMA line shows volume-based price momentum
EMA 50 determines main trend direction
Bollinger Bands display volatility range
BUY signal when price crosses above WVMA and is above EMA
SELL signal when price crosses below WVMA and is below EMA
In Short: Combines Volume + Trend + Volatility to find strong entry points.


CnagdaCnagda indicator fuses multiple concepts: anchored VWAP, average of key MAs, volatility stops, swing and scalp trading logic, advanced volume and RSI usage, and visually handy outputs. It’s intended to give clear, multi-layered signals and adapt to different trading styles (trend following, swing, and scalp).
Here’s the entry and exit logic of this strategy in simple
Buy Entry (SCALP):
When a special moving average crossover happens, the script waits until the price rises above a recent high — then it signals a buy.
Sell Entry (SCALP):
When the crossover happens in the other direction, the script waits until the price falls below a recent low — then it signals a sell.
Exit from Buy/Sell
when condition neutral
Swing Trades:
If both price and its low are above an important average, it suggests a buy signal.
If both price and its high are below this average, it suggests a sell signal.
RSI/Volume Special Signals:
The strategy also checks for extra conditions combining momentum (RSI) and high volume spikes for more buy/sell signals, but only when the price's location supports it.
It buys when price shows fresh strength and sells when price shows fresh weakness

Profitable Pullback Strategy Mark804📝 Strategy Description: Pullback Trading Strategy v2.0 by Mark804
Overview
This strategy is a refined, trend-following pullback system designed to identify high-probability entry points within an established trend. Based on **EMA stacking**, it captures short-term retracements (pullbacks) in the direction of the larger trend. It has been fully updated to **Pine Script v5** with dynamic inputs, clear visualization, backtesting functionality, and risk management via stop loss and take profit.
---
🔧 How It Works
1. **Trend Detection**
The strategy first identifies a trend using a combination of four EMAs:
* **Fast EMA**
* **Signal EMA**
* **Medium EMA**
* **Slow EMA** (optional filter)
A valid trend is defined by **EMA stacking**:
* **Uptrend**: Fast > Signal > Medium (> Slow, if enabled)
* **Downtrend**: Fast < Signal < Medium (< Slow, if enabled)
This ensures the strategy trades **only in the direction of the dominant trend**, avoiding countertrend setups.
---
2. **Pullback Entry Conditions**
The strategy looks for pullbacks (retracements) within the confirmed trend:
*Buy Setup (Long Pullback)**:
* In an uptrend
* Price **closes below** the Signal EMA on the previous bar
* Then **closes back above** the Signal EMA on the current bar
* **Sell Setup (Short Pullback)**:
* In a downtrend
* Price **closes above** the Signal EMA on the previous bar
* Then **closes back below** the Signal EMA on the current bar
These conditions aim to enter on price dips or rallies that offer better entries while staying aligned with trend momentum.
---
3. **Entry & Exit Logic**
When a pullback signal is detected:
* A **market order** is placed in the trend direction
* A **take profit** and **stop loss** is applied immediately based on percentage inputs
Example:
* Take Profit: 2% above entry (for long)
* Stop Loss: 1% below entry (for long)
This creates a favorable **risk-to-reward ratio** and clear exit strategy.
---
4. **Customizable Inputs**
All key parameters can be tuned via the script’s settings panel:
* `maSrc`: Source for EMAs (default: `close`)
* `fastLen`, `signalLen`, `mediumLen`, `slLen`: EMA lengths
* `slEnabled`: Toggle to include the slow EMA as a trend filter
* `takeProfitPct`, `stopLossPct`: % values for TP and SL
* `showRibbon`: Toggle visibility of EMA lines (the "ribbon")
This flexibility allows optimization for different timeframes, assets, or market conditions.
---
5. **Visuals & Alerts**
* **EMA Ribbon**: Optionally plots all 4 EMAs in distinct colors
* **Alerts**: Configurable alerts for both Buy and Sell pullback signals
* **Strategy Tester**: Fully compatible with TradingView’s backtester to review performance
---
✅ Key Features
* Pine Script **v5** compatible
* Simple yet powerful **trend-pullback strategy**
* Built-in **risk management** (TP/SL)
* Highly **customizable** and easy to optimize
* Works on **any timeframe or market** (stocks, crypto, forex, etc.)
* Optional **EMA Ribbon** and slow filter for visual context
---
📊 Strategy Use Cases
* Intraday trading
* Swing trading
* Trend continuation setups
* Building automated systems in TradingView
* Manual trade confirmation for other systems
---
⚙️ Example Settings
| Parameter | Value |
| ----------------- | --------- |
| Fast EMA Length | 8 |
| Signal EMA Length | 13 |
| Medium EMA Length | 21 |
| Slow EMA Length | 55 |
| Take Profit (%) | 2.0 |
| Stop Loss (%) | 1.0 |
| Use Slow EMA | ✅ Enabled |
---
📌 Important Notes
* This is a **trend-following strategy**. Best results occur in trending markets.
* In sideways or choppy markets, false signals may occur. Consider using higher timeframes or combining with volume filters.
* You can expand this strategy further by integrating:
* Multi-timeframe trend confirmation
* Additional filters (e.g. RSI, MACD)
* Trailing stop loss for dynamic exits
* Visual overlays (e.g. pivot points, fractals) for added context

Smooth Cloud + RSI Liquidity Spectrum + Zig Zag Volume ProfileSmooth Cloud + RSI Liquidity Spectrum + Zig Zag++ Volume Profile" Indicator
| Advanced Trend & Liquidity Analysis.
---
📌 Key Features & Enhancements (Zig Zag++)
This advanced indicator combines **trend-following moving averages, RSI momentum with liquidity factors, and an improved Zig Zag++ algorithm with volume profiling** for precise swing detection.
🔹 Zig Zag++ Upgrades:
✅ **Dynamic Reversal Detection** – Adapts to volatility using percentage-based pivots.
✅ **Volume-Weighted Swing Points** – Highlights high-liquidity turning points.
✅ **Multi-Timeframe Confirmation** – Uses historical pivots for stronger signals.
✅ **Volume Profile Clustering** – Reveals key support/resistance zones based on traded volume.
---
📊 Indicator Components Breakdown
1️⃣ Smooth Cloud (Trend Filter)
- **Fast MA (20-period) & Slow MA (50-period)** – Configurable as EMA, SMA, or WMA.
- **Cloud Coloring** – Green when fast MA > slow MA (bullish), red otherwise (bearish).
- **Purpose**: Acts as a trend filter—only take trades in the direction of the cloud.
2️⃣ RSI Liquidity Spectrum (Momentum + Volume)
- **RSI (14-period default)** – Standard momentum oscillator.
- **Liquidity-Adjusted Momentum** = `(RSI + ROC(RSI,3)) * (Volume / SMA(Volume, RSI Length))`
- **Purpose**: Identifies overbought/oversold conditions with volume confirmation (high volume = stronger signal).
3️⃣ Zig Zag++ (Swing Detection & Volume Profiling)
📈 Zig Zag Logic:**
- **Percentage-Based Reversals** (default: 5%) – Only plots swings exceeding this threshold.
- **Pivot Tracking** – Stores price & bar index of each swing point in arrays.
- **Dynamic Line Drawing** – Connects swing points with yellow trendlines.
📊 Volume Profile at Swings:
- **Lookback Period** (200 bars default) – Analyzes volume distribution between Zig Zag turns.
- **10-Price Bin Clustering** – Splits the price range into 10 levels and calculates traded volume at each.
- **Transparency Scaling** – Higher volume zones appear darker (stronger support/resistance).
---
🎯 Step-by-Step Trading Strategies
📈 Strategy 1: Trend-Following with RSI Liquidity Confirmation**
1. **Enter Long** when:
- Smooth Cloud is **green** (fast MA > slow MA).
- RSI Liquidity Momentum crosses above **30** (bullish momentum + volume).
- Price pulls back to the **Volume Profile high-volume zone** (demand area).
2. **Enter Short** when:
- Smooth Cloud is **red** (fast MA < slow MA).
- RSI Liquidity Momentum crosses below **70** (bearish momentum + volume).
- Price rallies into the **Volume Profile high-volume zone** (supply area).
3. **Exit** when:
- Zig Zag++ detects a new reversal (5% move against position).
- RSI Liquidity Momentum crosses back mid-level (50).
---
📉 Strategy 2: Swing Trading with Zig Zag++ Pivots**
1. **Buy at Swing Lows** when:
- Zig Zag++ prints a **higher low** (bullish structure).
- Volume Profile shows **strong absorption** (high volume at the low).
- RSI Liquidity Momentum is rising from oversold (<30).
2. **Sell at Swing Highs** when:
- Zig Zag++ prints a **lower high** (bearish structure).
- Volume Profile shows **distribution** (high volume at the top).
- RSI Liquidity Momentum is falling from overbought (>70).
3. **Stop Loss**:
- Below the recent Zig Zag low (for longs).
- Above the recent Zig Zag high (for shorts).
---
📌 Additional Enhancements (Pro Tips)**
- **Combine with Higher Timeframe (HTF) Cloud** – Use a 4H/1D cloud to filter trades.
- **Divergence Detection** – Hidden bullish/bearish divergences between Zig Zag & RSI Liquidity.
- **Volume Spike Confirmation** – Only trade if volume exceeds SMA(volume, 20) at reversal points.
---
🚀 Conclusion
This **all-in-one indicator** provides:
✔ **Trend direction** (Smooth Cloud)
✔ **Momentum + Liquidity strength** (RSI Spectrum)
✔ **Precise swing points** (Zig Zag++)
✔ **Volume-based S/R zones** (Profile Clustering)
Best used on **15M-4H timeframes** for swing/day trading. Adjust parameters based on asset volatility.

RSI-CCI Momentum ScreenerRSI-CCI Momentum Screener;
How to Use:
Apply this script to 1H or 4H timeframe
Works well for NSE stocks, crypto, or forex
Look for a green label “BUY” that shows when the screener conditions are met

RSI-Stochastic Combined Oscillator(Mastersinnifty)Description
The RSI-Stochastic Combined Oscillator blends the strengths of RSI and Stochastic indicators to offer a refined view of market momentum. This custom oscillator highlights high-probability turning points using both value crossovers and directional momentum filters. Enhanced signal logic distinguishes between strong and weak trade setups.
How It Works
Calculates RSI and Stochastic %K using user-defined lengths.
Generates a combined oscillator by averaging RSI and Stochastic %K.
Smoothes the output with configurable MA for clarity.
Generates bullish/bearish signals based on crossover logic and momentum strength.
Includes overbought/oversold zones and background color warnings.
Optional signal table displays real-time values for RSI, Stochastic, Combo, and Signal Line.
Inputs
RSI Length – Period for RSI calculation.
Stochastic %K/%D Length – Periods for Stochastic values.
Combined Oscillator Smoothing – Moving average smoothing period.
Overbought/Oversold Levels – Thresholds for signal filtering and background alerts.
Use Case
Ideal for traders looking to:
Confirm entries using dual momentum logic.
Filter out noise with smoothed oscillators.
Identify high-conviction reversal zones.
Receive alerts based on strong and weak momentum shifts.
Disclaimer
This indicator is designed for educational purposes only and does not constitute financial advice. Always conduct your own analysis before making trading decisions.

Buy/Sell Signals(Mastersinnifty)Description
This script generates simple Buy/Sell signals based on the Relative Strength Index (RSI) crossing the midpoint level of 50. It's designed for traders who prefer clear, rule-based entries and exits derived from momentum shifts.
How It Works
Calculates RSI using the closing price and a 14-period length.
Generates a Buy signal when RSI crosses above 50, indicating potential bullish momentum.
Generates a Sell signal when RSI crosses below 50, indicating potential bearish momentum.
Plots the signals as labels directly on the price chart.
Inputs
RSI Source: Close (fixed in the script)
RSI Length: 14 (standard default)
Use Case
Useful for identifying momentum shifts and trend confirmations.
Can be combined with other technical tools like support/resistance or volume for enhanced decision-making.
Best suited for intraday or swing trading strategies that use momentum-based entry signals.
Disclaimer
This indicator is intended for educational and informational purposes only. It does not constitute financial advice. Always perform your own due diligence and consult a financial advisor before making trading decisions.

BERLIN-MAX 1V.5BERLIN-MAX 1V.5 is a comprehensive trading indicator designed for TradingView that combines multiple advanced strategies and tools. It integrates EMA crossover signals, UT Bot logic with ATR-based trailing stops, customizable stop-loss and target multipliers per timeframe, Hull Moving Averages with color-coded trends, linear regression channels for support and resistance, and a multi-timeframe RSI and volume signal table. This script aims to provide clear entry and exit signals for scalping and swing trading, enhancing decision-making across different market conditions.

RSI & MFI Candle Color tohungmc tikRSI & MFI Candle Color with Alerts is a visual momentum indicator that highlights overbought and oversold conditions directly on your chart using candle colors.
This script combines the Relative Strength Index (RSI) and the Money Flow Index (MFI) with flexible settings, allowing you to:
✅ Display candle color based on RSI
✅ Display candle color based on MFI
✅ Show only candles where both RSI and MFI agree (for stronger signals)
✅ Customize overbought and oversold thresholds
✅ Receive real-time alerts when conditions are met at candle close
Color Logic:
White candles = Overbought (above threshold)
Blue candles = Oversold (below threshold)
Use case:
This tool is useful for traders who want quick, visual confirmation of momentum extremes, and who may combine RSI and MFI for higher accuracy.
Tip: Use with hidden candles (turn off price candles) or overlay it on price action for enhanced visibility.

Advanced Supertrend StrategyA comprehensive Pine Script v5 strategy featuring an enhanced Supertrend indicator with multiple technical filters, risk management, and advanced signal confirmation for automated trading on TradingView.
## Features
- **Enhanced Supertrend**: Configurable ATR-based trend following with improved accuracy
- **RSI Filter**: Optional RSI-based signal filtering to avoid overbought/oversold conditions
- **Moving Average Filter**: Trend confirmation using SMA/EMA/WMA with customizable periods
- **Risk Management**: Built-in stop-loss and take-profit based on ATR multiples
- **Trend Strength Analysis**: Filters weak signals by requiring minimum trend duration
- **Breakout Confirmation**: Optional price breakout validation for stronger signals
- **Visual Interface**: Comprehensive chart plotting with multiple indicator overlays
- **Advanced Alerts**: Multiple alert conditions with detailed signal information
- **Backtesting**: Full strategy backtesting with commission and realistic execution

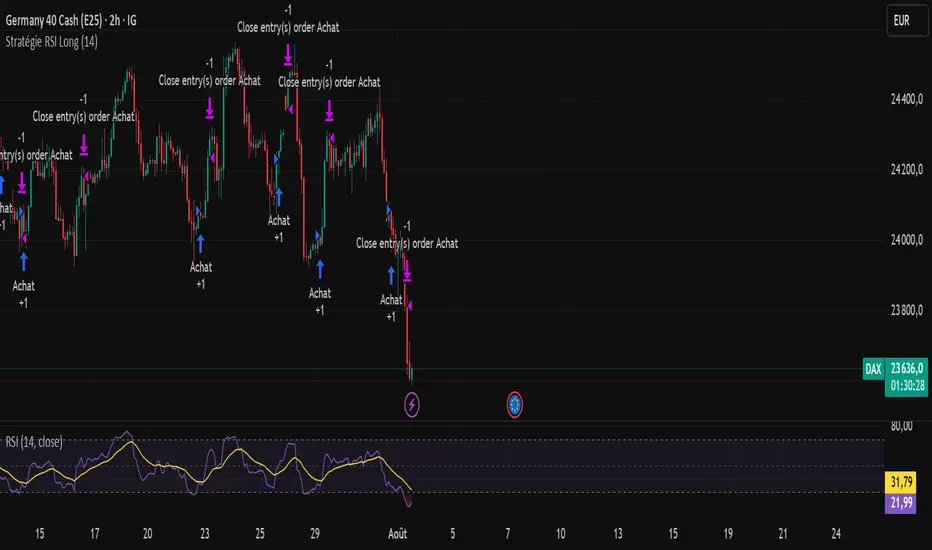
RSI Strategy - Long Position DAX 2 hours - Dow Jones 1 hourLong position strategy based on the RSI.Works very well on the DAX 40 (2-hour base) and the DOW (1-hour base).The entry signal is very good. The exit signal (take profit) needs to be reviewed.
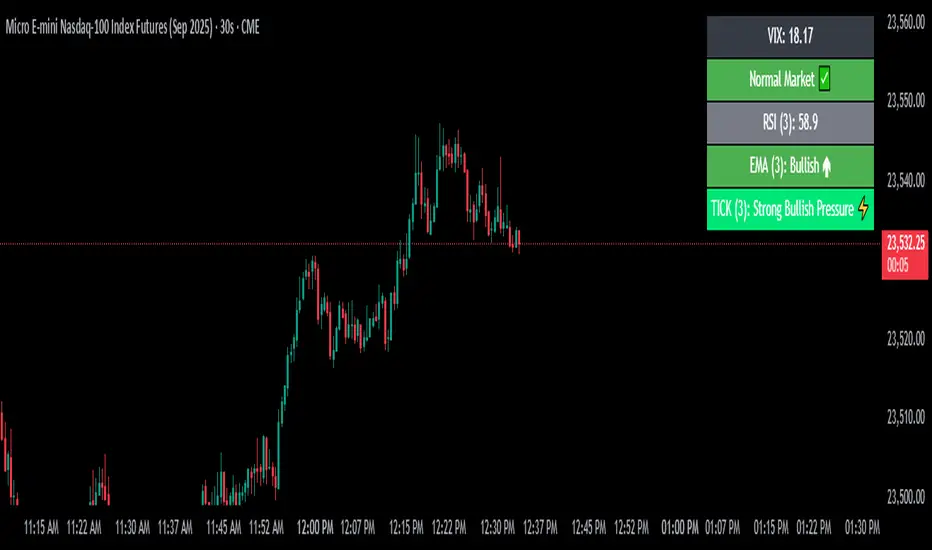
VIX Filter/RSI/EMA Bias/Cum-TICK w/ Exhaustion Zone DashboardThis all-in-one dashboard gives intraday traders a real-time visual read of market conditions, combining volatility regime, trend bias, momentum exhaustion, and internal strength — all in a fully customizable overlay that won’t clutter your chart.
📉 VIX Market Regime Detector
Identifies "Weak", "Normal", "Volatile", or "Danger" market states based on customizable VIX ranges and symbol (e.g., VXN or VIX).
📊 RSI Momentum Readout
Displays real-time RSI from any selected timeframe or symbol, with adjustable length, OB/OS thresholds, and color-coded exhaustion alerts.
📈 EMA Trend Bias Scanner
Compares fast and slow EMAs to define bullish or bearish bias, using your preferred timeframe, symbol, and EMA lengths — ideal for multi-timeframe setups.
🧠 Cumulative TICK Pressure & Exhaustion Engine
Analyzes internal market strength using cumulative TICK data to classify conditions as:
-Strong / Mild Bullish or Bearish Pressure
-Choppy / No Edge
-⚠️ Exhaustion Zones — when raw TICK values hit extreme highs/lows, a separate highlight box appears in the dashboard, warning of potential turning points
All logic is customizable, including TICK symbol, timeframes, thresholds, and lookback periods.
Scalpers and day traders who want fast, visual insight into market internals, exhaustion, and trend bias.
ZigZag Based RSIDescription
ZigZag Trend RSI (ZZ-RSI) is an advanced momentum indicator that combines ZigZag-based trend detection with a trend-adjusted RSI to deliver smarter overbought and oversold signals. Unlike traditional RSI that reacts purely to price movement, this indicator adapts its sensitivity based on the prevailing trend structure identified via the ZigZag pattern.
By dynamically adjusting RSI thresholds according to market direction, ZZ-RSI helps filter out false signals and aligns RSI readings with broader trend context—crucial for trend-following strategies, counter-trend entries, and volatility-based timing.
Core Components
ZigZag Pattern Recognition:
Identifies significant swing highs and lows based on price deviation (%) and pivot sensitivity (length). The most recent pivot determines the prevailing trend direction:
🟢 Bullish: last swing is a higher high
🔴 Bearish: last swing is a lower low
⚪ Neutral: no recent significant movement
Trend-Weighted RSI:
Modifies traditional RSI input by emphasizing price changes in the direction of the trend:
In bull trends, upside moves are magnified.
In bear trends, downside moves are emphasized.
Dynamic RSI Zones:
Overbought and Oversold thresholds adapt to the trend:
In uptrends: higher OB and slightly raised OS → tolerate stronger rallies
In downtrends: lower OS and slightly reduced OB → accommodate stronger sell-offs
In neutral: default OB/OS values apply
How to Use
✅ Entries (Reversal or Mean Reversion Traders):
Look for oversold signals (green triangle) in downtrends or neutrals to catch potential reversals.
Look for overbought signals (red triangle) in uptrends or neutrals to fade momentum.
Confirm with price action or volume for higher conviction.
📈 Trend Continuation (Momentum or Trend-Followers):
Use the trend direction label (Bullish / Bearish / Neutral) to align your trades with the broader move.
Combine with moving averages or price structure for entry timing.
Avoid counter-trend signals unless confirmed by divergence or exhaustion.
🧠 Signal Interpretation Table (top right of chart):
Trend: Indicates the current market direction.
RSI: Real-time trend-adjusted RSI value.
Signal: OB/OS/Neutral classification.
Customization Options
ZigZag Length / Deviation %:
Adjust pivot sensitivity and filter out minor noise.
RSI Length:
Controls how fast RSI responds to trend-adjusted price.
Color Settings:
Personalize visual cues for trend direction and OB/OS backgrounds.
Alerts Included
📢 Overbought/oversold conditions
🔄 Trend reversals (bullish or bearish shift)
These alerts are ideal for automated strategies, mobile notifications, or algorithmic workflows.
Ideal For
Traders seeking smarter RSI signals filtered by market structure
Trend-followers and swing traders looking for reliable reversals
Those frustrated with false OB/OS signals in volatile or trending markets
Best Practices
Use in confluence with price structure, trendlines, or S/R levels.
For intraday: consider lowering ZigZag Length and RSI Length.
For higher timeframes: use higher deviation % and smoother RSI to reduce noise.
