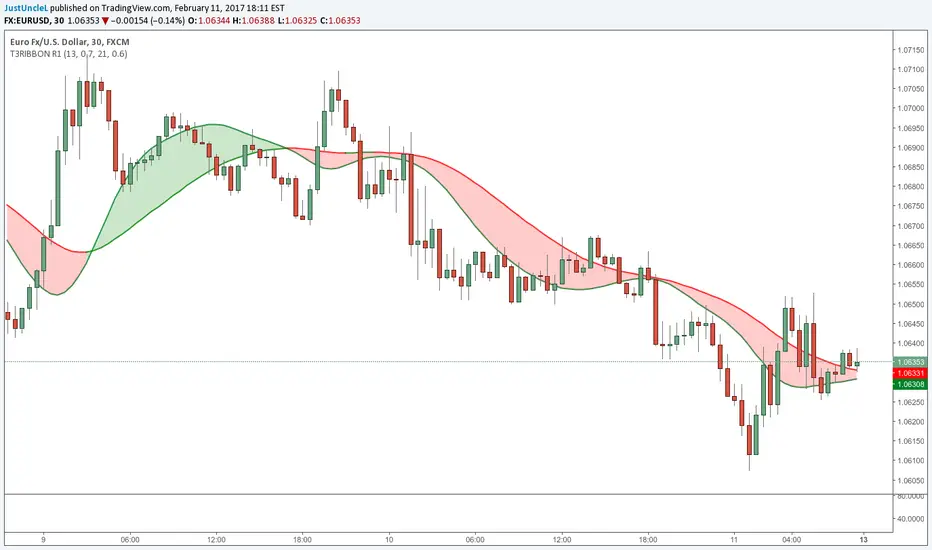
T3MA Ribbon R1 by JustUncleLThis study draws a T3 Moving average Coloured Ribbon based on a Fast and Slow T3 MAs. Combine with an alert indicator like "Traders Dynamic Index Indicator Alert v0.1 by JustUncleL" to get a good trading method (See my comment following).
Ribbon
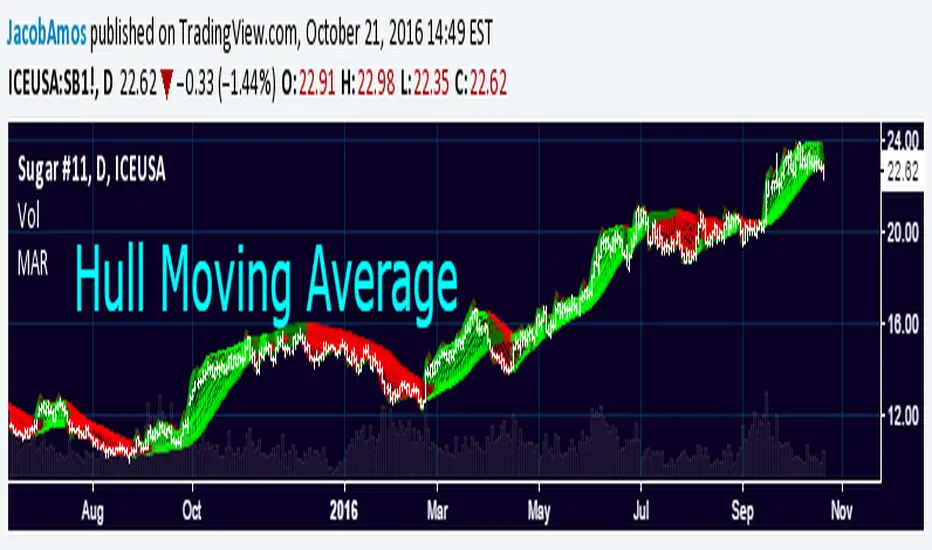
Moving Average RibbonThis is an extension of the Madrid Moving Average Ribbon public script to allow for different kinds of moving averages (the original allows only exponential and simple). Possible entries in the MA Type argument field are:
sma (simple moving average)
ema (exponential moving average)
wma (weighted moving average)
trima (triangular moving average)
zlema (zero-lag exponential moving average)
dema (double exponential moving average)
tema (triple exponential moving average)
hma (hull moving average)
If the argument given by the user does not match anything from the above list, it will default to ema.
B3 EMA RibbonAs a person versed in other languages of script, I am sharing my first pinescript. I have just thrown together some EMA lines and testing out the fill() function. I have some 400+ indicators I could make and share, so cheers to many more! As I get more versed in the language, I will make more intricate studies based on high math and sound strategy.

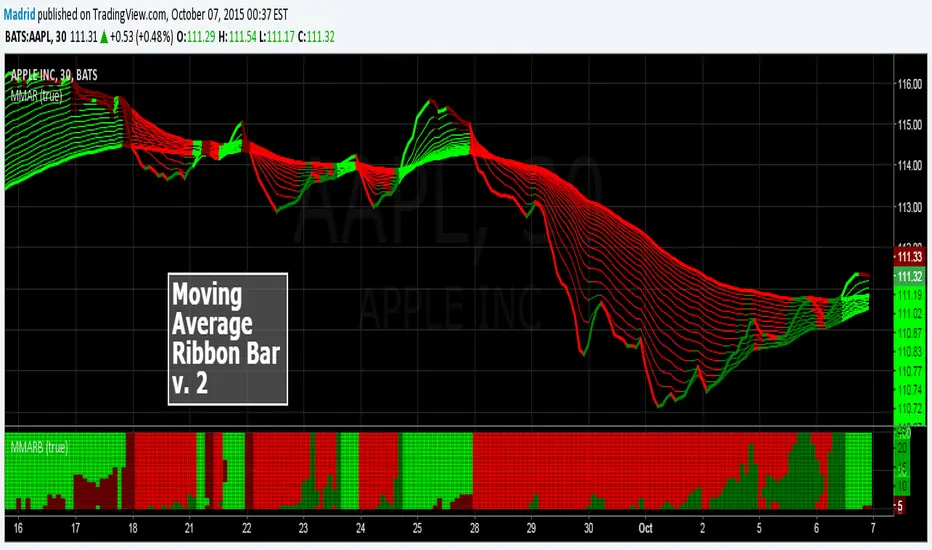
Madrid MA Ribbon Bar v2This script is the second version of the Moving average Ribbon Bar, a companion study of the MA Ribbon. In this version the display is changed, instead of lines, it display the results in stacked bars, making it more user friendly and allowing it to be expanded or contracted without loosing visual continuity.
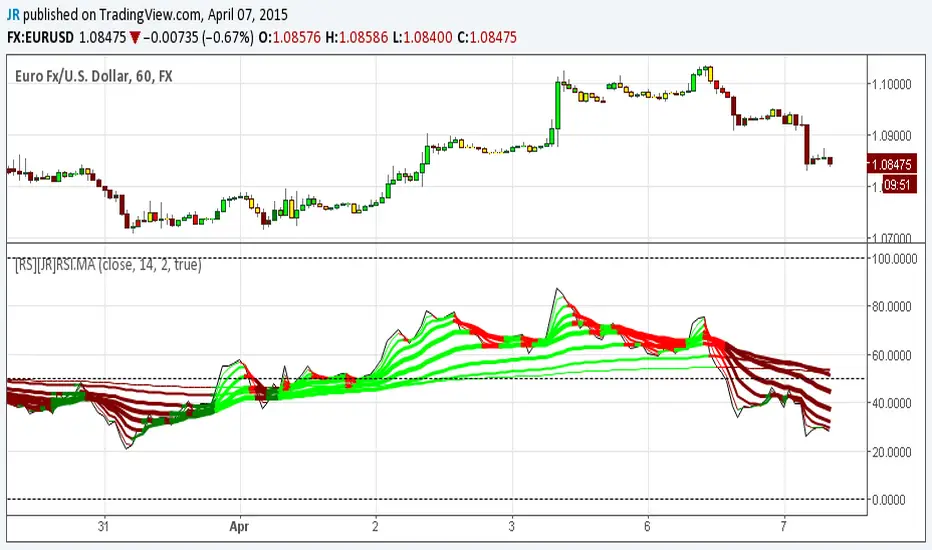
[RS][JR]RSI Ribbon + CandleRSI Ribbon + Candle
By Ricardo Santos and JR
In this chart rendering we are combining RSI and Moving Averages. For an added features we included colors to the candles and ribbons. Lime and green displays a strong bullish trend, yellow is caution or no trade, red and maroon are bearish trends. You can also find divergences using the ribbon.
Divergence
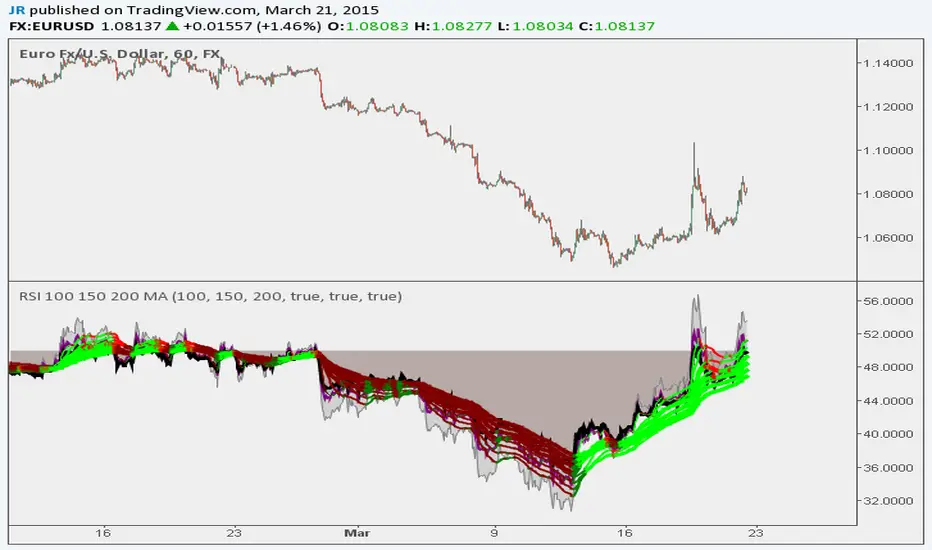
RSI 100 150 200 MA Ribbon
Following Trends and Finding Divergences
Here is a script example that uses a long length (100, 150, 200) RSI MA Ribbon to detect trend reversals using lower time frames. You can also use traditional RSI to find divergences.
Built Best for 1H to 10 Min Charting
BTCUSD
Madrid Moving Average RibbonThis plots a moving average ribbon, either exponential or standard. It provides an easy and fast way to determine the trend direction and possible reversals.
Lime : Uptrend. Long trading
Maroon : Reentry (buy the dip) or downtrend reversal warning
Red : Downtrend. Short trading
Green : Short Reentry (sell the peak) or uptrend reversal warning
To best determine if this is a reentry point or a trend reversal the MMARB (Madrid Moving Average Ribbon Bar) study is used. This is the bar located at the bottom. This bar signals when a current trend reentry is found (partially filled with opposite dark color) or when a trend reversal is ahead (completely filled with opposite dark color).
This study requires no parameters, and it can be used on any time frame.
I hope this effort can help you in your trading.

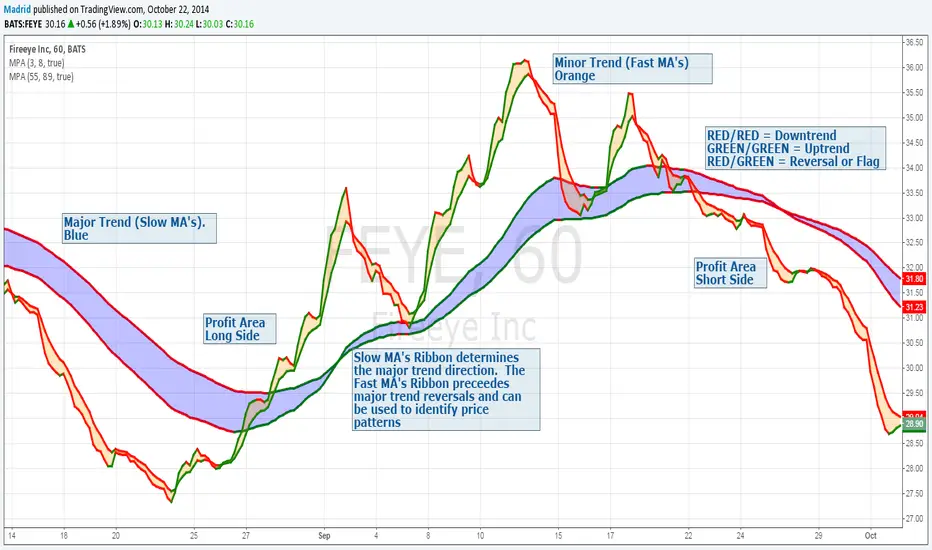
Madrid Profit AreaThis study displays a ribbon made of two moving averages identified by a filled Area. This provides visual aids to determine the trend direction and pivot points. The moving average will be Red if its value is decreasing, and green if it is increasing. When both MA's are the same color we have a trend direction. If those are different then we have a trend reversal and a pivot point.
If combined with another ribbon then it can be configured so we have a pair of slow MA's and another pair of fast MA's , this can visually determine if the price is in bull or bear territory following the basic rules:
1. Fast MA pair above the slow MA Pair = Bullish
2. Fast MA pair below the slow MA Pair = Bearish
3. If the fast MA crosses over the slow MA it is a Bullish reversal
4. If the fast MA crosses below the the slow MA, it is a Bearish reversal.
The use of the ribbons without the price bars or line reduces the noise inherent to the price