Rsi-2
CCI & EMA_CROSS_PaydarCCI & EMA_CROSS_Paydar
Hello everyone
This indicator is actually a very efficient oscillator,
This system is a unique combination of indicators CCI and EMA, which of course has special settings, these settings are adjusted as much as possible due to signaling.
As you can see in the picture:
CCI: the two colors line, green and red, are actually the same indicator CCI that I set to 20.
*Note that in index CCI I have set the lines +100 and -100 to +75 and -75 for less error and a stronger signal to sell or buy.
EMA: The white line, which is in the form of steps, is in fact the same indicator of EMA, which I have considered as a value of 9.
_________________________________________________________________________________________________________
Instructions
-> areas:
Zone +75 to +200 = positive range or incremental price or bullish
Zone +75 to -75 = Neutral range or almost constant price (no fluctuations or very wet fluctuations)
Zone -75 to -200 = single range or discount price or bearish
->How to use:
Buy = In the bearish range, if line CCI intersects line EMA upwards and goes to the neutral zone.
None = if the index (or index lines) collide in the neutral zone
Sell = In the bullish range, if line CCI intersects line EMA down and goes to the neutral zone.
-> Please comment on this system or if you have a good experience in changing the values of the indicators or it seems to you, please share.
With great respect to:
Who had published the main idea of this system.

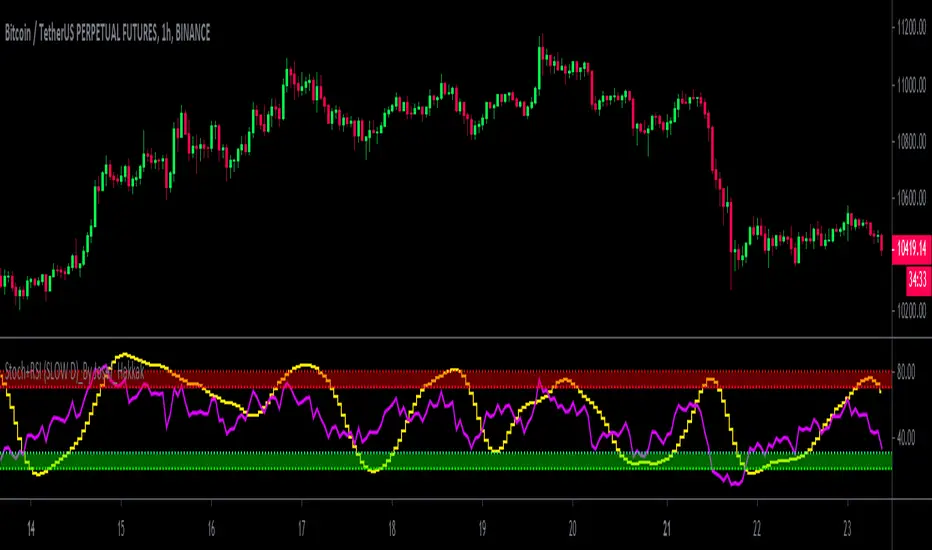
Stoch+RSI (SLOW D)_By Josef_HakkakStoch+RSI (SLOW D)_By Josef_Hakkak
Stochastic and RSI by SLOW D%
-> How to use:
B UY = When the yellow line (D of Slow Stoch ) goes out of the green range, it is better that the purple line ( RSI ) is be low
SELL = When the yellow line (D of Slow Stoch ) goes out of the red range, it is better to have the purple line ( RSI ) is be high
This script was previously written by RRanjanFX and has now been edited by me and changes have been made to optimize for shorter timeframes.
Edited and updated and optimized from:
RRanjanFX
Many thanks and loyal to RRanjanFX
Sell Gravitation IndexThe Sell Gravitation Index was created by Howard Wang and was published in Stocks & Commodities V37:02 (36-38)
This indicator is similar to the relative strength index but the big difference is that this indicator gives early buy and sell signals which I find very helpful. Buy when it rises above its signal line and sell when it falls below its signal line.
Let me know if you would like to see me publish any other scripts!

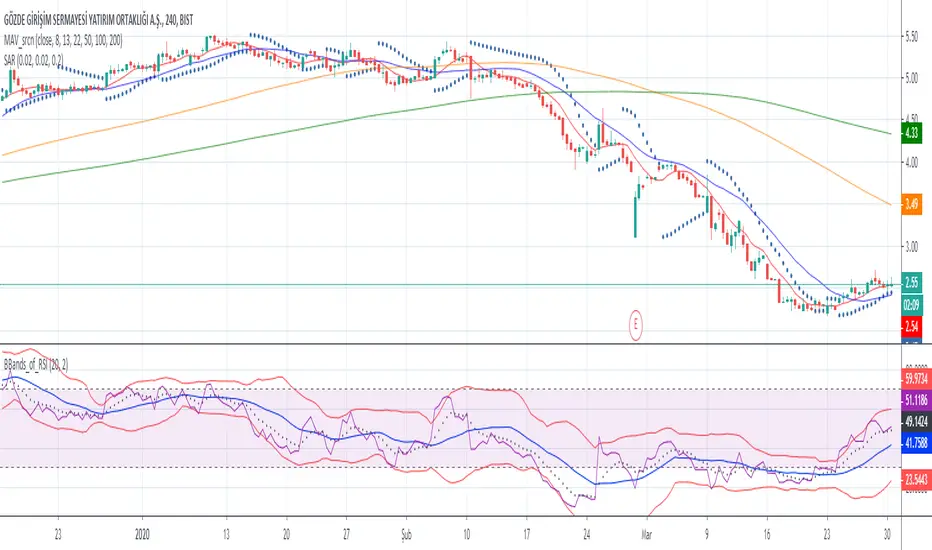
Bollinger Bands of RSIwith this script you can follow ema8 of RSI and also SMA20 of RSI with ∓ 2 standart deviation
Divergence OBV RSI[mado]Divergence screener for OBV RSI
Regular Bullish: "D" navy label
Hidden Bullish: "H" navy label
Regular Bearish: "D" red label
Hidden Bearish: "H" red label

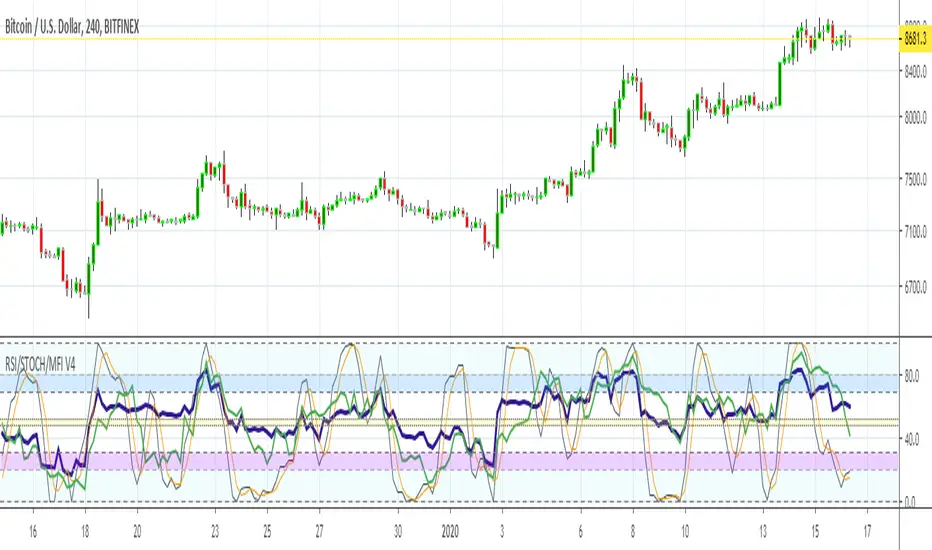
MFI RSI w STOCH OVERLAY V3Combines: Relative Strength (purple) and RSI Stoch (Orange/gray), Money Flow (green) all in one indicator window.
On screen indicator text identifier will read in this order: "RSI/STOCH/MFI V3"
// Changes from original version \\
It was important to bring forth the RSI indicator as the most visually important line and its relationship to the background.
A: Major visual changes from my first published one..as default now
1: Increased RSI line to size 3
2: Increased MFI line to size 2
3: Separated all Bar Line Fields in the background for custom editing, total of 5 now. Much easier to distinguish when the RSI enters these fields.
B: Other major changes as default now
1: Sped up the indicators from 14 to 11, for quicker response. (user can adjust back to 14 or another number)
2: Increased user friendly inputs to adjust colors, lines, data, etc.
3: (darken / lighten and change background colors, increase/decrease line strengths and colors, adjust field data inputs)
Enjoy and Good Luck Trading.
DW-RSI EMA with EMA of RSIThis is an RSI Oscillator with an EMA of the RSI for a signal line. The RSI line is Green when above the signal line and Red when below the signal line.
This does not use the traditional 30% / 70% over sold / over bought analysis. Therefore the levels are not shown.
The analysis is this:
When the RSI is above the signal line then price has a bullish bias.
When the RSI is below the signal line then price has a bearish bias.
I wrote use this for Forex Spot Currencies where I feel overbought and oversold may be less valid than it may be in other markets such as stocks.
As with all indicators, do not use as your sole reason to enter the market, but use with other indicators or price action signals to get a confluence of signals to confirm your entry.
I use it with an 8, 21 and 50 EMA to confirm entry and exit. I give it more weight for exits than I do for entries.

RSI with Moving Averages[UO]This RSI indicator is one of my favorite indicators. This powerful indicator is implemented by Phi-Deltalytics. I modified the drawing so that it is easier (at least for me) to see the signals and trends (it would not matter if you're doing algorithmic trading).
Trends and signals. For detailed instructions and tutorial see Phi-Deltalytics page

Gaussian MFI BFThe signals are based on the Gaussian Channel calculated by Donovan Wall. Thanks also to Kiasaki for Rate of Change code.
Simply going long and short based on Gaussian channel was not consistent enough so I also included an MFI filter. We only go long if Money Flow Index is greater than the last candle (more money is flowing in than out). The opposite for short. Also employed Rate of Change function (white background) to avoid sideways market.
A 2% stop loss seems to be the most balanced for this strategy but can can altered in the settngs.
Also included a take-profit function but it seems this is best not implemented for this strategy, at least in the case of XBT/USD.
A derivative of The MFI is also plotted on the chart simply to compare the current candle with the last candle visually.
Background color:
Green = Long
Red = Short
White = No Trade

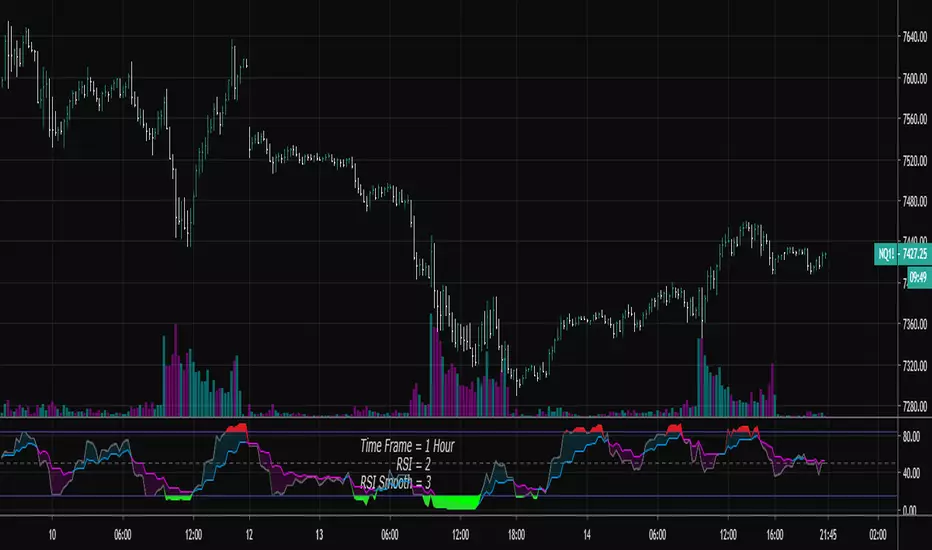
RSI Shaded - MTF
Non-repainting multiple time frame RSI with shading of overbought and oversold levels.
Includes option for simple moving average smooth of the RSI (Larry Connors)
Includes option to plot the EMA of the RSI
Related to RSI Shaded .
For other multiple time frame indicators see:
Adaptive ATR-ADX Trend
Fisher Transform MTF
ADX-DI MTF
Laguerre RSI MTF
MFIww MFI/RSI_v2[wozdux]A new version of the indicator Mfi_v2. Added new control parameters.
tt - the averaging period of the volume.
Len - the period for calculating the MPI.
nn-averaging period MFI (blue line). level-critical levels from below and above (black horizontal lines).
Level 0 or 50 - switch between different histogram views with the middle at either level 50 or level 0.
key level-key to remove black critical levels.
key ema (MFI, nn) - key to remove mfi averaging (blue line).
key color-key to remove histogram coloring.
key colomns a-line - key switching modes represent the mfi histrogram or line.
---------------------------
Новая версия индикатора MFIww_v2. Добавлены новые управляющие параметры.
tt- период усреднения объема.
Len - период вычисления MFI.
nn- период усреднения MFI (голубая линия).
level- критические уровни снизу и сверху (черные горизонтальные линии).
Level 0 or 50 - переключение между разными представлениями гистрограммы с серединой либо на уровне 50 , либо на уровне 0.
key level- ключ убрать черные критические уровни.
key ema(mfi,nn) - ключ убрать усреднение mfi (голубая линия).
key color- ключ убрать расцветку гистрограммы.
key colomns-line - ключ переключения режимов представления mfi гистрограммой или линией.

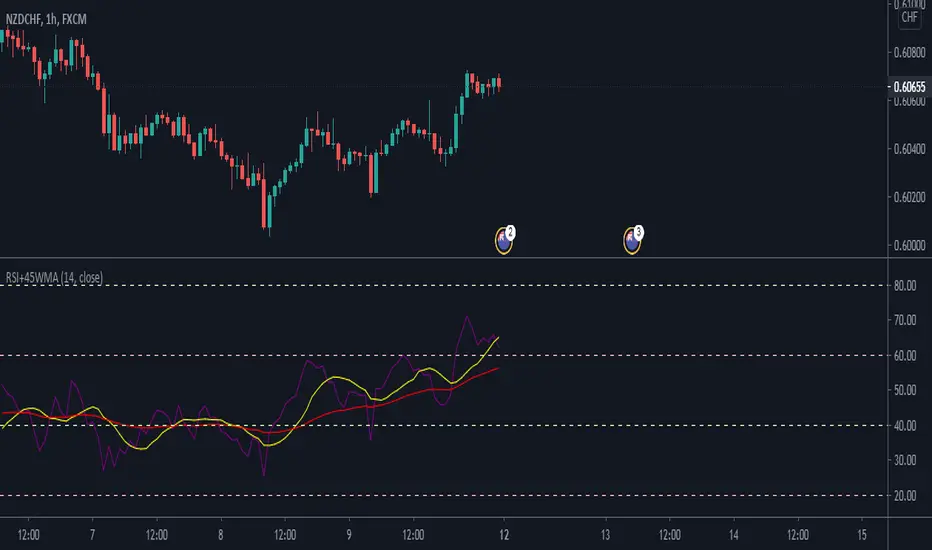
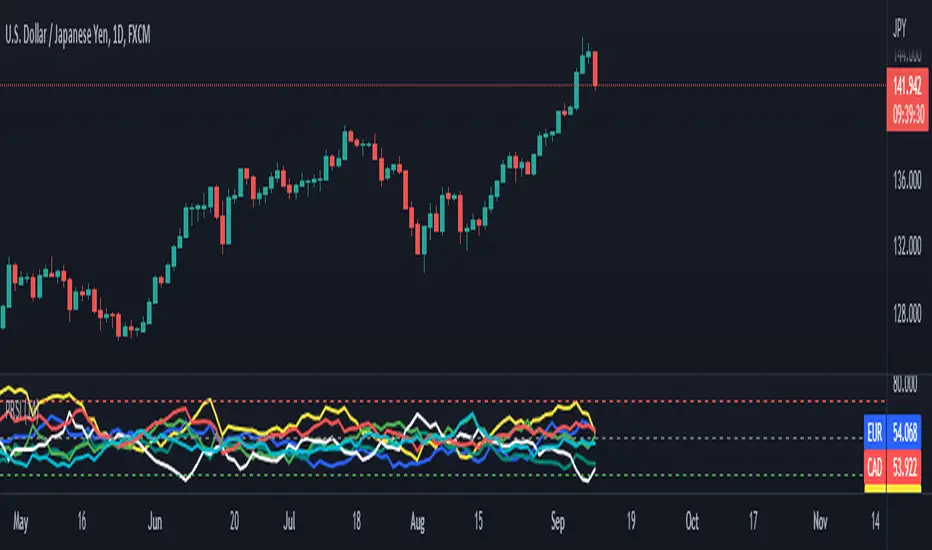
pooya AVG RSIThis is an RSI range for the most popular index in FOREX:
EUR
USD
GBP
JPY
AUD
CAD
CHF
NZD
comment your opinion
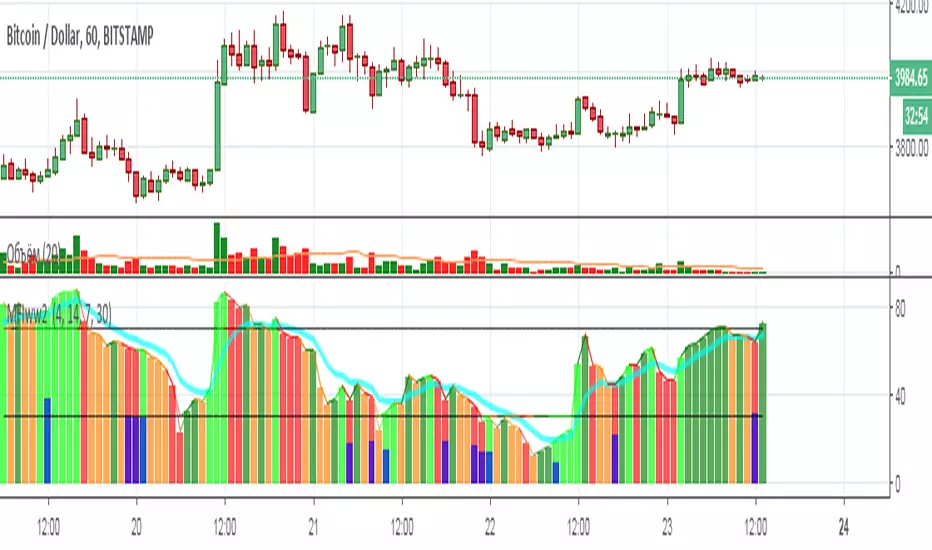
MFIww2 MFI/RSI [wozdux]Bill Williams indicator (MFI).
The indicator calculates the range of oscillations per unit volume. In fact, this indicator shows the tick volume or the readiness of the market to move the price.
The indicator is presented as vertical columns or as a line with levels.
Vertical columns are painted in different colors depending on the displacement of the indicator and the displacement of the volume. The indicator can increase or decrease (+-). The volume can also increase or decrease (+-). The combination of these factors generates four types of indicator columns.
++ lime
+- dark green
-+ red
-- orange
The red bar on Williams is a squat bar. This bar is important for market reversal indication.
-------------------------------
Индикатор Билла Вильямса (MFI).
Индикатор вычисляет диапазон колебаний на единицу объема. Фактически этот индикатор показывает тиковый объем или готовность рынка переместить цену.
Индикатор представлен в виде вертикальных колонок или в виде линии с уровнями.
Вертикальные колонки раскрашены в различные цвета в зависимости от смещения индикатора и смещения объема. Индикатор может увеличиваться или уменьшаться (+-). Объем также может увеличиваться или уменьшаться (+-). Сочетание этих факторо порождает четыре вида столбиков индикатора.
++ салатный
+- темно-зеленый
-+ красный
-- оранжевый
Красный столбик по Вильямсу есть приседающий бар. Этот бар важен для индикации разворота рынка.

RSI Cross by uykusuzpenguenRSI Cross Explanation;
It's simple,
When short-term RSI crossover long-term RSI ; BUY ( Green Area )
When short-term RSI crossunder long-term RSI ; SELL ( Red Area )
You can change RSI lenghts or moving average lenght on settings.
If you knew that, you would sell all your bitcoins at a price of $13.500 and not look back on 8th January.
Happy trading.


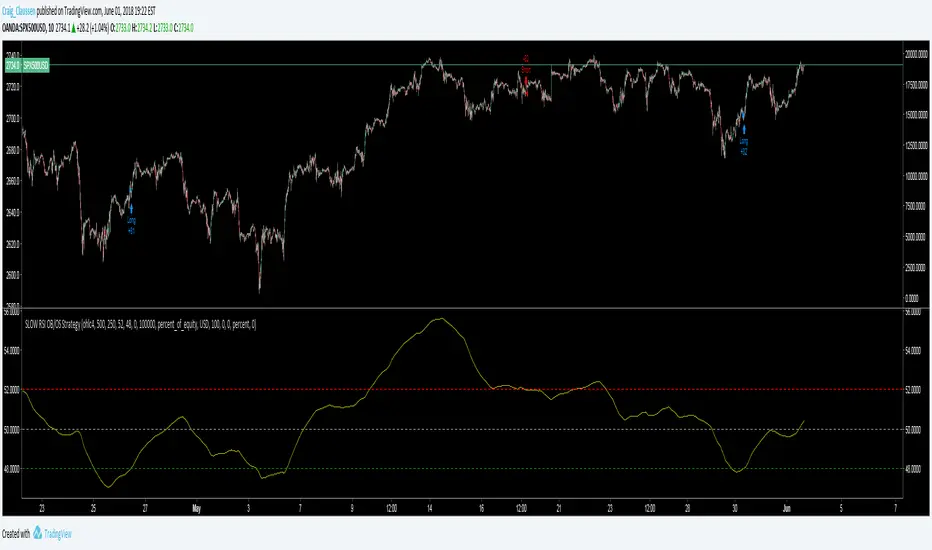
SLOW RSI OB/OS StrategySlowing the RSI down opens up a whole new world of possibilities.
This concept can work for a lot of TA indicators including the MACD.
See script source code for further description. Feel free to add pyramid trades at your own discretion in your format menu.
No this doesn't repaint!
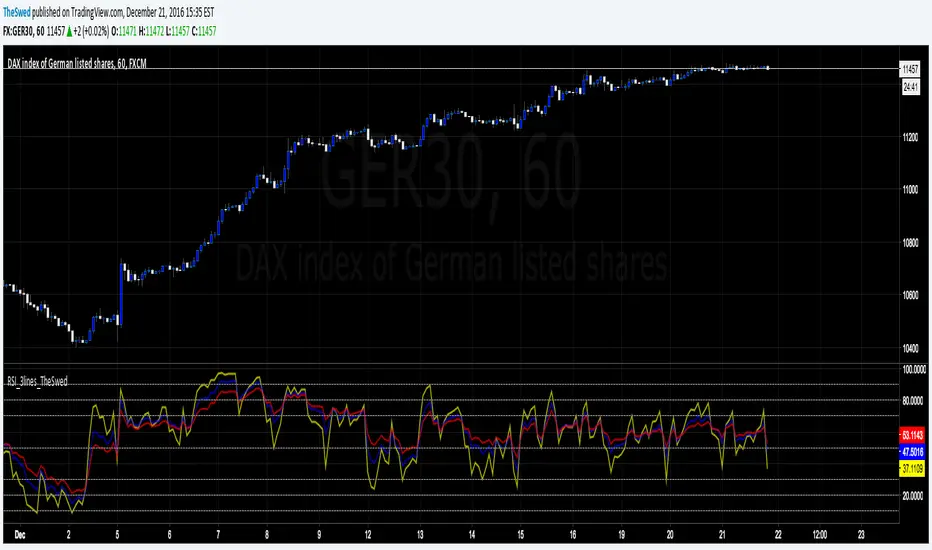
RSI_3lines_TheSwedRSI script with 3 lines. Also added lines: 90, 80, 20 and 10 to the script as I use this for trading.
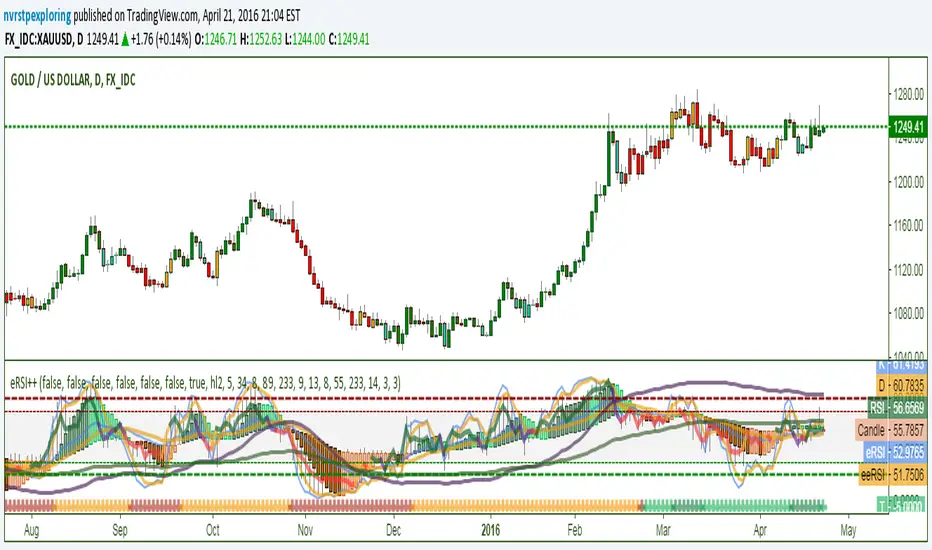
eRSI++Contains RSI; EMA of RSI; EMA of EMA of RSI; Stochastic Oscillator; 2 Inverse Fisher Transforms on RSI - IFRSI89 and IFRSI233 XOVER on higher timeframes from oversold/overbought is useful signal; RSI Trend/Divergence Candles with color variation based on multiple RSI length detection of trend decay; Chart candle overlay coloring based on RSI, eRSI, and eeRSI EMA55 & EMA233 Xover indicator on bottom for trend direction with color variations for counter trend movements.
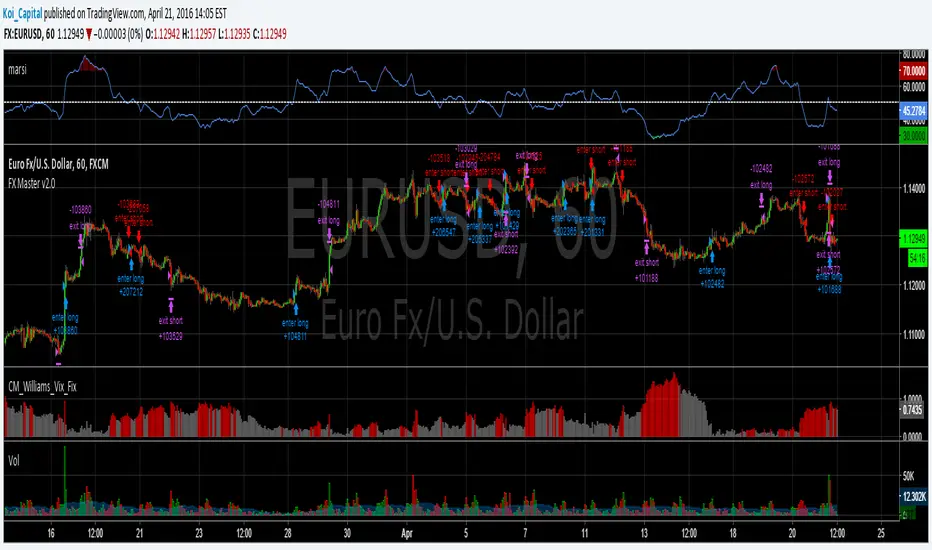
Forex Master v2.0 (EUR/USD)This is version 2 of my Forex Master algorithm originally posted here:
BACKTEST CONDITIONS:
Initial equity = $100,000 (no leverage)
Order size = 100% of equity
Pyramiding = disabled
TRADING RULES:
Long entry = EMA5(RSI20) cross> 50
Profit limit = 50 pips
Stop loss = 50 pips
Short entry = EMA5(RSI20) cross< 50
Profit limit = 50 pips
Stop loss = 50 pips
Long entry = Short exit
Short entry = long exit
DISCLAIMER: None of my ideas and posts are investment advice. Past performance is not an indication of future results. This strategy was constructed with the benefit of hindsight and its future performance cannot be guaranteed.
SPY Master v1.0This is a simple swing trading algorithm that uses a fast RSI-EMA to trigger buy/cover signals and a slow RSI-EMA to trigger sell/short signals for SPY, an xchange-traded fund for the S&P 500.
The idea behind this strategy follows the premise that most profitable momentum trades usually occur during periods when price is trending up or down. Periods of flat price actions are usually where most unprofitable trades occur. Because we cannot predict exactly when trending periods will occur, the algorithm basically bets money on all trade opportunities during all market conditions. Despite an accuracy rate of only 40%, the algorithm's asymmetric risk/reward profile allows the average winner to be 2x the average loser. The end result is a positive (profitable) net payout.
TRADING RULES:
Buy/Cover = EMA3(RSI2) cross> 50
Sell/Short = EMA5(RSI2) cross< 50
BACKTEST SETTINGS:
- Period = March 2011 - Present
- Initial capital = $10,000
- Dividends excluded
- Trading costs excluded
PERFORMANCE COMPARISON:
There are 657 trades, which means 1,314 orders. Assuming each order costs $2 (what I pay for at Interactive Brokers), total trading costs should be $2,628.
-SPY (buy & hold) = 132.73 ---> 193.22 = +45.57% (dividends excluded)
-SPY Master v1.0 = $12,649 - $2,628 = $10,021 = +100.21%
DISCLAIMER: None of my ideas and posts are investment advice. Past performance is not an indication of future results. This strategy was constructed with the benefit of hindsight and its future performance cannot be guaranteed.
