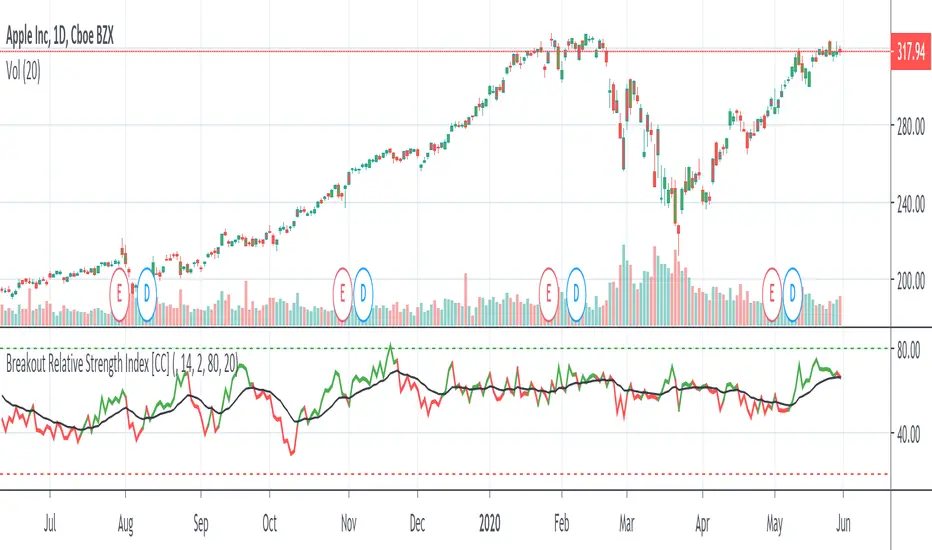
Breakout Relative Strength IndexIt isn't easy to determine if the price of a stock is about to break out. Here’s one way you can determine the relative strength of a breakout, enabling you to act early and realize higher profits.
This indicator was originally developed by Howard Wang Stocks & Commodities V. 33:09 (60–62)
Rsidivergence
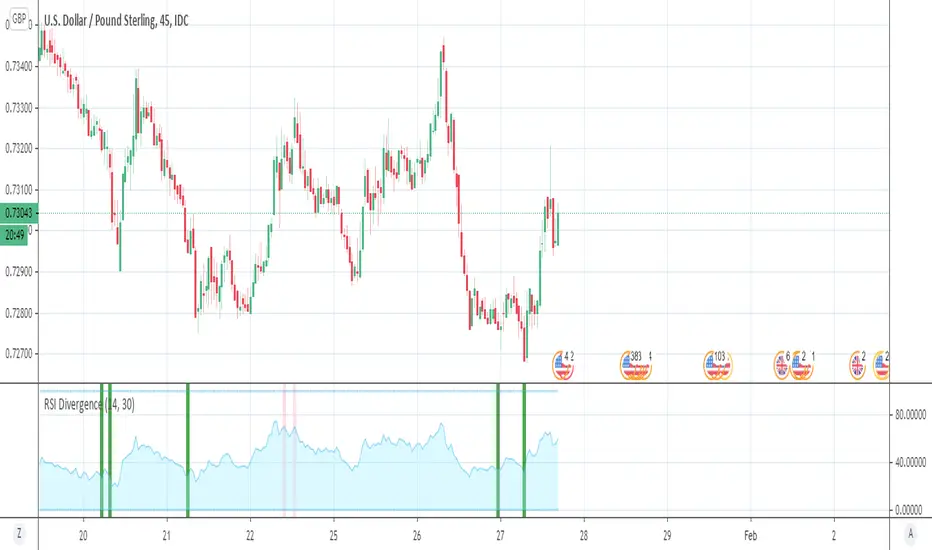
MG - Real time RSI divergenceShows RSI divergences in real time (as soon as bar closes in divergence instead of waiting for an RSI pivot).
There are alerts included on these events so you are immediately made aware of divergence.
Adjustement:
It works by detecting a break of a previous high or low and then comparing the RSI value at the last break to the current break. Therefore, by decreasing the adjacent candles required for a pivot, you increase the number of divergence checks and therefore divergence readings. As with many indicators, with higher the values, you get less but more significant signals. (This can be visualized with the plot pivot lines option)
RSI period can be adjusted


RSI Divergence UltimateHere it is Everyone - What was once hidden is now revealed
This is the Ultimate RSI Divergence Indicator
Not only does it plot Regular and Hidden Divergence lines for an RSI smoothed by an EMA and for its Signal Line
The RSI can be set to change color with direction or can be set as single color with or with out OB / OS highlights
Color Changing RSI helps when trading Multiple Time Frames as you can look for confluence in the direction of RSI
Included options for the Signal Line include;
Various calculations EMA, SMA and Linear Regression which provides very accurate signal line crossover signals
Color Changing with direction
Second RSI with different Length
Multi Time Frame RSI
Bollinger Bands applied to the RSI
RSI Stochastic that has been compressed to fit into RSI OB / OS so that it doesnt compress the RSI when in these regions
There are also Background Highlights (thanks to Chris Moody) for when the RSI Stochastic moves into OB / OS and crosses its signal line
There are plenty of Alerts for signals with more complex alerts coming soon
I have also added Hima Reddy's Power Zones for support and resistance so now you can also
Take full advantage of trading; signal line crosses, 50 crosses and Power Zone RSI support and resistance and much more
The divergence script is thanks to @RicardoSantos, I've just adjusted it to suite my indicator
Remember that divergences work best when traded with the trend or very late in a trend when going against the trend

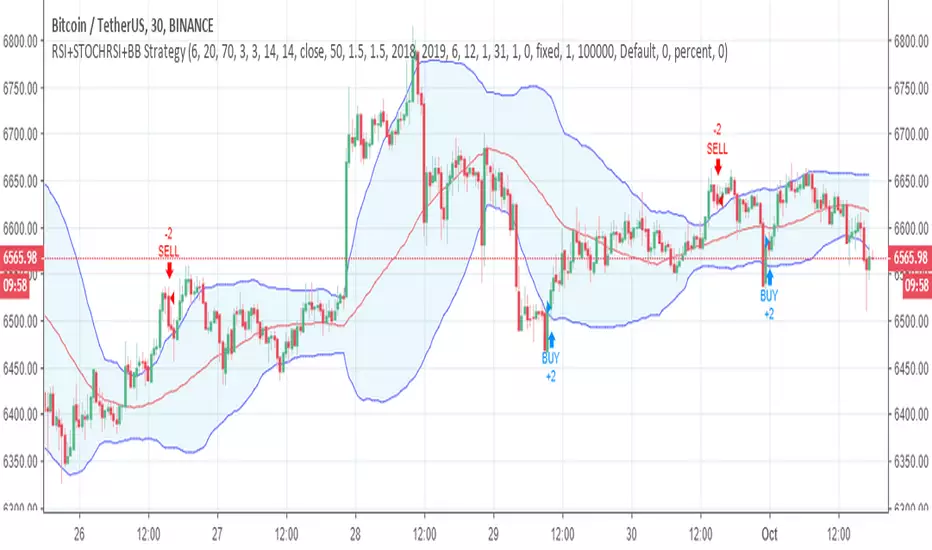
Merge Of RSI & Stochastic RSI [salar88]This Indicator Include Stochastic RSI And Multiple Time Frame RSI
I Wish Its gonna useful for tradingview users

Combined RSI and MA Alert Triggersrsi indicator whith conditional moving average settings for swing trading when market price is above certain moving averages
testing a simple for fun, not intended to be financial advise, do your own research :)
enjoy!
RSI DivergenceSimple RSI Divergence with adjustable lookback period.
Highlights bars with higher price but lower RSI (bearish) or lower price but higher RSI (bullish) than the highest/lowest points in the lookback period.
Relative Strength Index (Log/Divs/MTF/EMA)RSI calculated for log scale, with divergences labeled, as well as a 1 hour 55 EMA for signal.
Original log-space RSI by fskrypt.
Divergences taken from JustUncleL, originally from RicardoSantos.

RSI-MTF-Histo-EntryThis indicator gives a histogram of RSI in relation to an ema of the RSI.
The histogram is then smoothed to reduce false signals.
The actualiteit RSI line with overbought/overvols signals can be added or omitted as preferred.
The background can be color coded if the RSI is above or below 50.
Version 2. Added support for MTF. Longer timesframes (1h-3h) tend to give better entry results.
As an example the indicator was added two times, one for the current timeframe and one for a longer timeframe.


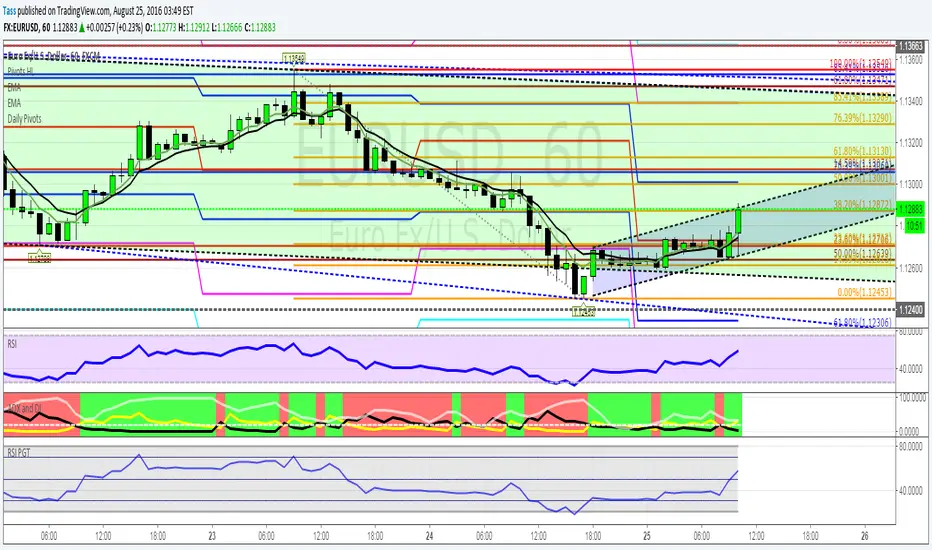
2xStochastic + RSI (two levels, colored)Great tool to find market tops, bottoms, S/R's and reversals.
Rsi has 2 customiseble overbought and oversold levels can show you extreme levels.
Slow Stochastic 1 (25 period) shows small price swings
Slow stochastic 2 (100 period) can show you a greater picture, are we reversing?
Why do you need Leguerre, Murrey, Kaufman oscilator 3000 when you can have old and trusted tool, that has been tweeked very nicely for any timeframe.
I use it in a variety of ways, let me show you some examples:
EXAMPLE 1 (RSI Extreme Level):
1) Find extreme oversold or overbought level that clearly reversed and plop S/R line there. BAM! We have a S/R line
2) Next time you know this line will mean something (Either it will hold, or it will be broken by a big candle) and you can trade it accordingly to Stochastic trading strategy
EXAMPLE 2 (Fibonacci Level finder):
Trading fibo? This can help!
1) Just like fibo trading, find good swing top and bottom
2) You know that price will reverse from 38.2, 50, 61.8, but where? I think this is self explanotory...

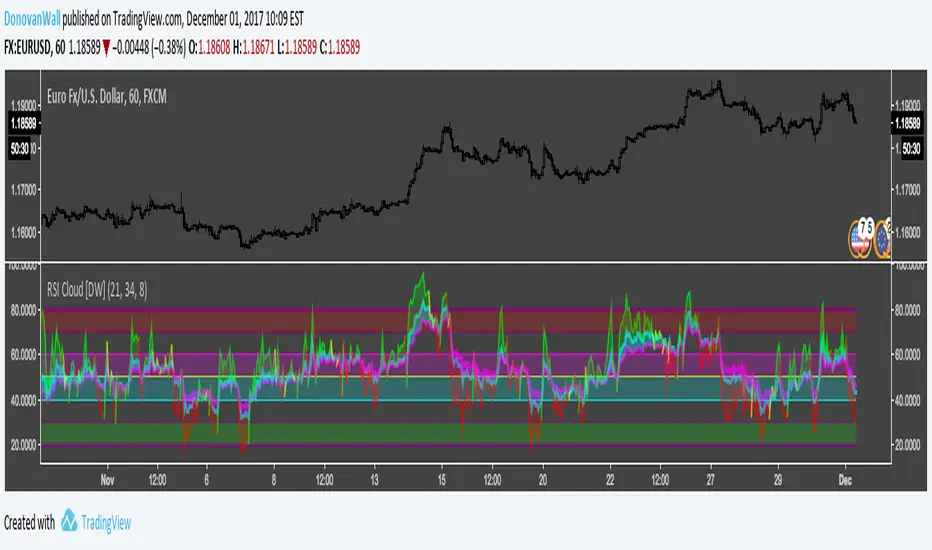
RSI Cloud [DW]This is a simple experimental study utilizing multiple RSIs and their divergences to visualize price activity.