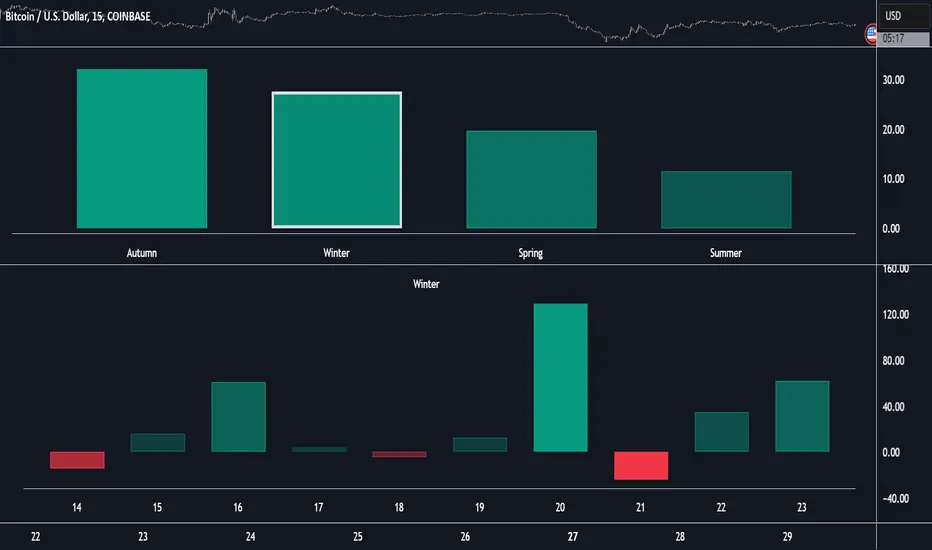
Market Performance by Yearly Seasons [LuxAlgo]The Market Performance by Yearly Seasons tool allows traders to analyze the average returns of the four seasons of the year and the raw returns of each separate season.
🔶 USAGE
By default, the tool displays the average returns for each season over the last 10 years in the form of bars, with the current session highlighted as a bordered bar.
Traders can choose to display the raw returns by year for each season separately and select the maximum number of seasons (years) to display.
🔹 Hemispheres
Traders can select the hemisphere in which they prefer to view the data.
🔹 Season Types
Traders can select the type of seasons between meteorological (by default) and astronomical.
The meteorological seasons are as follows:
Autumn: months from September to November
Winter: months from December to February
Spring: months from March to May
Summer: months from June to August
The astronomical seasons are as follows:
Autumn: from the equinox on September 22
Winter: from the solstice on December 21
Spring: from the equinox on March 20
Summer: from the solstice on June 21
🔹 Displaying the data
Traders can choose between two display modes, average returns by season or raw returns by season and year.
🔶 SETTINGS
Max seasons: Maximum number of seasons
Hemisphere: Select NORTHERN or SOUTHERN hemisphere
Season Type: Select the type of season - ASTRONOMICAL or METEOROLOGICAL
Display: Select display mode, all four seasons, or any one of them
🔹 Style
Bar Size & Autofit: Select the size of the bars and enable/disable the autofit feature
Labels Size: Select the label size
Colors & Gradient: Select the default color for bullish and bearish returns and enable/disable the gradient feature
Seasons
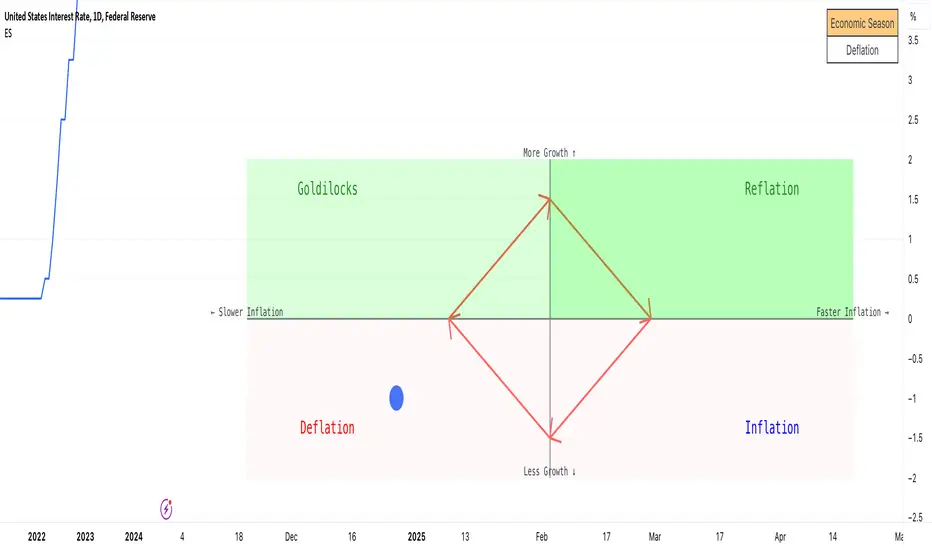
Economic Seasons [Daveatt]Ever wondered what season your economy is in?
Just like Mother Nature has her four seasons, the economy cycles through its own seasons! This indicator helps you visualize where we are in the economic cycle by tracking two key metrics:
📊 What We're Tracking:
1. Interest Rates (USIRYY) - The yearly change in interest rates
2. Inflation Rate (USINTR) - The rate at which prices are rising
The magic happens when we normalize these values (fancy math that makes the numbers play nice together) and compare them to their recent averages. We use a lookback period to calculate the standard deviation and determine if we're seeing higher or lower than normal readings.
🔄 The Four Economic Seasons & Investment Strategy:
1. 🌸 Goldilocks (↑Growth, ↓Inflation)
"Not too hot, not too cold" - The economy is growing steadily without overheating.
BEST TIME TO: Buy growth stocks, technology, consumer discretionary
WHY: Companies can grow earnings in this ideal environment of low rates and stable prices
2. 🌞 Reflation (↑Growth, ↑Inflation)
"Party time... but watch your wallet!" - The economy is heating up.
BEST TIME TO: Buy commodities, banking stocks, real estate
WHY: These sectors thrive when inflation rises alongside growth
3. 🌡️ Inflation (↓Growth, ↑Inflation)
"Ouch, my purchasing power!" - Growth slows while prices keep rising.
BEST TIME TO: Rotate into value stocks, consumer staples, healthcare
WHY: These defensive sectors maintain pricing power during inflationary periods
4. ❄️ Deflation (↓Growth, ↓Inflation)
"Winter is here" - Both growth and inflation are falling.
BEST TIME TO: Focus on quality bonds, cash positions, and dividend aristocrats
WHY: Capital preservation becomes key; high-quality fixed income provides safety
🎯 Strategic Trading Points:
- BUY AGGRESSIVELY: During late Deflation/early Goldilocks (the spring thaw)
- HOLD & ACCUMULATE: Throughout Goldilocks and early Reflation
- START TAKING PROFITS: During late Reflation/early Inflation
- DEFENSIVE POSITIONING: Throughout Inflation and Deflation
⚠️ Warning Signs to Watch:
- Goldilocks → Reflation: Time to reduce growth stock exposure
- Reflation → Inflation: Begin rotating into defensive sectors
- Inflation → Deflation: Quality becomes crucial
- Deflation → Goldilocks: Start building new positions
The blue dot shows you where we are right now in this cycle.
The red arrows in the middle remind us that this is a continuous cycle - one season flows into the next, just like in nature!
💡 Pro Tip: The transitions between seasons often provide the best opportunities - but also the highest risks. Use additional indicators and fundamental analysis to confirm these shifts.
Remember: Just like you wouldn't wear a winter coat in summer, you shouldn't use a Goldilocks strategy during Inflation! Time your trades with the seasons. 🎯
Happy Trading! 📈
AlexD Market annual seasonalityThe indicator displays the percentage of bullish days with a given date over several years.
This allows you to determine the days of the year when the price usually goes up or down.
Indicator has a built-in "simple moving average" shifted back by half a period, due to which the delay of this smoothing is removed.

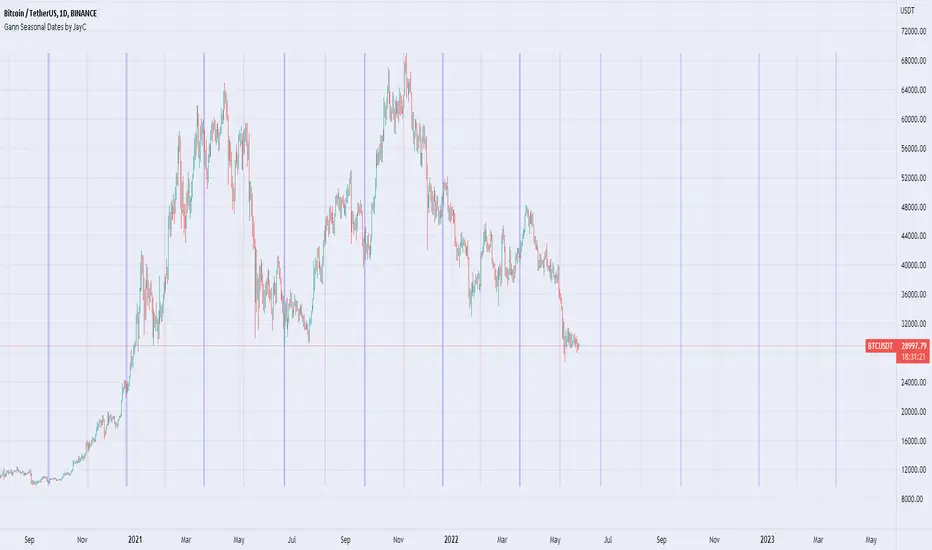
Gann Seasonal Dates by JayCThis script marks important seasonal dates with a vertical line that Gann used to watch for Trend changes.
March 21st
June 22nd
September 23rd
December 22nd
And 50% Levels - Minor seasonal dates.
February 4th
May 6th
August 8th
November 7th
In the settings you can change line colors and toggle the Offset. Offset is the way the script draws lines to show future dates, I offset by 365 so it will show incorrectly at some points in back testing.
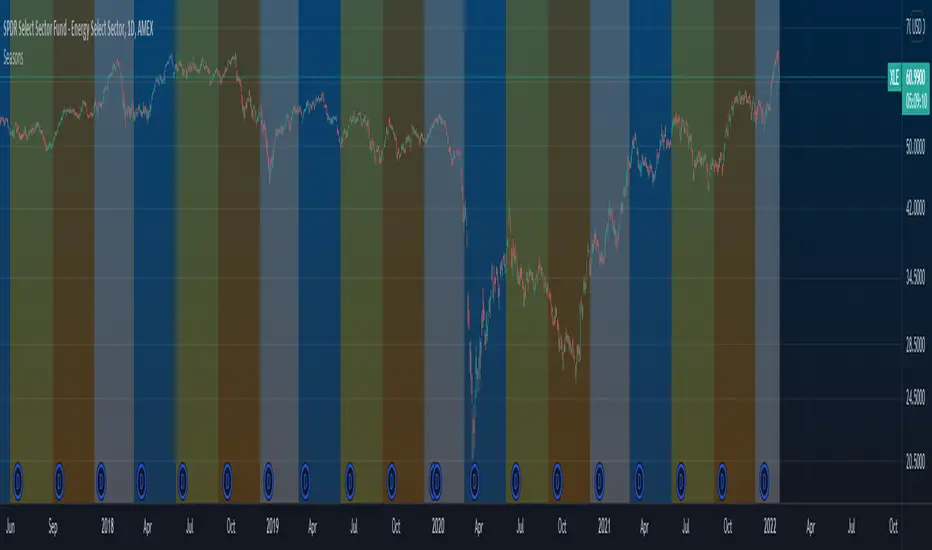
SeasonsSeasons Indicator
What does this show?
This indicator shows the individual seasons to plot on a chart to see how an asset has performed historically during certain seasons.
Orange => Fall
White => Winter
Blue => Spring
Yellow => Summer