RSI & Volume Impact Analyzer Ver.1.00Description:
The RSI VOL Score indicator combines the Relative Strength Index (RSI) and volume data through a mathematical calculation to assist traders in identifying and confirming potential trend reversals and continuations. By leveraging both momentum (RSI) and volume data, this indicator provides a more comprehensive view of market strength compared to using RSI or volume alone.
How It Works:
This indicator calculates a score by comparing the RSI against its moving average, adjusted by the volume data. The resulting score quantifies market momentum and strength. When the score crosses its signal line, it may indicate key moments where the market shifts between bullish and bearish trends, potentially helping traders spot these changes earlier.
Calculation Methods:
The RSI VOL Score allows users to select between several calculation methods to suit their strategy:
SMA (Simple Moving Average): Provides a balanced smoothing approach.
EMA (Exponential Moving Average): Reacts more quickly to recent price changes, offering faster signals.
VWMA (Volume Weighted Moving Average): Emphasizes high-volume periods, focusing on stronger market moves.
WMA (Weighted Moving Average): Applies greater weight to recent data for a more responsive signal.
What the Indicator Plots:
Score Line: Represents a combined metric based on RSI and volume, helping traders gauge the overall strength of the trend.
Signal Line: A smoothed version of the score that helps traders identify potential trend changes. Bullish signals occur when the score crosses above the signal line, while bearish signals occur when the score drops below.
Key Features:
Trend Identification: The score and signal line crossovers can help confirm emerging bullish or bearish trends, allowing traders to act on upward or downward momentum.
Customizable Settings: Traders can adjust the lengths of the RSI and signal line and choose between different moving averages (SMA, EMA, VWMA, WMA) to tailor the indicator to their trading style.
Timeframe-Specific: The indicator works within the selected timeframe, ensuring accurate trend analysis based on the current market context.
Practical Use Cases:
Trending Markets: In trending markets, this indicator helps confirm bullish or bearish signals by validating price moves with volume. Traders can use the crossover of the score and signal line as a guide for entering or exiting trades based on trend strength.
Ranging Markets: In ranging markets, the indicator helps filter out false signals by confirming if price movements are backed by volume, making it a useful tool for traders looking to avoid entering during weak or uncertain market conditions.
Interpreting the Score and Signal Lines:
Bullish Signal: A bullish signal occurs when the score crosses above the signal line, indicating a potential upward trend in momentum and price.
Bearish Signal: A bearish signal is generated when the score crosses below the signal line, suggesting a potential downward trend or weakening market momentum.
By mathematically combining RSI and volume data into a single trend score, the RSI VOL Score indicator provides traders with a powerful tool for identifying trend shifts early and making more confident trading decisions.
Important Note:
The signals generated by this indicator should be interpreted in conjunction with other analysis tools. It is always advisable to confirm signals before making any trading decisions.
Disclaimer:
This indicator is designed to assist traders in their decision-making process and does not provide financial advice. The creators of this tool are not responsible for any financial losses or trading decisions made based on its signals. Trading involves significant risk, and users should seek professional advice or conduct their own research before making any trading decisions.
Sellersbuyers

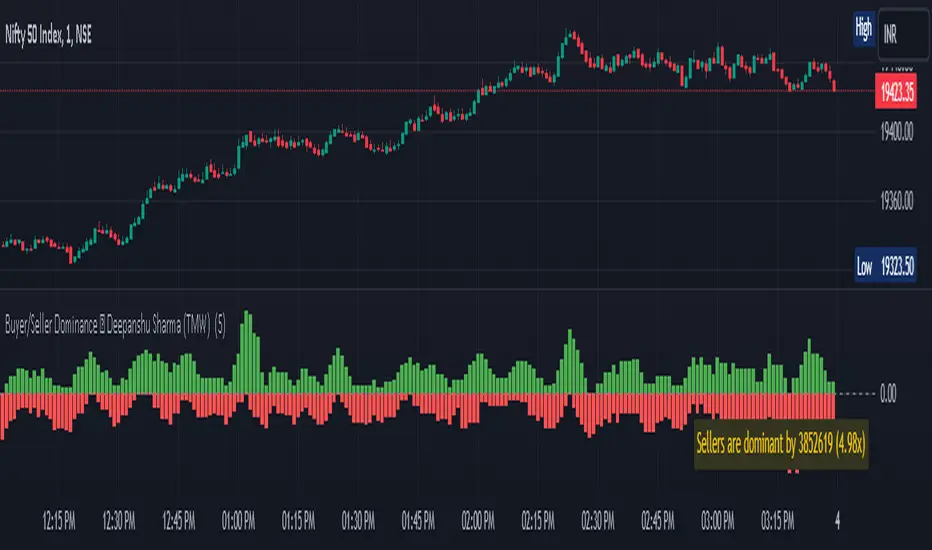
Buyer/Seller Dominance ©TMW
The "Buyer/Seller Dominance" indicator script, developed by Deepanshu Sharma under The Market Wisdom (TMW), is a powerful analytical tool designed for use on the TradingView platform. This script is released under the Mozilla Public License 2.0, and it offers traders and investors an innovative perspective on market dynamics by assessing the relative strength of buyers and sellers within a given time frame.
Key Features:
1. Dominance Calculation: The indicator calculates the dominance of buyers and sellers over a specified number of candles. Users can define the number of candles (`n`) to consider in the dominance calculation.
2. Visual Representation: The script provides a visual representation of buyer and seller dominance using colored columns on the price chart. Green columns represent buyer dominance, while red columns represent seller dominance.
3. Balance Line: The indicator includes a dashed horizontal line at the zero level, representing a balance point between buyer and seller dominance. When the green and red columns cross this line, it signifies shifts in market sentiment.
How it Works:
The script divides the historical price data into segments of specified candle count (`n`) and assesses each segment's dominance. It calculates the volume associated with both green (bullish) and red (bearish) candles within each segment.
If a candle's closing price is higher than its opening price, it is considered a green candle. Similarly, if the closing price is lower than the opening price, the candle is classified as red. The volume of each respective type of candle is then accumulated for each segment.
The script plots the cumulative green candle volume as the "Buyer Dominance" column and the cumulative red candle volume as the "Seller Dominance" column. This visual representation helps traders gauge the ebb and flow of buyer and seller strength in the market.
Disclaimer :
The indicator is provided for informational purposes only and should not be considered as financial advice. It's important to conduct thorough research and analysis before making any trading decisions. The creator, Deepanshu Sharma, and "The Market Wisdom" team are not responsible for any trading losses incurred based on the usage of this indicator.
Remember that trading involves risks, and historical performance may not necessarily predict future results. Always consider multiple indicators, market trends, and risk management strategies when making trading decisions.