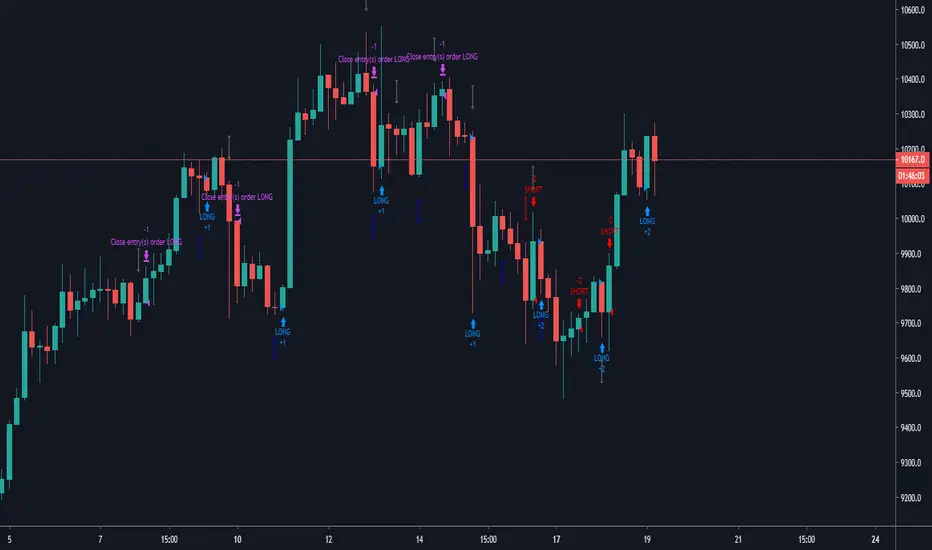
High Freq Buy The Dips Bull Market [Quant Trading]STRATEGY OVERVIEW
This is a significantly enhanced and optimized version of the original "Buy The Dips in Bull Market" strategy from Coinrule (2020). The strategy has been completely rewritten in Pine Script v6 with substantial improvements in performance, risk management, and functionality. Based on extensive analysis of 2+ years of BTC hourly data, this optimized version delivers 312.6% better returns with a 74.8% win rate compared to the original implementation.
Key Philosophy: The strategy capitalizes on temporary price dips during bull market conditions by entering long positions when RSI indicates oversold conditions while maintaining a bullish market structure, then exiting when price recovers above key moving averages.
HOW IT WORKS
Entry Logic
The strategy enters long positions when ALL of the following conditions are met:
RSI Oversold Condition: RSI drops below the configurable threshold (default: 45)
Bull Market Structure: Long-term MA (150) is below the slow MA (40), indicating overall bullish momentum
Within Date Range: Trade occurs within the specified backtesting period
Exit Logic
Positions are closed when BOTH conditions are satisfied:
Price Recovery: Current price moves above the fast MA (15-period)
MA Alignment: Fast MA crosses above slow MA, confirming trend continuation
Optional Short Trading
When enabled, the strategy can also trade short positions using inverse logic:
Short Entry: RSI overbought (above 55 by default) + bearish market structure
Short Exit: Price decline below fast MA + bearish MA alignment
KEY IMPROVEMENTS OVER ORIGINAL
1. Enhanced Risk Management
ATR-Based Stop Loss/Take Profit: Dynamic risk levels based on market volatility
Configurable Risk-Reward Ratio: Default 2:1 ratio with full customization
Alternative Percentage-Based Risk: Option to use fixed percentage stops instead of ATR
2. Optimized Parameters
RSI Period: Increased to 14 (from original) for more reliable signals
RSI Buy Signal: Optimized to 45 (from 35) reducing false signals
Fast MA: Shortened to 15 periods (from 9) for quicker response
Slow MA: Reduced to 40 periods (from 50) for improved trend detection
Long MA: Reduced to 150 periods (from 200) for better bull market identification
3. Advanced Features
Bi-directional Trading: Optional short selling capability
Comprehensive Visualization: Enhanced plotting with risk level displays
Flexible Date Range: Improved backtesting controls with visual indicators
Modern Pine Script v6: Complete rewrite using latest Pine Script features
DEFAULT PARAMETERS EXPLAINED
RSI Settings
RSI Period: 14 bars - Standard period providing balanced sensitivity
RSI Buy Signal: 45 - Optimized threshold for bull market dip buying
Moving Average Settings
Fast MA Length: 15 - Quick-response average for exit signals
Slow MA Length: 40 - Medium-term trend confirmation
Long MA Length: 150 - Long-term bull market structure identification
Risk Management (ATR-Based)
ATR Period: 14 - Standard volatility measurement period
ATR Stop Loss Multiplier: 2.0 - Conservative stop loss distance
Risk Reward Ratio: 2.0 - Take profit at 2x the risk amount
Alternative Risk Management (Percentage-Based)
Stop Loss: 5% - Fixed percentage stop loss
Take Profit: 10% - Fixed percentage take profit target
Trading Configuration
Initial Capital: $1,000
Position Size: 100% of equity per trade
Commission: 0.1% per trade
Slippage: 3 ticks
STRATEGY PERFORMANCE CHARACTERISTICS
Strengths
High Win Rate: 74.8% successful trades based on optimization analysis
Bull Market Focused: Designed specifically for uptrending market conditions
Volatility Adaptive: ATR-based risk management adjusts to market conditions
False Signal Reduction: Optimized parameters minimize whipsaws
Considerations
Bull Market Dependency: Performance may decline in prolonged bear markets
Trend Following Nature: May experience drawdowns during strong trend reversals
High Frequency: Generates multiple signals requiring active monitoring
RISK WARNINGS
Past performance does not guarantee future results. This strategy is optimized for bull market conditions and performance may vary significantly in different market environments. Always use appropriate position sizing and risk management. Real trading results may differ due to execution costs, slippage, and market conditions.
RECOMMENDED USAGE
Optimal Market Conditions
Bull market or strong uptrending conditions
Medium to high volatility environments
Markets with clear trend structure
Timeframes
Optimized for hourly charts
Can be adapted for other timeframes with parameter adjustment
Asset Classes
Originally optimized for Bitcoin
Suitable for other trending cryptocurrencies and traditional assets
Test parameters on specific assets before live implementation
TECHNICAL REQUIREMENTS
Pine Script Version: v6
Strategy Type: Long/Short (configurable)
Overlay: Yes - plots directly on price chart
Real-time Alerts: Compatible with TradingView alert system
This strategy represents a substantial evolution of the original concept, incorporating modern risk management techniques, optimized parameters based on extensive backtesting, and enhanced functionality while maintaining the core "buy the dips" philosophy that made the original strategy popular.
SLOW

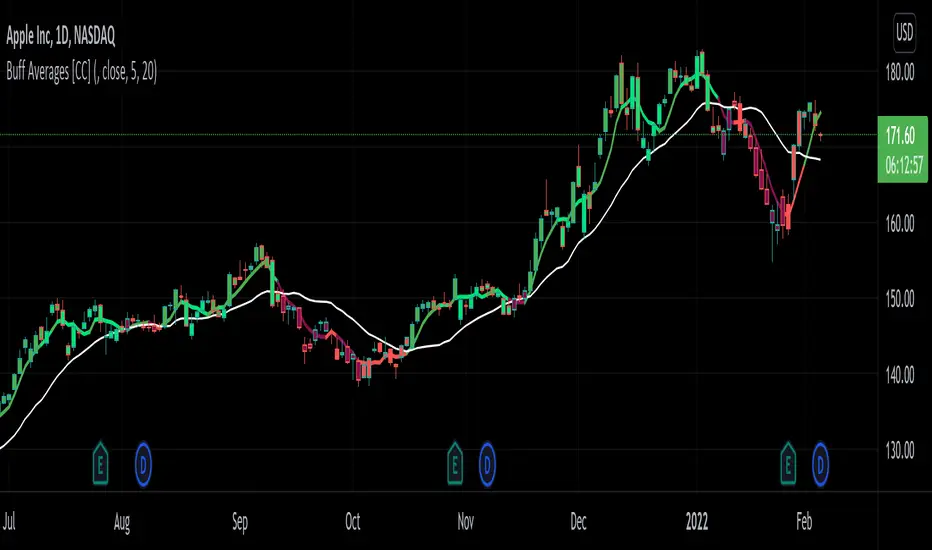
Buff Averages [CC]The Buff Averages were created by Buff Dormeier (Stocks and Commodities Feb 2001) and this is another hidden gem that is a combo of a volume weighted indicator and a moving average crossover system. It uses a special method to calculate the weighting based on volume. The colored line (fast buff) will follow the price closely and you use the other line to act as a trend confirmation. I have included strong buy and sell signals in addition to normal ones so strong signals are darker in color and normal signals are lighter in color. Buy when the line turns green and sell when it turns red.
Let me know if there are any other indicators or scripts you would like to see me publish!
RSI Cross [xaurr]This is simple but profitable rsi cross strategy, to find optimal values you can change rsi and ema periods.
Good Luck!

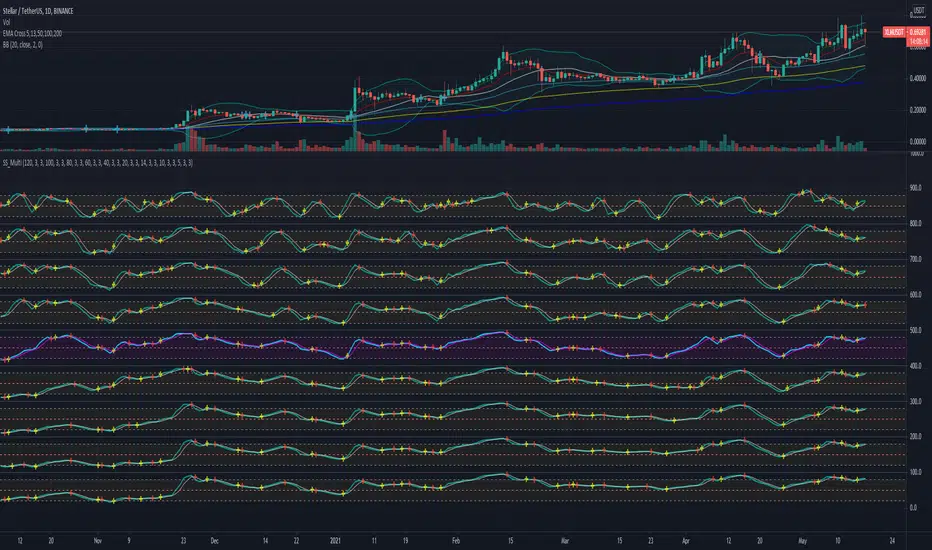
Slow Stochastic MultiFrame - AFPThis script enables you to use 9 slow stochastic with timeframe 5, 10, 14, 20, 40, 60, 80, 100, 120; on purposes to see from longterm and short term condition of a stock.
Doble stochastic oscillator fast and slowThis is a two stochastic in one indicator :
We have a normal stochastic, and a slower one in order to identify changes in the price movement.
At the same time I added more levels, so its easier visually to identify in each scenario we are.
The slower oscillator, also change color based on direction it has.
Green color = long direction - > buy
Red color = short direction - > sell

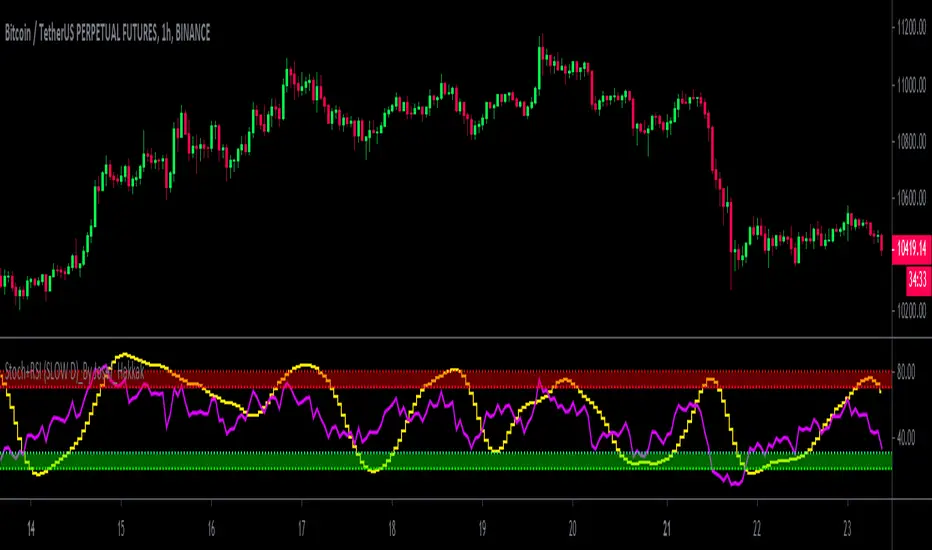
Stoch+RSI (SLOW D)_By Josef_HakkakStoch+RSI (SLOW D)_By Josef_Hakkak
Stochastic and RSI by SLOW D%
-> How to use:
B UY = When the yellow line (D of Slow Stoch ) goes out of the green range, it is better that the purple line ( RSI ) is be low
SELL = When the yellow line (D of Slow Stoch ) goes out of the red range, it is better to have the purple line ( RSI ) is be high
This script was previously written by RRanjanFX and has now been edited by me and changes have been made to optimize for shorter timeframes.
Edited and updated and optimized from:
RRanjanFX
Many thanks and loyal to RRanjanFX
Slow Heiken Ashi and Exponential Moving average Strategy 2.2Strategy using Slow Heiken Ashi by Glaz and Exponential moving averages. Looking for someone to help me turn the strategy into non-reoccuring alerts as I am having trouble doing so.
PtahX's Slow Stochastic with AlertsPtahX Slow Stochastic
converted to Pinescript Version 4
initial code thanks to Oshri17 !!
PtahX Version
converted to version 4
modified color scheme
Upper and lower band crossing alerts added (Entrance & Exit)
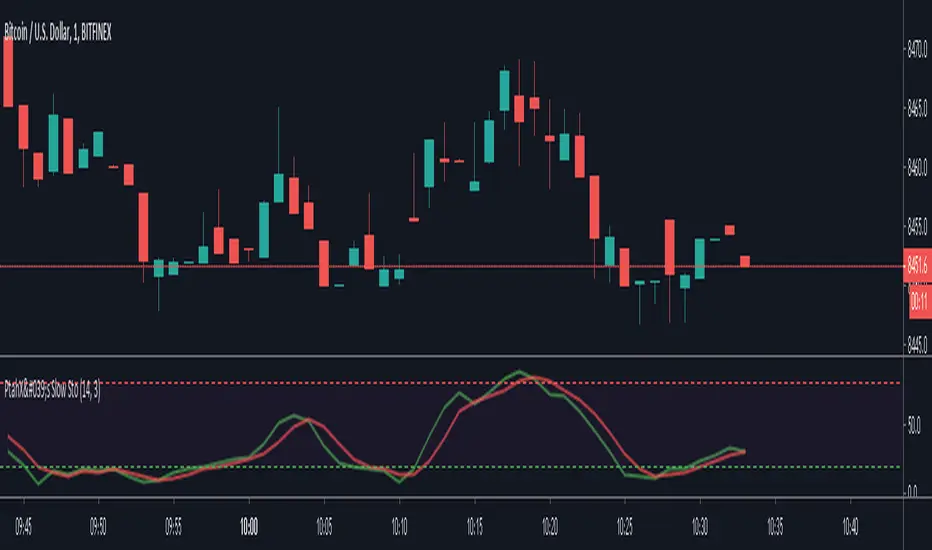
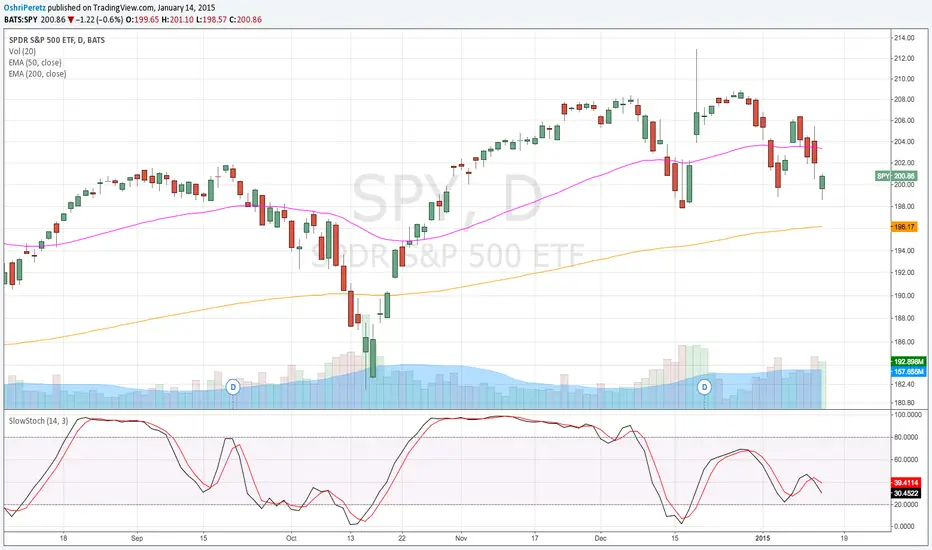
Slow StochasticThe slow stochastic indicator is a price oscillator that compares a security’s closing price over “n” range. The most commonly used range for the slow stochastic indicator is 14.
Defaults K=14, D=3