S&P 500 E-Mini TrackerThis script generates a reference price for the S&P 500 ETF - SPY based on the current price of the ES contract, which is an E-Mini Futures contract representing the S&P 500 index. The indicator plots this reference price on the chart, providing a unique view of the relationship between these two popular markets.
Advantages:
Identifies divergence between the ES and SPY prices, indicating potential trading opportunities or shifts in market sentiment.
Confirms trends by showing the correlation between the ES and SPY prices.
Eliminates the need for multiple charts, allowing traders to focus on a single screen and make more informed decisions.
Customizable Parameters:
Color Scheme: Choose from various color options to customize the appearance of the indicator.
Line Style: Select from different line styles to change the visual representation of the reference price.
Divisor: Set the dividing factor to adjust the ratio at which the reference price is calculated. (Default value: 10). It is recommended to keep it at 10 for SPY.
To use it with other Stocks/ ETFs, use simple ratio math to calculate the divisor and you can customize the indicator to scale accordingly.
By using this indicator, traders can gain a deeper understanding of the relationship between the E-Mini and SPY markets, making it easier to identify trading opportunities and confirm trends.
SPDR S&P 500 ETF (SPY)

Options Betting Range - Extended# Options Betting Range - Extended
**Options Betting Range - Extended** is a versatile TradingView indicator designed to assist traders in identifying and visualizing optimal options trading ranges for multiple symbols. By leveraging predefined prediction and execution dates along with specific high and low price points, this indicator dynamically draws trendlines to highlight potential options betting zones, enhancing your trading strategy and decision-making process.
## **Key Features**
- **Multi-Symbol Support:** Automatically adapts to popular symbols such as SPY, IWM, QQQ, DIA, TLT, and GOOG, providing tailored options betting ranges for each.
- **Dynamic Trendlines:** Draws both dashed and solid trendlines based on user-defined prediction and execution dates, clearly marking high and low price boundaries.
- **Customizable Parameters:** Easily configure prediction and execution dates, high and low prices, and timezones to suit your specific trading requirements.
- **Single Execution:** Ensures that each trendline is drawn only once per specified prediction date, preventing clutter and maintaining chart clarity.
- **Clear Visual Indicators:** Utilizes color-coded labels to denote high (green) and low (red) price points, making it easy to identify critical trading levels at a glance.
## **How It Works**
1. **Initialization:**
- Upon adding the indicator to your chart, it initializes with predefined symbols and their corresponding high and low price points for two trendlines each.
2. **Configuration:**
- **Trendline 1:**
- **Prediction Date:** Set the year, month, and day when the trendline should be predicted.
- **Execution Date:** Define the year, month, and day when the trendline will be executed.
- **Timezone:** Choose the appropriate timezone to ensure accurate date matching.
- **Trendline 2:**
- Similarly, configure the prediction and execution dates along with the timezone.
3. **Trendline Drawing:**
- On reaching the specified prediction date, the indicator draws dashed trendlines representing the high and low price ranges.
- Solid trendlines are then drawn to solidify the high and low price boundaries.
- Labels are added to clearly mark the high and low price points on the chart.
4. **Visualization:**
- The trendlines and labels provide a visual framework for potential options trading ranges, allowing traders to make informed decisions based on these predefined levels.
## **How to Use**
1. **Add the Indicator:**
- Open your TradingView chart and apply the **Options Betting Range - Extended** indicator.
2. **Select a Symbol:**
- Ensure that the chart is set to one of the supported symbols (e.g., SPY, IWM, QQQ, DIA, TLT, GOOG) to activate the corresponding trendline configurations.
3. **Configure Trendline Parameters:**
- Access the indicator settings to input your desired prediction and execution dates, high and low prices, and select the appropriate timezone for each trendline.
4. **Monitor Trendlines:**
- As the chart progresses to the specified prediction dates, observe the dynamically drawn trendlines and labels indicating the options betting ranges.
5. **Make Informed Trades:**
- Utilize the visual cues provided by the trendlines to identify optimal entry and exit points for your options trading strategies.
## **Benefits**
- **Enhanced Strategy Visualization:** Clearly outlines potential trading ranges, aiding in the formulation and execution of precise options strategies.
- **Time-Saving Automation:** Automatically draws trendlines based on your configurations, reducing the need for manual chart analysis.
- **Improved Decision-Making:** Provides objective price levels for trading, minimizing emotional bias and enhancing analytical precision.
## **Important Considerations**
- **Timezone Accuracy:** Ensure that the timezones selected in the indicator settings align with your chart's timezone to maintain accurate date matching.
- **Chart Timeframe:** The prediction dates should correspond to the timeframe of your chart (e.g., daily, hourly) to ensure that trendlines are triggered correctly.
- **Visible Price Range:** Verify that the high and low prices set for trendlines are within the visible range of your chart to ensure that all trendlines and labels are clearly visible.
## **Conclusion**
**Options Betting Range - Extended** is a powerful tool for traders seeking to automate and visualize their options trading ranges across multiple symbols. By providing clear, customizable trendlines based on specific prediction and execution dates, this indicator enhances your ability to identify and act upon strategic trading opportunities with confidence.
---

S&P 500 Sector StrengthsThe "S&P 500 Sector Strengths" indicator is a sophisticated tool designed to provide traders and investors with a comprehensive view of the relative performance of various sectors within the S&P 500 index. This indicator utilizes the True Strength Index (TSI) to measure and compare the strength of different sectors, offering valuable insights into market trends and sector rotations.
At its core, the indicator calculates the TSI for each sector using price data obtained through the request.security() function. The TSI, a momentum oscillator, is computed using a user-defined smoothing period, allowing for customization based on individual preferences and trading styles. The resulting TSI values for each sector are then plotted on the chart, creating a visual representation of sector strengths.
To use this indicator effectively, traders should focus on comparing the movements of different sector lines. Sectors with lines moving higher are showing increasing strength, while those with descending lines are exhibiting weakness. This comparative analysis can help identify potential investment opportunities and sector rotations. Additionally, when multiple sector lines move in tandem, it may signal a broader market trend.
The indicator includes dashed lines at 0.5 and -0.5, serving as reference points for overbought and oversold conditions. Sectors with TSI values above 0.5 might be considered overbought, suggesting caution, while those below -0.5 could be viewed as oversold, potentially indicating buying opportunities.
One of the key advantages of this indicator is its flexibility. Users can toggle the visibility of individual sectors and customize their colors, allowing for a tailored analysis experience. This feature is particularly useful when focusing on specific sectors or reducing chart clutter for clearer visualization.
The indicator's ability to provide a comprehensive overview of all major S&P 500 sectors in a single chart is a significant benefit. This consolidated view enables quick comparisons and helps in identifying relative strengths and weaknesses across sectors. Such insights can be invaluable for portfolio allocation decisions and in spotting emerging market trends.
Moreover, the dynamic legend feature enhances the indicator's usability. It automatically updates to display only the visible sectors, improving chart readability and interpretation.
By leveraging this indicator, market participants can gain a deeper understanding of sector dynamics within the S&P 500. This enhanced perspective can lead to more informed decision-making in sector allocation strategies and individual stock selection. The indicator's ability to potentially detect early trends by comparing sector strengths adds another layer of value, allowing users to position themselves ahead of broader market movements.
In conclusion, the "S&P 500 Sector Strengths" indicator is a powerful tool that combines technical analysis with sector comparison. Its user-friendly interface, customizable features, and comprehensive sector coverage make it an valuable asset for traders and investors seeking to navigate the complexities of the S&P 500 market with greater confidence and insight.

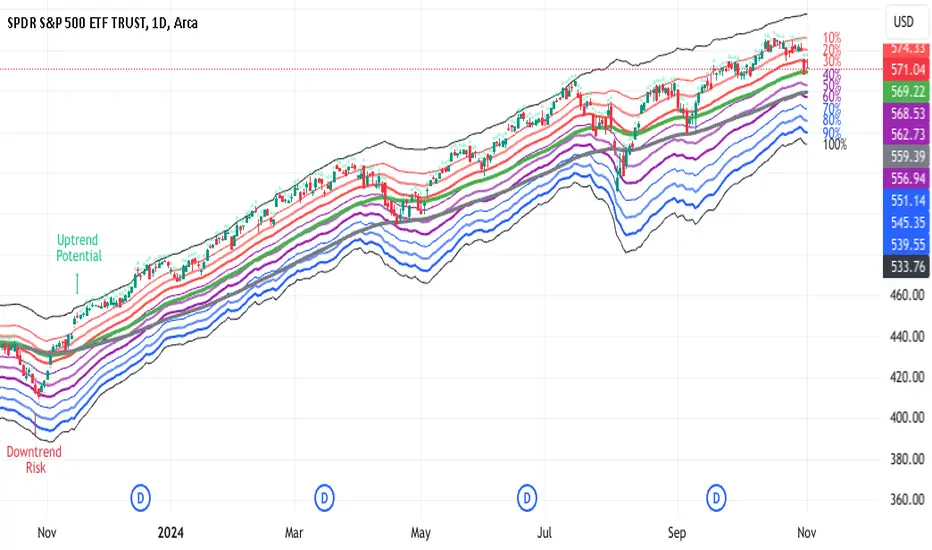
Daily BreadWhat it does:
This script uses specific multiple true ranges from a 30 EMA baseline to plot lines that represent 10% buying increments. Although the common period for ATR is 14, this script employs a period of 20 for smoothing that I have determined is more effective when used with a daily candle chart. It includes onscreen trend signals to identify an uptrend or downtrend when the 50 EMA crosses the 90 EMA and will also display a coloured directional signal at each candle beyond an EMA cross to identify the current trend.
The script plots a scale of percentage labels at the end of each line to identify the percent of an account intended to be in short or longer term trades.
How it does it:
The script uses a 30 EMA baseline and then multiplies ATR increments of +1, +2, +4 and -1 through -7. These ATR multiples and the EMA are plotted as 11 lines, 10 of which make up the range of 10% increments from 10% to 100% with the 11th line being the High Band representing the extreme high or expected sale of any holdings. The percentage label scale uses variable declarations to position and colour match a percentage label to each line.
Intended use:
It is intended to be used for short term trading or long term investing with a daily market index chart such as SPY and multiple exchange traded funds that track said market index. A different ETF is purchased when a daily SPY candle reaches a lower buy band using 10% of a total account value. The sale of any ETFs is at the discretion of the trader and dependent on investment strategy (short term trading or long term inventing) and the trend. When short term trading in a downtrend or when daily candles are below the 50 EMA, selling would be done every 2 to 3 bands above a buy to mitigate the risk of a significant portion of an account getting caught in a downtrend. In an uptrend the High Band would be used to sell any holdings.
Unlock the Power of Seasonality: Monthly Performance StrategyThe Monthly Performance Strategy leverages the power of seasonality—those cyclical patterns that emerge in financial markets at specific times of the year. From tax deadlines to industry-specific events and global holidays, historical data shows that certain months can offer strong opportunities for trading. This strategy was designed to help traders capture those opportunities and take advantage of recurring market patterns through an automated and highly customizable approach.
The Inspiration Behind the Strategy:
This strategy began with the idea that market performance is often influenced by seasonal factors. Historically, certain months outperform others due to a variety of reasons, like earnings reports, holiday shopping, or fiscal year-end events. By identifying these periods, traders can better time their market entries and exits, giving them an advantage over those who solely rely on technical indicators or news events.
The Monthly Performance Strategy was built to take this concept and automate it. Instead of manually analyzing market data for each month, this strategy enables you to select which months you want to focus on and then executes trades based on predefined rules, saving you time and optimizing the performance of your trades.
Key Features:
Customizable Month Selection: The strategy allows traders to choose specific months to test or trade on. You can select any combination of months—for example, January, July, and December—to focus on based on historical trends. Whether you’re targeting the historically strong months like December (often driven by the 'Santa Rally') or analyzing quieter months for low volatility trades, this strategy gives you full control.
Automated Monthly Entries and Exits: The strategy automatically enters a long position on the first day of your selected month(s) and exits the trade at the beginning of the next month. This makes it perfect for traders who want to benefit from seasonal patterns without manually monitoring the market. It ensures precision in entering and exiting trades based on pre-set timeframes.
Re-entry on Stop Loss or Take Profit: One of the standout features of this strategy is its ability to re-enter a trade if a position hits the stop loss (SL) or take profit (TP) level during the selected month. If your trade reaches either a SL or TP before the month ends, the strategy will automatically re-enter a new trade the next trading day. This feature ensures that you capture multiple trading opportunities within the same month, instead of exiting entirely after a successful or unsuccessful trade. Essentially, it keeps your capital working for you throughout the entire month, not just when conditions align perfectly at the beginning.
Built-in Risk Management: Risk management is a vital part of this strategy. It incorporates an Average True Range (ATR)-based stop loss and take profit system. The ATR helps set dynamic levels based on the market’s volatility, ensuring that your stops and targets adjust to changing market conditions. This not only helps limit potential losses but also maximizes profit potential by adapting to market behavior.
Historical Performance Testing: You can backtest this strategy on any period by setting the start year. This allows traders to analyze past market data and optimize their strategy based on historical performance. You can fine-tune which months to trade based on years of data, helping you identify trends and patterns that provide the best trading results.
Versatility Across Asset Classes: While this strategy can be particularly effective for stock market indices and sector rotation, it’s versatile enough to apply to other asset classes like forex, commodities, and even cryptocurrencies. Each asset class may exhibit different seasonal behaviors, allowing you to explore opportunities across various markets with this strategy.
How It Works:
The trader selects which months to test or trade, for example, January, April, and October.
The strategy will automatically open a long position on the first trading day of each selected month.
If the trade hits either the take profit or stop loss within the month, the strategy will close the current position and re-enter a new trade on the next trading day, provided the month has not yet ended. This ensures that the strategy continues to capture any potential gains throughout the month, rather than stopping after one successful trade.
At the start of the next month, the position is closed, and if the next month is also selected, a new trade is initiated following the same process.
Risk Management and Dynamic Adjustments:
Incorporating risk management with this strategy is as easy as turning on the ATR-based system. The strategy will automatically calculate stop loss and take profit levels based on the market’s current volatility, adjusting dynamically to the conditions. This ensures that the risk is controlled while allowing for flexibility in capturing profits during both high and low volatility periods.
Maximizing the Seasonal Edge:
By automating entries and exits based on specific months and combining that with dynamic risk management, the Ultimate Monthly Performance Strategy takes advantage of seasonal patterns without requiring constant monitoring. The added re-entry feature after hitting a stop loss or take profit ensures that you are always in the game, maximizing your chances to capture profitable trades during favorable seasonal periods.
Who Can Benefit from This Strategy?
This strategy is perfect for traders who:
Want to exploit the predictable, recurring patterns that occur during specific months of the year.
Prefer a hands-off, automated trading approach that allows them to focus on other aspects of their portfolio or life.
Seek to manage risk effectively with ATR-based stop losses and take profits that adjust to market conditions.
Appreciate the ability to re-enter trades when a take profit or stop loss is hit within the month, ensuring that they don't miss out on multiple opportunities during a favorable period.
In summary, the Ultimate Monthly Performance Strategy provides traders with a comprehensive tool to capitalize on seasonal trends, optimize their trading opportunities throughout the year, and manage risk effectively. The built-in re-entry system ensures you continue to benefit from the market even after hitting targets within the same month, making it a robust strategy for traders looking to maximize their edge in any market.
Risk Disclaimer:
Trading financial markets involves significant risk and may not be suitable for all investors. The Monthly Performance Strategy is designed to help traders identify seasonal trends, but past performance does not guarantee future results. It is important to carefully consider your risk tolerance, financial situation, and trading goals before using any strategy. Always use appropriate risk management and consult with a professional financial advisor if necessary. The use of this strategy does not eliminate the risk of losses, and traders should be prepared for the possibility of losing their entire investment. Be sure to test the strategy on a demo account before applying it in live markets.

QQQ and SPY Price Levels [MW]Introduction:
Don’t let SPY and QQQ resistance levels hurt your futures trading anymore. The QQQ and SPY Price Levels indicator automagically provides easily accessible QQQ price levels for NASDAQ-related charts such as QQQ, /NQ and /MNQ futures, and leveraged ETFs such as TQQQ and SQQQ as well as for SPY price levels for S&P 500-related charts such as SPY, /ES and /MES futures, SPX, and leveraged ETFs such as UPRO and SPXU. If you’ve ever traded futures, or anything QQQ- or SPY-related and wanted to know at what price would the corresponding asset reach a key whole number level of QQQ or SPY, like 400, 440, 445, or even 447.50, this tool is for you. Key 10x, 5x, and even 2.5x multiples of QQQ and SPY can act as support or resistance for other related-assets. Until now, there hasn’t been an indicator that can serve as an easy visual cue to know exactly when that is about to happen across assets.
This indicator is a fork of the original SPY Price Levels indicator, which only considered SPY-related assets.
Settings:
QQQ/SPY 2.5x: Show closest levels above and below that are multiples of 2.5 on QQQ
QQQ/SPY 5x: Show closest levels above and below that are multiples of 5 on QQQ
QQQ/SPY 10x: Show closest levels above and below that are multiples of 10 on QQQ
Show QQQ/SPY Price Label: Show the current QQQ/SPY price
Extend lines to the left: Extend label lines for each price level to the beginning of the chart
Calculations:
This indicator defines the ratio between the price of QQQ/SPY and another NASDAQ/S&P-related asset and uses that multiplier once the user-defined price increments are defined. For example, if /MNQ is at 19000 and QQQ is at 465, then the ratio would be 40.8.
The incremental QQQ levels that are above and below the QQQ price are calculated using the following equations:
qqqLevelUp = _multiplier * math.ceil(_qqqClose / _multiplier)
qqqLevelDown = _multiplier * math.floor(_qqqClose / _multiplier)
The conversion ratio is then multiplied by that amount to get the final estimated corresponding price using the calculation:
levelUp := _conversion * qqqLevelUp
levelDown := _conversion * qqqLevelDown
For leveraged assets, the conversion must be used on the difference between the current QQQ price and the incremental upper and lower levels.
For example, the calculation for the next level up looks like the following:
levelUpDelta := math.abs(_qqqClose - qqqLevelUp)
levelUp := close + _conversion * (levelUpDelta * _leverage)
This logic is identical for SPY-related assets.
How to Use:
The QQQ and SPY Price Levels indicator aims to be as unobtrusive as possible. The default view shows 3 labels and 2 lines that are all aligned to the right of the main chart, so that it interferes as little as possible with any other indicators. It can be added to any /NQ or /MNQ futures chart, SQQQ, TQQQ, and, of course, QQQ as well as any /ES /MES futures chart, SPXU, UPRO, SPX, and of course SPY. The most immediate price levels for each multiplier appears above and below the current price along with the price of QQQ/SPY.
For example, MNQU2024 is currently at 19594. By looking at the indicator the next QQQ increment below is at 475, or 19556 on the MNQU2024 chart. This potential support is marked with a green label that shows both prices. The next increment above is at QQQ 477.50, or 19659 on the MESU2024 chart. And the QQQ price itself, is also shown (and can be removed) at 475.92.
QQQ and SPY price increments of 2.5, 5, and 10 tend to consistently act at the very least as emotional support and resistance levels. Weak, or weakening volume and/or momentum when these levels are hit can trigger a strong rejection, and can sometimes precipitate lengthy consolidation periods at those levels. Watching an NASDAQ- and S&P 500-related asset come to a halt, fall off a cliff, or react in some other unintuitive way could very well be the result of a QQQ/SPY level being reached. Even though many of us know that this relationship exists, it’s easy to forget. So, this indicator helps to ensure that its users keep that relationship front and center.
By extending the lines into the past on QQQ/SPY and their related assets, you can see what reactions happened at these key levels.
Other Usage Notes and Limitations:
The calculations used only provide an estimated relationship or a close approximation, and are not exact.
It's important for traders to be aware of the limitations of any indicator and to use them as part of a broader, well-rounded trading strategy that includes risk management, fundamental analysis, and other tools that can help with reducing false signals, determining trend direction, and providing additional confirmation for a trade decision. Diversifying strategies and not relying solely on one type of indicator or analysis can help mitigate some of these risks.

SP500 RatiosThe "SP500 Ratios" indicator is a powerful tool developed for the TradingView platform, allowing users to access a variety of financial ratios and inflation-adjusted data related to the S&P 500 index. This indicator integrates with Nasdaq Data Link (formerly known as Quandl) to retrieve historical data, providing a comprehensive overview of key financial metrics associated with the S&P 500.
Key Features
Price to Sales Ratio: Quarterly ratio of price to sales (revenue) for the S&P 500.
Dividend Yield: Monthly dividend yield based on 12-month dividend per share.
Price Earnings Ratio (PE Ratio): Monthly price-to-earnings ratio based on trailing twelve-month reported earnings.
CAPE Ratio (Shiller PE Ratio): Monthly cyclically adjusted PE ratio, based on average inflation-adjusted earnings over the past ten years.
Earnings Yield: Monthly earnings yield, the inverse of the PE ratio.
Price to Book Ratio: Quarterly ratio of price to book value.
Inflation Adjusted S&P 500: Monthly S&P 500 level adjusted for inflation.
Revenue Per Share: Quarterly trailing twelve-month sales per share, not adjusted for inflation.
Earnings Per Share: Monthly real earnings per share, adjusted for inflation.
User Configuration
The indicator offers flexibility through user-configurable options. You can choose to display or hide each metric according to your analysis needs. Users can also adjust the line width for better visibility on the chart.
Visualization
The selected data is plotted on the chart with distinct colors for each metric, facilitating visual analysis. A dynamic legend table is also generated in the top-right corner of the chart, listing the currently displayed metrics with their associated colors.
This indicator is ideal for traders and analysts seeking detailed insights into the financial performance and valuations of the S&P 500, while benefiting from the customization flexibility offered by TradingView.

Relative Strength (Volatility Adjusted)The volatility adjusted relative strength indicator offers a more precise approach to traditional RS indicators by incorporating volatility adjustments into its calculations. This will provide traders with a more nuanced view of relative performance between a selected instrument and a comparison index.
Identifying Relative Strength (RS) and Weakness (RW) against a benchmark like the SPY is crucial for traders, as it highlights institutional activity in an equity, which retail traders rarely achieve on their own. However, the traditional method of simply comparing the rate of change of a stock to the rate of change for the SPY can be flawed. This method often fails to account for the inherent volatility of each stock, leading to misleading RS/RW readings.
Consider two stocks that both move in response to SPY's movements. If SPY moves significantly more than its average (measured by its ATR), and the stock does the same, traditional RS calculations might show strength when, in fact, the stock is just mirroring SPY's increased volatility. For instance, if SPY typically moves $0.25 an hour but suddenly moves $1, and a stock typically moves $0.50 but moves $2, the stock's apparent RS might be overstated, when in reality there is no relative strength for the stock.
By adjusting for volatility using the ATR (Average True Range), we normalize these movements and get a clearer picture of true RS/RW. For example, if SPY moves 5 times its average rate and a stock moves the same multiple of its own ATR, the RS should be considered neutral rather than strong. Similarly if a stock in absolute terms moves $1 while the SPY also moves $1 but the stock usually moves at twice the rate of the SPY, the stock should be considered relatively weak - not neutral.
Usage
Use this to identify stocks with actual strength or weakness compared to the market.
When the RS line is above 0 and above the moving average it indicates a stock with relative strength that is still gaining more strength.
When the RS line is above 0 but above the moving average it indicates a stock with relative strength that is currently losing strength.
When the RS line is below 0 and below the moving average it indicates a stock with relative weakness that is still losing strength.
When the RS line is below 0 but above the moving average it indicates a stock with relative weakness that is starting to gain back some strength.

S&P Short-Range Oscillator**SHOULD BE USED ON THE S&P 500 ONLY**
The S&P Short-Range Oscillator (SRO), inspired by the principles of Jim Cramer's oscillator, is a technical analysis tool designed to help traders identify potential buy and sell signals in the stock market, specifically for the S&P 500 index. The SRO combines several market indicators to provide a normalized measure of market sentiment, assisting traders in making informed decisions.
The SRO utilizes two simple moving averages (SMAs) of different lengths: a 5-day SMA and a 10-day SMA. It also incorporates the daily price change and market breadth (the net change of closing prices). The 5-day and 10-day SMAs are calculated based on the closing prices. The daily price change is determined by subtracting the opening price from the closing price. Market breadth is calculated as the difference between the current closing price and the previous closing price.
The raw value of the oscillator, referred to as SRO Raw, is the sum of the daily price change, the 5-day SMA, the 10-day SMA, and the market breadth. This raw value is then normalized using its mean and standard deviation over a 20-day period, ensuring that the oscillator is centered and maintains a consistent scale. Finally, the normalized value is scaled to fit within the range of -15 to 15.
When interpreting the SRO, a value below -5 indicates that the market is potentially oversold, suggesting it might be a good time to start buying stocks as the market could be poised for a rebound. Conversely, a value above 5 suggests that the market is potentially overbought. In this situation, it may be prudent to hold on to existing positions or consider selling if you have substantial gains.
The SRO is visually represented as a blue line on a chart, making it easy to track its movements. Red and green horizontal lines mark the overbought (5) and oversold (-5) levels, respectively. Additionally, the background color changes to light red when the oscillator is overbought and light green when it is oversold, providing a clear visual cue.
By incorporating the S&P Short-Range Oscillator into your trading strategy, you can gain valuable insights into market conditions and make more informed decisions about when to buy, sell, or hold your stocks. However, always consider other market factors and perform your own analysis before making any trading decisions.
The S&P Short-Range Oscillator is a powerful tool for traders looking to gain insights into market sentiment. It provides clear buy and sell signals through its combination of multiple indicators and normalization process. However, traders should be aware of its lagging nature and potential complexity, and use it in conjunction with other analysis methods for the best results.
Disclaimer
The S&P Short-Range Oscillator is for informational purposes only and should not be considered financial advice. Trading involves risk, and you should conduct your own research or consult a financial advisor before making investment decisions. The author is not responsible for any losses incurred from using this indicator. Use at your own risk.

ORB Heikin Ashi SPY 5min Correlation StrategyOverview:
The ORB (Opening Range Breakout) strategy combined with Heikin Ashi candles and Relative Volume (RVOL) indicator aims to capitalize on significant price movements that occur shortly after the market opens. This strategy identifies breakouts above or below the opening range, using Heikin Ashi candles for smoother price visualization and RVOL to gauge the strength of the breakout.
Components:
Opening Range Breakout (ORB): The strategy starts by defining the opening range, typically the first few minutes of the trading session. It then identifies breakouts above the high or below the low of this range as potential entry points.
Heikin Ashi Candles: Heikin Ashi candles are used to provide a smoother representation of price movements compared to traditional candlesticks. By averaging open, close, high, and low prices of the previous candle, Heikin Ashi candles reduce noise and highlight trends more effectively.
Relative Volume (RVOL): RVOL compares the current volume of a stock to its average volume over a specified period. It helps traders identify abnormal trading activity, which can signal potential price movements.
Candle for correlation : In this case we are using SPY candles. It can also use different asset
Strategy Execution:
Initialization: The strategy initializes by setting up variables and parameters, including the ORB period, session timings, and Heikin Ashi candle settings.
ORB Calculation: It calculates the opening range by identifying the high and low prices during the specified session time. These values serve as the initial reference points for potential breakouts. For this we are looking for the first 30 min of the US opening session.
After that we are going to use the next 2 hours to check for breakout opportunities.
Heikin Ashi Transformation: Optionally, the strategy transforms traditional candlestick data into Heikin Ashi format for smoother visualization and trend identification.
Breakout Identification: It continuously monitors price movements within the session and checks if the current high breaches the ORB high or if the current low breaches the ORB low. These events trigger potential long or short entry signals, respectively.
RVOL Analysis: Simultaneously, the strategy evaluates the relative volume of the asset to gauge the strength of the breakout. A surge in volume accompanying the breakout confirms the validity of the signal. In this case we are looking for at least a 1 value of the division between currentVolume and pastVolume
Entry and Exit Conditions: When a breakout occurs and is confirmed by RVOL and is within our session time, the strategy enters a long or short position accordingly. It does not have a stop loss or a takie profit level, instead it will always exit at the end of the trading session, 5 minutes before
Position Sizing and Commissions: For the purpose of this backtest, the strategy allocated 10% of the capital for each trade and assumes a trading commission of 0.01$ per share ( twice the IBKR broker values)
Session End: At the end of the trading session, the strategy closes all open positions to avoid overnight exposure.
Conclusion:
The combination of ORB breakout strategy, Heikin Ashi candles, and RVOL provides traders with a robust framework for identifying and capitalizing on early trends in the market. By leveraging these technical indicators together, traders can make more informed decisions and improve the overall performance of their trading strategies. However, like any trading strategy, it's essential to backtest thoroughly and adapt the strategy to different market conditions to ensure its effectiveness over time.

Market Average TrendThis indicator aims to be complimentary to SPDR Tracker , but I've adjusted the name as I've been able to utilize the "INDEX" data provider to support essentially every US market.
This is a breadth market internal indicator that allows quick review of strength given the 5, 20, 50, 100, 150 and 200 simple moving averages. Each can be toggled to build whatever combinations are desired, I recommend reviewing classic combinations such as 5 & 20 as well as 50 & 200.
It's entirely possible that I've missed some markets that "INDEX" provides data for, if you find any feel free to drop a comment and I'll add support for them in an update.
Markets currently supported:
S&P 100
S&P 500
S&P ENERGIES
S&P INFO TECH
S&P MATERIALS
S&P UTILITIES
S&P FINANCIALS
S&P REAL ESTATE
S&P CON STAPLES
S&P HEALTH CARE
S&P INDUSTRIALS
S&P TELECOM SRVS
S&P CONSUMER DISC
S&P GROWTH
NAS 100
NAS COMP
DOW INDUSTRIAL
DOW COMP
DOW UTILITIES
DOW TRANSPORTATION
RUSSELL 1000
RUSSELL 2000
RUSSELL 3000
You can utilize this to watch stocks for dip buys or potential trend continuation entries, short entries, swing exits or numerous other portfolio management strategies.
If using it with stocks, it's advisable to ensure the stock often follows the index, otherwise obviously it's great to use with major indexes and determine holdings sentiment.
Important!
The "INDEX" data provider only supplies updates to all of the various data feeds at the end of day, I've noticed quite some delays even after market close and not taken time to review their actual update schedule (if even published). Therefore, it's strongly recommended to mostly ignore the last value in the series until it's the day after.
Only works on daily timeframes and above, please don't comment that it's not working if on other timeframes lower than daily :)
Feedback and suggestions are always welcome, enjoy!

VWAP, MFI, RSI with S/R StrategyBest for 0dte/intraday trading on AMEX:SPY with 1 minute chart
Strategy Concept
This strategy aims to identify potential reversal points in a price trend by combining momentum indicators (RSI and MFI), volume-weighted price (VWAP), and recent price action trends. It looks for conditions where the price is poised to change direction, either bouncing off a support level in a potential uptrend or falling from a resistance level in a potential downtrend.
By incorporating both price level analysis (support/resistance) and momentum indicators, the strategy seeks to increase the likelihood of identifying significant trend reversals, taking into consideration both recent price movements and the current price's position relative to historical highs and lows.
VWAP (Volume-Weighted Average Price)
VWAP acts as a benchmark to determine the general market trend. It's an average price weighted by volume.
A price above VWAP is often considered bullish, and a price below VWAP is seen as bearish.
MFI (Money Flow Index) and RSI (Relative Strength Index) Parameters
MFI is a volume-weighted RSI, used to identify overbought (above 70) or oversold (below 30) conditions.
RSI is a momentum indicator that measures the magnitude of recent price changes to identify overbought or oversold conditions, similar to MFI.
The script uses standard overbought (70) and oversold (30) thresholds for both MFI and RSI.
Trend Check Function
The function trendCheck analyzes the past pastBars candles to count how many were bullish (closing price higher than the opening price) and bearish.
This function is used to assess the recent trend direction.
Support and Resistance Detection
The script calculates the highest high (highestHigh) and lowest low (lowestLow) over the last lookbackSR (50) periods to identify potential support and resistance levels.
isNearSupport and isNearResistance are conditions to check if the current price is within 0.08% of these identified levels, indicating proximity to support or resistance.
Buy and Sell Logic
Buy Signal:
The RSI crosses over the oversold threshold (30).
The MFI is also below its oversold level (30).
The current price is above the VWAP.
The recent trend (past 20 bars) has been predominantly bearish.
The price is near the identified support level.
Sell Signal:
The RSI crosses under the overbought threshold (70).
The MFI is above its overbought level (70).
The current price is below the VWAP.
The recent trend has been predominantly bullish.
The price is near the identified resistance level.
Bull Flag DetectionThe FuturesGod bull flag indicator aims to identify the occurrence of bull flags.
Bull flags are a popular trading pattern that allows users to gauge long entries into a given market. Flags consist of a pole that is followed by either a downward or sideways consolidation period.
This script can be used on any market but was intended for futures (NQ, ES) trading on the intraday timeframe.
The script does the following:
1. Identifies the occurrence of a flag pole. This is based on a lookback period and percentage threshold decided by the user.
2. Marks the consolidation area after the pole occurrence using swing highs and swing lows.
3. Visually the above is represented by a shaded green area.
4. When a pole is detected, it is marked by a downward off-white triangle. Note that if the percentage threshold is reached several times on the same upward climb, the script will continue to identify points where the threshold for pole detection is met.
5. Also visualized are the 20, 50 and 200 period exponential moving averages. The area between the 20 and 50 EMAs are shaded to provide traders a visual of a possible support area.

True Range/Expected MoveThis indicator plots the ratio of True Range/Expected Move of SPX. True Range is simple the high-low range of any period. Expected move is the amount that SPX is predicted to increase or decrease from its current price based on the current level of implied volatility. There are several choices of volatility indexes to choose from. The shift in color from red to green is set by default to 1 but can be adjusted in the settings.
Red bars indicate the true range was below the expected move and green bars indicate it was above. Because markets tend to overprice volatility it is expected that there would be more red bars than green. If you sell SPX or SPY option premium red days tend to be successful while green days tend to get stopped out. On a 1D chart it is interesting to look at the clusters of bar colors.

SPDR TrackerMonitor all SPDR Index Funds in one location! The purpose of this indicator is to review which sectors are trend up vs down to better manage risk against SPY, other funds and/or individual stocks.
With this indicator it may become more apparent which sectors to begin investment in that are at lows compared to others, or use it to determine which stocks may be undervalued or overvalued against SPY.
There is a small table at the bottom where each fund symbol is presented along with it's mode value, last period change as well as last period volume - there's a tooltip that shows the description for each symbol for a quick reminder.
Review the configuration pane where:
Individual funds can have their visibility toggled
Change funds colors
Adjust display mode for each fund (SMA, EMA, VWMA, BBW, Change, ATR, VWAP - many more!)
Some presentation modes may look better on some timeframes vs others, adjust lengths and use anchor point for VWAP.
Future updates may bring about new features, I have some code organization and refactoring to do but wanted to share the idea anyways.
Feel free to drop any suggestions for feature enhancement and I hope it brings success to many, enjoy.

[TT] Sectors Dist % From MA- The script shows the distance in percentages from the 200 MA (or any other MA period) , for the 11 SP500 sectors.
- It works based on the current time frames.
Could be useful when working with mean reversion strategies to detect extremes zones and overbought/oversold conditions in the given sectors compared others.

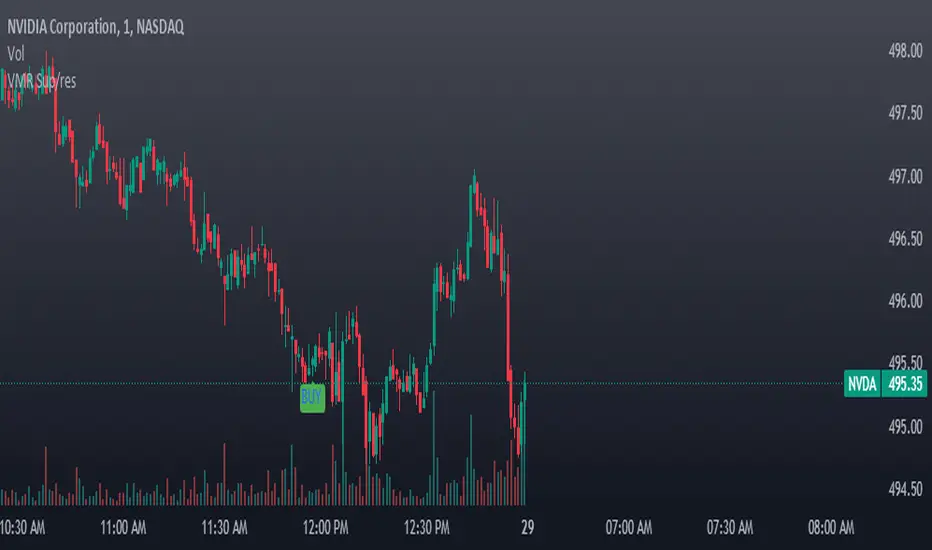
BUY/SELL + ADVANCE DECLINEThis script is a custom trading view indicator that helps to identify potential buy and sell signals based on the RSI (Relative Strength Index) and SMA (Simple Moving Average) indicators. The script also identifies potential reversals using a combination of RSI and price action. It plots buy, sell, and reversal signals on the chart along with an SMA line. Additionally, it provides alerts based on the buy, sell, and reversal conditions.
Changes made to the original script:
Fixed the undeclared identifier 'c' error by calculating the difference between the current closing price and the previous closing price: c = close - close .
Added an "ADD Value Floating Label" to the chart. The label shows the difference between the current and previous closing prices (ADD value) along with a "Bullish" or "Bearish" indicator based on the value of 'c'. The label is positioned at the top right of the visible chart area and remains static.
Here's a summary of the major components of the script:
Input settings: Define the input parameters for RSI and SMA.
Calculation of RSI and SMA: Compute the RSI and SMA values based on the input parameters.
Color definitions: Define colors for different conditions and levels.
Condition definitions: Define various conditions for buy, sell, reversal, and other criteria.
Buy and sell conditions: Determine buy and sell signals based on RSI, SMA, and price action.
Reversal conditions: Identify potential reversals using RSI and price action.
Plot signals: Display buy, sell, and reversal signals on the chart.
Bar colors: Color the bars based on the identified signals.
Plot SMA: Display the SMA line on the chart.
Alert conditions: Set up alerts for buy, sell, and reversal conditions.
ADD Value Floating Label: Add a label to the chart showing the ADD value and a "Bullish" or "Bearish" indicator.

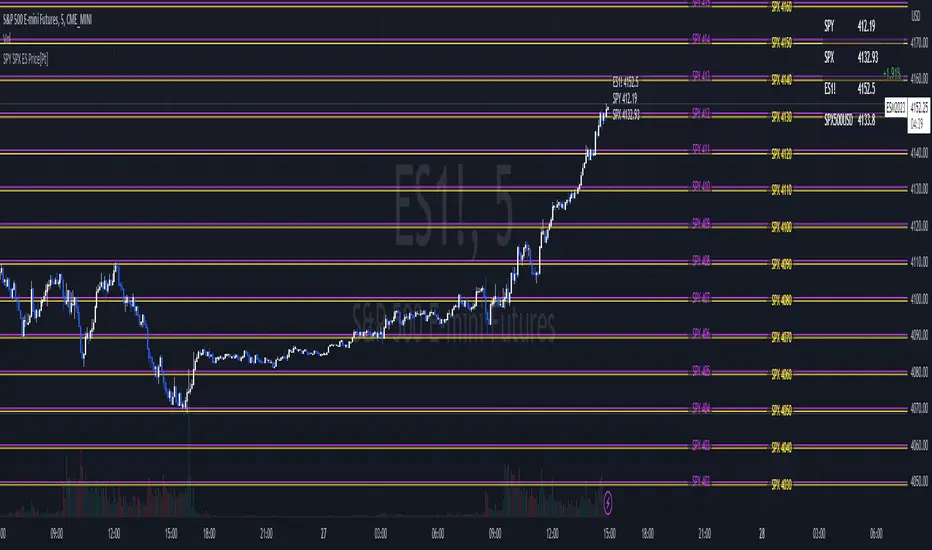
SPY SPX ES Price Converter [Pt]A must have tool for SPY SPX ES traders~!!!
Description
The SPY SPX ES Price Converter is a powerful and easy-to-use tool that allows traders to view corresponding price levels for linked instruments in real-time. This includes SPY, SPX, ES, and SPX500USD. Although these instruments often move in sync, differences in price movements, volume, and trading hours can create unique key levels and support/resistance areas for each. By mapping these levels on the same chart, traders can more easily spot trading opportunities and improve their chances of success.
Customizable features
- multiplier from the closest whole number price level
- line color
- line style
- label position / size
- # of levels to display
- toggle current price display table
Pre-market Highs & Lows on regular trading hours (RTH) chartShows pre-market highs and lows on RTH or ETH chart
-Pre-market duration user input (default is 16 'bar hours'; covering the time from S&P RTH close at 4pm >> 9:30am RTH open next day
-Displays on both RTH and ETH charts
-Written for ES (ES1! or e.g ESM2023), but tested and working on SPY, SPX
-Works across timeframes
Example usage on Electronic trading hours (ETH) chart; showing the 'bar hours' user input lookback duration visually

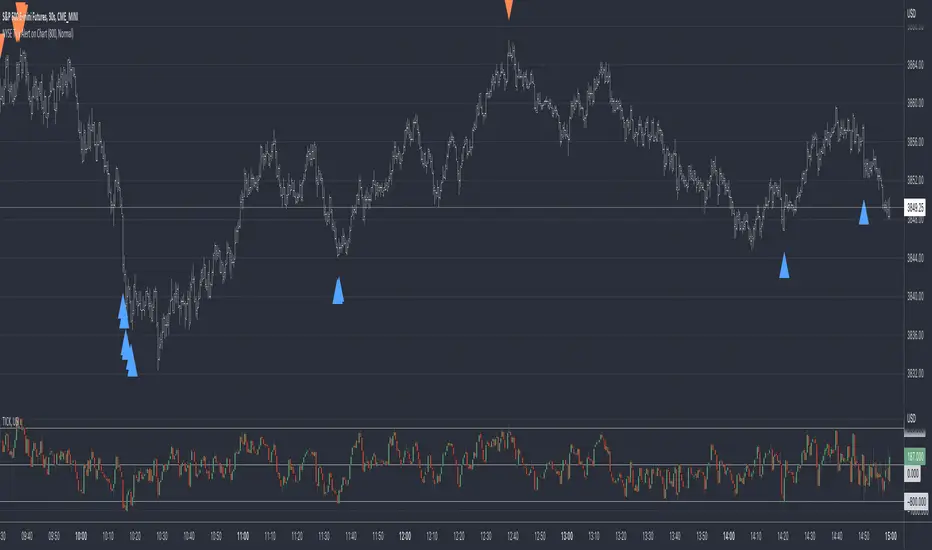
TICK - Custom Tickers [Pt]Traditionally, the TICK index is a technical analysis indicator that shows the difference in the number of stocks that are trading on an uptick vs a downtick in a particular period of time. This indicator allows user to choose up to 40 tickers to calculate TICK.
By default, it uses the SPY Top 40 stocks, but can be changed to any tickers.
There are options to show:
- Top 7 , ie. can be used for just showing TICK for FAANGMT => $FB + $AMZN + $AAPL + $NFLX + $GOOG + $MSFT + $TSLA
- Top 10
- Top 20
- Top 30
- Top 40
Data can be displayed in candle bars, line, or both.
Enjoy~

VIX/VOLI RatioWe all know TVC:VIX . But what is NASDAQ:VOLI ?
VOLI is basically a measure of expectations for market volatility over the next 30 calendar days as expressed by ATM options on AMEX:SPY
nations.com
So why is this VIX /VOLI ratio important? It's because it can give an important measure of options skew.
It can show the premium of OTM options (particularly puts) over ATM.
It can show if traders are interested in owning wings in AMEX:SPY
Not a lot of info can be taken by just looking at the ratio as a standalone nominal value. Plus, the ratio is noisy and spotting a clear trend can be hard.
For these reasons, I decided to code this indicator (which is best used on the Daily chart).
I added two EMA clouds, 7 and 12 and color code them with respect to their positions. If 7 > 12, cloud will be green. If 7 < 12, cloud will be red. This will give a better view of how the ratio is trending.
I then added a lookback period that can be changed from the indicator's setting (along with the fast and slow EMAs).
The lookback period will be used to get the following parameters:
- highest value
- lowest value
- 10th, 30th, 50th, 70th and 90th percentiles
- Percentile Rank
- Average, Median and Mode
Having all these values in a table will give a better idea of where the current ratio sits.

Volatility Inverse Correlation CandleThis is an educational tool that can help you find direct or inverse relations between two assets.
In this case I am using VIX and SPX .
The way it works is the next one :
So I am looking at the current open value of VIX in comparison with the previous close ( if it either above or below) and after on the SPX I am looking into the history and see for example which type of candle we had in respect with the opening value from VIX .
So for example, lets imagine that today is monday, and the weekly open value from VIX was higher than previous friday close value. Now I am going to see with the inverse correlation , if based on this idea, the current weekly candle from SPX finished in a bear candle.
The same can be applied for the bearish situation, so if we had an open from VIX lower than previous close, we are looking to check the SPX bull candle accuracy.
At the same time, for a different type of calculation I have added an internal lookup into heikin ashi values.
If you have any questions please let me know !
