EUR/USD Multi-Layer Statistical Regression StrategyStrategy Overview
This advanced EUR/USD trading system employs a triple-layer linear regression framework with statistical validation and ensemble weighting. It combines short, medium, and long-term regression analyses to generate high-confidence directional signals while enforcing strict risk controls.
Core Components
Multi-Layer Regression Engine:
Parallel regression analysis across 3 customizable timeframes (short/medium/long)
Projects future price values using prediction horizons
Statistical significance filters (R-squared, correlation, slope thresholds)
Signal Validation System:
Lookback validation tests historical prediction accuracy
Ensemble weighting of layer signals (adjustable influence per timeframe)
Confidence scoring combining statistical strength, layer agreement, and validation accuracy
Risk Management:
Position sizing scaled by signal confidence (1%-100% of equity)
Daily loss circuit breaker (halts trading at user-defined threshold)
Forex-tailored execution (pip slippage, percentage-based commissions)
Visual Intelligence:
Real-time regression line plots (3 layered colors)
Projection markers for short-term forecasts
Background coloring for market bias indication
Comprehensive statistics dashboard (R-squared metrics, validation scores, P&L)
Key Parameters
Category Settings
Regression Short/Med/Long lengths (20/50/100 bars)
Statistics Min R² (0.65), Correlation (0.7), Slope (0.0001)
Validation 30-bar lookback, 10-bar projection
Risk Controls 50% position size, 12% daily loss limit, 75% confidence threshold
Trading Logic
Entries require:
Ensemble score > |0.5|
Confidence > threshold
Short & medium-term significance
Active daily loss limit not breached
Exits triggered by:
Opposite high-confidence signals
Daily loss limit violation (emergency exit)
The strategy blends quantitative finance techniques with practical trading safeguards, featuring a self-optimizing design where signal quality directly impacts position sizing. The visual dashboard provides real-time feedback on model performance and market conditions.
Statistics

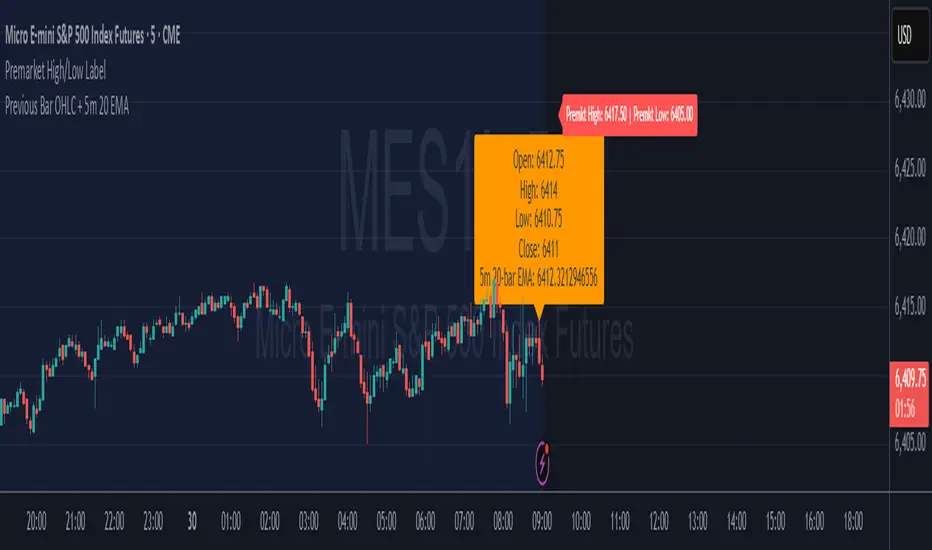
Premarket High/Low LabelThis is the premarket high low label that will persist through current trading session. hope it helps :)
CCI-MACD Strategy 4.2
I cerchi si basano sull'oscillatore CCI (Commodity Channel Index).
L’indicatore CCI ci permette di osservare se il livello attuale del prezzo è particolarmente al di sopra o al di sotto di una certa media mobile, avente un numero di periodi scelto da noi.
Più la deviazione dal prezzo medio nel breve termine è forte, e maggiormente l’indicatore si allontanerà dallo 0: verso l’alto in caso di uptrend, o verso il basso in caso di downtrend.
Il segnale viene dato quando il valore del CCI supera la linea dello zero.
Il tutto è filtrato con un altro indicatore, il MACD, acronimo di "Moving Average Convergence Divergence", usato per identificare cambiamenti nel momentum del prezzo.
The circles are based on the CCI (Commodity Channel Index) oscillator.
The CCI indicator allows us to observe whether the current price level is significantly above or below a certain moving average, with a number of periods chosen by us.
The greater the deviation from the short-term average price, the further the indicator will deviate from 0: upwards in the case of an uptrend, or downwards in the case of a downtrend.
The signal is given when the CCI value crosses the zero line.
This is all filtered through another indicator, the MACD, which stands for "Moving Average Convergence Divergence," used to identify changes in price momentum.

Simple 5 Moving Averages 5 MAs - Shubhashish DixitEnjoy the 5 Moving Average to Support your analysis deeper

Premarket High/Low LabelThis is an indicator which shows premarket high/low label. so that you dont have to do it yourself. hope it helps :)

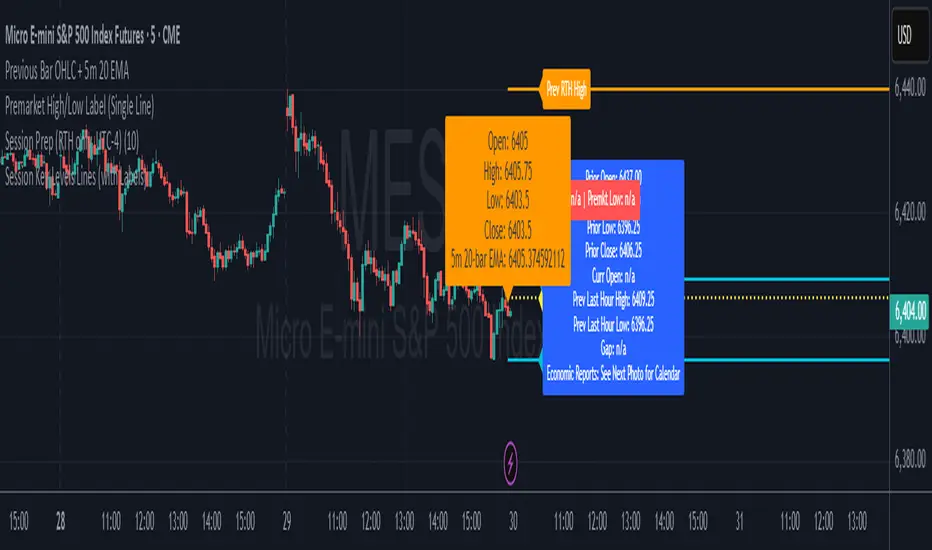
Session Key Levels Lines (with Labels)This is an extension of the previous indicator, it just plots all the information you need automatically for you so you dont have to lift a finger. hope it helps :)

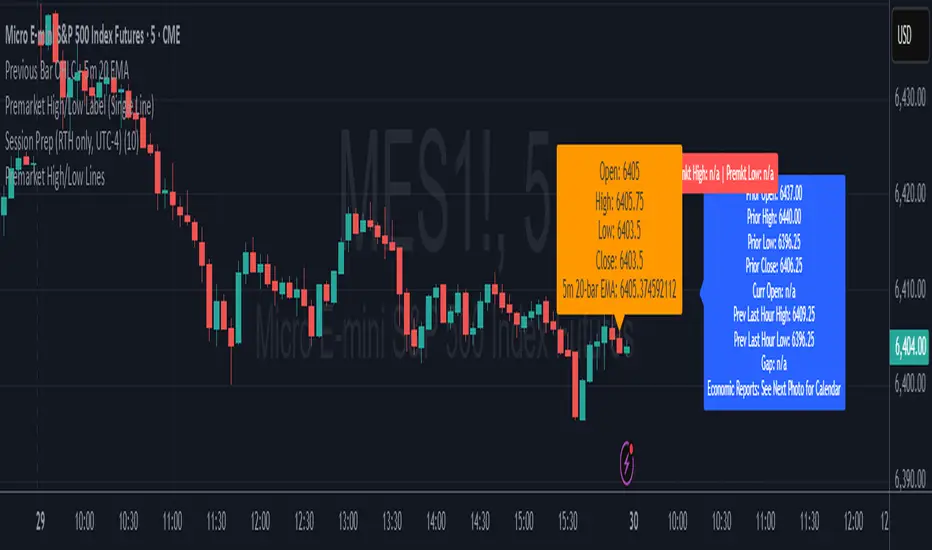
Session Prep (RTH only, UTC-4)This shows what you have to prepare before each session, including Previous session's OHLC, how much is being gapped up...etc. hope it helps :)
Previous Bar OHLC + 5m 20 EMAThis shows previous bar OHLC + 5m 20 EMA in one single text box, so you dont have to find it yourself. hope it helps :)

Premarket High/Low LinesTHis is another script about premarket lines, the previous one is a label and this one really plot the lines, so you dont have to do it yourself. hope it helps :)
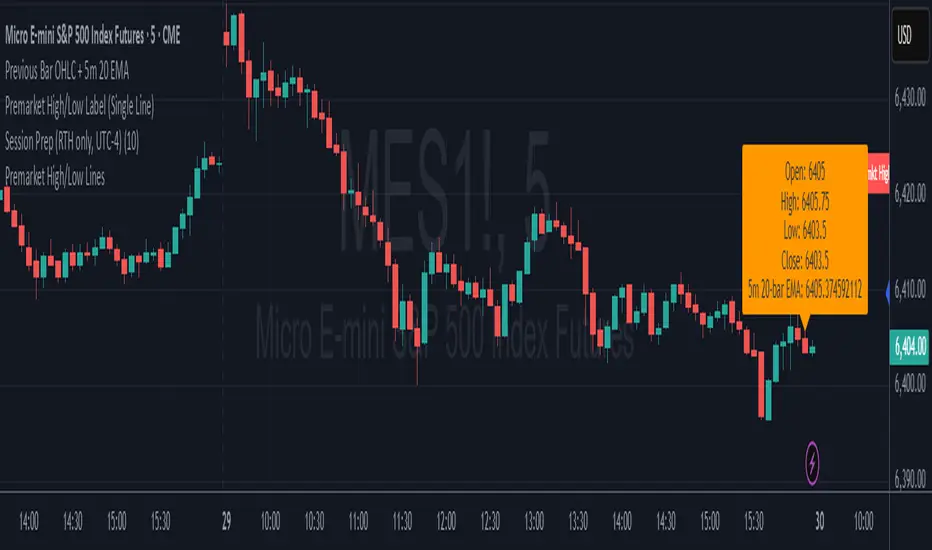
Premarket High/Low Label (Single Line)it shows you what the premarket high low label is on a single line, saving you the hassale of fidning it yourself. :) hope it helps.
Previous Day Levels (High, Low, Open, Close)This TradingView Pine Script indicator plots the previous day’s price levels (High, Low, Open, and Close) as horizontal rays that extend across the current trading day.
Green lines mark the Previous Day High and Previous Day Low.
Yellow lines mark the Previous Day Open and Previous Day Close.
Labels are automatically displayed at the right edge of the chart, positioned above each line, making it easy to identify the corresponding level in real time.
The levels are updated daily and always begin at the start of the current day, ensuring that they cover the entire intraday session.
This tool helps traders quickly visualize key support and resistance levels from the previous trading day and incorporate them into intraday strategies.

Volume Footprint Anomaly Scanner [PhenLabs]📊 PhenLabs - Volume Footprint Anomaly Scanner (VFAS)
Version: PineScript™ v6
📌 Description
The PhenLabs Volume Footprint Anomaly Scanner (VFAS) is an advanced Pine Script indicator designed to detect and highlight significant imbalances in buying and selling pressure within individual price bars. By analyzing a calculated "Delta" – the net difference between estimated buy and sell volume – and employing statistical Z-score analysis, VFAS pinpoints moments when buying or selling activity becomes unusually dominant. This script was created not in hopes of creating a "Buy and Sell" indicator but rather providing the user with a more in-depth insight into the intrabar volume delta and how it can fluctuate in unusual ways, leading to anomalies that can be capitalized on.
This indicator helps traders identify high-conviction points where strong market participants are active, signaling potential shifts in momentum or continuation of a trend. It aims to provide a clearer understanding of underlying market dynamics, allowing for more informed decision-making in various trading strategies, from identifying entry points to confirming trend strength.
🚀 Points of Innovation
● Z-Score for Delta Analysis : Utilizes statistical Z-scores to objectively identify statistically significant anomalies in buying/selling pressure, moving beyond simple, arbitrary thresholds.
● Dynamic Confidence Scoring : Assigns a multi-star confidence rating (1-4 stars) to each signal, factoring in high volume, trend alignment, and specific confirmation criteria, providing a nuanced view of signal strength.
● Integrated Trend Filtering : Offers an optional Exponential Moving Average (EMA)-based trend filter to ensure signals align with the broader market direction, reducing false positives in ranging markets.
● Strict Confirmation Logic : Implements specific confirmation criteria for higher-confidence signals, including price action and a time-based gap from previous signals, enhancing reliability.
● Intuitive Info Dashboard : Provides a real-time summary of market trend and the latest signal's direction and confidence directly on the chart, streamlining information access.
🔧 Core Components
● Core Delta Engine : Estimates the net buying/selling pressure (bar Delta) by analyzing price movement within each bar relative to volume. It also calculates average volume to identify bars with unusually high activity.
● Anomaly Detection (Z-Score) : Computes the Z-score for the current bar's Delta, indicating how many standard deviations it is from its recent average. This statistical measure is central to identifying significant anomalies.
● Trend Filter : Utilizes a dual Exponential Moving Average (EMA) cross-over system to define the prevailing market trend (uptrend, downtrend, or range), providing contextual awareness.
● Signal Processing & Confidence Algorithm : Evaluates anomaly conditions against trend filters and confirmation rules, then calculates a dynamic confidence score to produce actionable, contextualized signal information.
🔥 Key Features
● Advanced Delta Anomaly Detection : Pinpoints bars with exceptionally high buying or selling pressure, indicating potential institutional activity or strong market conviction.
● Multi-Factor Confidence Scoring : Each signal comes with a 1-4 star rating, clearly communicating its reliability based on high volume, trend alignment, and specific confirmation criteria.
● Optional Trend Alignment : Users can choose to filter signals, so only those aligned with the prevailing EMA-defined trend are displayed, enhancing signal quality.
● Interactive Signal Labels : Displays compact labels on the chart at anomaly points, offering detailed tooltips upon hover, including signal type, direction, confidence, and contextual information.
● Customizable Bar Colors : Visually highlights bars with Delta anomalies, providing an immediate visual cue for strong buying or selling activity.
● Real-time Info Dashboard : A clean, customizable dashboard shows the current market trend and details of the latest detected signal, keeping key information accessible at a glance.
● Configurable Alerts : Set up alerts for bullish or bearish Delta anomalies to receive real-time notifications when significant market pressure shifts occur.
🎨 Visualization
Signal Labels :
* Placed at the top/bottom of anomaly bars, showing a "📈" (bullish) or "📉" (bearish) icon.
* Tooltip: Hovering over a label reveals detailed information: Signal Type (e.g., "Delta Anomaly"), Direction, Confidence (e.g., "★★★☆"), and a descriptive explanation of the anomaly.
* Interpretation: Clearly marks actionable signals and provides deep insights without cluttering the chart, enabling quick assessment of signal strength and context.
● Info Dashboard :
* Located at the top-right of the chart, providing a clean summary.
* Displays: "PhenLabs - VFAS" header, "Market Trend" (Uptrend/Downtrend/Range with color-coded status), and "Direction | Conf." (showing the last signal's direction and star confidence).
* Optional "💡 Hover over signals for details" reminder.
* Interpretation: A concise, real-time summary of the market's pulse and the most recent high-conviction event, helping traders stay informed at a glance.
📖 Usage Guidelines
Setting Categories
⚙️ Core Delta & Volume Engine
● Minimum Volume Lookback (Bars)
○ Default: 9
○ Range: Integer (e.g., 5-50)
○ Description: Defines the number of preceding bars used to calculate the average volume and delta. Bars with volume below this average won't be considered for high-volume signals. A shorter lookback is more reactive to recent changes, while a longer one provides a smoother average.
📈 Anomaly Detection Settings
Delta Z-Score Anomaly Threshold
○ Default: 2.5
○ Range: Float (e.g., 1.0-5.0+)
○ Description: The number of standard deviations from the mean that a bar's delta must exceed to be considered a significant anomaly. A higher threshold means fewer, but potentially stronger, signals. A lower threshold will generate more signals, which might include less significant events. Experiment to find the optimal balance for your trading style.
🔬 Context Filters
Enable Trend Filter
○ Default: False
○ Range: Boolean (True/False)
○ Description: When enabled, signals will only be generated if they align with the current market trend as determined by the EMAs (e.g., only bullish signals in an uptrend, bearish in a downtrend). This helps to filter out counter-trend noise.
● Trend EMA Fast
○ Default: 50
○ Range: Integer (e.g., 10-100)
○ Description: The period for the faster Exponential Moving Average used in the trend filter. In combination with the slow EMA, it defines the trend direction.
● Trend EMA Slow
○ Default: 200
○ Range: Integer (e.g., 100-400)
○ Description: The period for the slower Exponential Moving Average used in the trend filter. The relationship between the fast and slow EMA determines if the market is in an uptrend (fast > slow) or downtrend (fast < slow).
🎨 Visual & UI Settings
● Show Info Dashboard
○ Default: True
○ Range: Boolean (True/False)
○ Description: Toggles the visibility of the dashboard on the chart, which provides a summary of market trend and the last detected signal.
● Show Dashboard Tooltip
○ Default: True
○ Range: Boolean (True/False)
○ Description: Toggles a reminder message in the dashboard to hover over signal labels for more detailed information.
● Show Delta Anomaly Bar Colors
○ Default: True
○ Range: Boolean (True/False)
○ Description: Enables or disables the coloring of bars based on their delta direction and whether they represent a significant anomaly.
● Show Signal Labels
○ Default: True
○ Range: Boolean (True/False)
○ Description: Controls the visibility of the “📈” or “📉” labels that appear on the chart when a delta anomaly signal is generated.
🔔 Alert Settings
Alert on Delta Anomaly
○ Default: True
○ Range: Boolean (True/False)
○ Description: When enabled, this setting allows you to set up alerts in TradingView that will trigger whenever a new bullish or bearish delta anomaly is detected.
✅ Best Use Cases
Early Trend Reversal / Continuation Detection: Identify strong surges of buying/selling pressure at key support/resistance levels that could indicate a reversal or the continuation of a strong move.
● Confirmation of Breakouts: Use high-confidence delta anomalies to confirm the validity of price breakouts, indicating strong conviction behind the move.
● Entry and Exit Points: Pinpoint precise entry opportunities when anomalies align with your trading strategy, or identify potential exhaustion signals for exiting trades.
● Scalping and Day Trading: The indicator’s sensitivity to intraday buying/selling imbalances makes it highly effective for short-term trading strategies.
● Market Sentiment Analysis: Gain a real-time understanding of underlying market sentiment by observing the prevalence and strength of bullish vs. bearish anomalies.
⚠️ Limitations
Estimated Delta: The script uses a simplified method to estimate delta based on bar close relative to its range, not actual order book or footprint data. While effective, it’s an approximation.
● Sensitivity to Z-Score Threshold: The effectiveness heavily relies on the `Delta Z-Score Anomaly Threshold`. Too low, and you’ll get many false positives; too high, and you might miss valid signals.
● Confirmation Criteria: The 4-star confidence level’s “confirmation” relies on specific subsequent bar conditions and previous confirmed signals, which might be too strict or specific for all contexts.
● Requires Context: While powerful, VFAS is best used in conjunction with other technical analysis tools and price action to form a comprehensive trading strategy. It is not a standalone “buy/sell” signal.
💡 What Makes This Unique
Statistical Rigor: The application of Z-score analysis to bar delta provides an objective, statistically-driven way to identify true anomalies, moving beyond arbitrary thresholds.
● Multi-Factor Confidence Scoring: The unique 1-4 star confidence system integrates multiple market dynamics (volume, trend alignment, specific follow-through) into a single, easy-to-interpret rating.
● User-Friendly Design: From the intuitive dashboard to the detailed signal tooltips, the indicator prioritizes clear and accessible information for traders of all experience levels.
🔬 How It Works
1. Bar Delta Calculation:
● The script first estimates the “buy volume” and “sell volume” for each bar. This is done by assuming that volume proportional to the distance from the low to the close represents buying, and volume proportional to the distance from the high to the close represents selling.
● How this contributes: This provides a proxy for the net buying or selling pressure (delta) within that specific price bar, even without access to actual footprint data.
2. Volume & Delta Z-Score Analysis:
● The average volume over a user-defined lookback period is calculated. Bars with volume less than twice this average are generally considered of lower interest.
● The Z-score for the calculated bar delta is computed. The Z-score measures how many standard deviations the current bar’s delta is from its average delta over the `Minimum Volume Lookback` period.
● How this contributes: A high positive Z-score indicates a bullish delta anomaly (significantly more buying than usual), while a high negative Z-score indicates a bearish delta anomaly (significantly more selling than usual). This identifies statistically unusual levels of pressure.
3. Trend Filtering (Optional):
● Two Exponential Moving Averages (Fast and Slow EMA) are used to determine the prevailing market trend. An uptrend is identified when the Fast EMA is above the Slow EMA, and a downtrend when the Fast EMA is below the Slow EMA.
● How this contributes: If enabled, the indicator will only display bullish delta anomalies during an uptrend and bearish delta anomalies during a downtrend, helping to confirm signals within the broader market context and avoid counter-trend signals.
4. Signal Generation & Confidence Scoring:
● When a delta Z-score exceeds the user-defined anomaly threshold, a signal is generated.
● This signal is then passed through a multi-factor confidence algorithm (`f_calculateConfidence`). It awards stars based on: high volume presence, alignment with the overall trend (if enabled), and a fourth star for very strong Z-scores (above 3.0) combined with specific follow-through candle patterns after a cooling-off period from a previous confirmed signal.
● How this contributes: Provides a qualitative rating (1-4 stars) for each anomaly, allowing traders to quickly assess the potential significance and reliability of the signal.
💡 Note:
The PhenLabs Volume Footprint Anomaly Scanner is a powerful analytical tool, but it’s crucial to understand that no indicator guarantees profit. Always backtest and forward-test the indicator settings on your chosen assets and timeframes. Consider integrating VFAS with your existing trading strategy, using its signals as confirmation for entries, exits, or trend bias. The Z-score threshold is highly customizable; lower values will yield more signals (including potential noise), while higher values will provide fewer but potentially higher-conviction signals. Adjust this parameter based on market volatility and your risk tolerance. Remember to combine statistical insights from VFAS with price action, support/resistance levels, and your overall market outlook for optimal results.

Daily ATR Stop Loss Buffer- Calculates Daily ATR: Uses the daily timeframe ATR (Average True Range) - a measure of price volatility
- Applies Your Buffer: Takes a percentage of that ATR that you set in the settings (e.g., 5% of daily ATR)
- Creates Stop Levels: Calculates where to place stop losses based on current price plus/minus your ATR buffer

ALFA ATC LondonThis indicator is a data indicator focused on the algorithmic opening prices of stock exchanges and shows these areas. Bias can be obtained from these areas. Trades can be executed by taking advantage of the price's ability to test and hold these areas. The indicator, AS ATC5, includes opening information for the CM New York, London, Frankfurt, and Tokyo stock exchanges. This indicator is designed solely for London and Frankfurt.

Spot vs. Derivatives BasisThis indicator calculates the basis between average spot and average perpetual futures prices across selected exchanges. It helps identify deviations between spot and perp markets — a key signal for funding pressure, arbitrage, or market dislocation.
Key Features:
Manual Pair Control – Enable or disable specific trading pairs as needed
Flexible Basis Smoothing – Apply SMA, EMA, WMA, or VWMA to filter noise
Anomaly Highlighting – Automatically flags basis deviations beyond ±0.1%

Support/Resistance MTF Merge ZonesIndicator Introduction
Support/Resistance MTF Merge Zones is an advanced technical analysis tool that automatically identifies and merges key support/resistance zones by analyzing highs and lows from multiple timeframes (15M, 1H, 4H, Daily).
Key Features
Multi-Timeframe Analysis: Integrates data from 15M, 1H, 4H, and Daily charts
Smart Zone Merging: Automatically consolidates levels within a specified percentage range into unified zones
Dynamic Color System: Distinguishes support/resistance zones based on position relative to current price
Strength Indication: Highlights zones where multiple levels converge as strong zones
Usage Guide
Configuration Parameters
Lookback Period (10): Period for calculating highs/lows
Adjustable range: 5-30
Higher values detect more long-term levels
Zone Merge % (0.5): Percentage threshold for zone merging
Range: 0.1-2.0%
Higher values merge levels across wider price ranges
Min Levels for Zone (2): Minimum number of levels required to form a zone
Range: 2-5 levels
Higher values display only more confirmed zones
Box Opacity (7): Transparency level of zone boxes
Range: 0-100%
Color Scheme
Red: Resistance zones above current price
Blue: Support zones below current price
Orange: Strong zones (3+ merged levels)

Custom NY Opening Bell - Today OnlyThis indicator shows NYC ET opening bell.
It will displace a dashed line on it.
This can be very useful for trades journaling their trades with screenshots.
My indicator will let you know when opening bell happened.
It is also very great when doing backtesting.

Nifty Buy/Sell Signals with RSI & Fisheruy Signal when:
RSI crosses above 40 from below.
Fisher Transform crosses above its signal line (bullish crossover).
Sell Signal when:
RSI crosses below 60 from above.
Fisher Transform crosses below its signal line (bearish crossover).

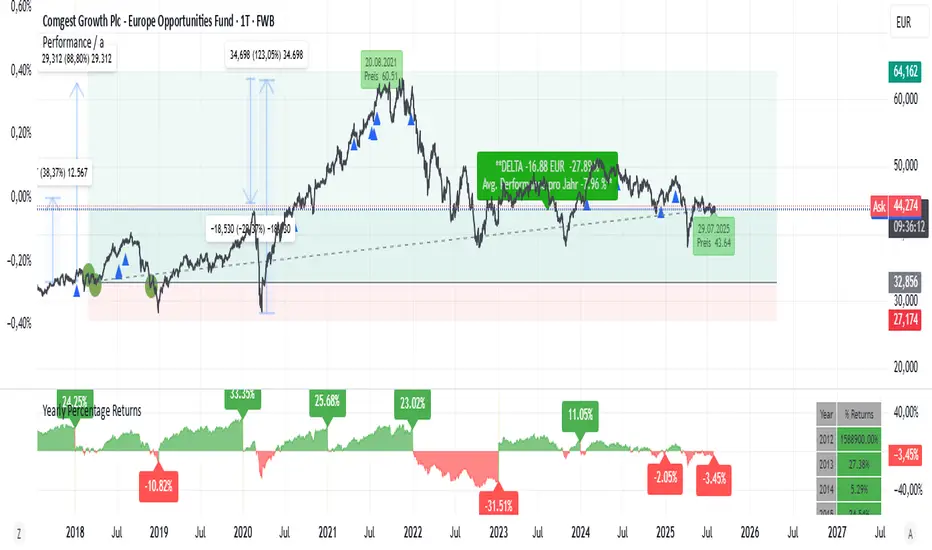
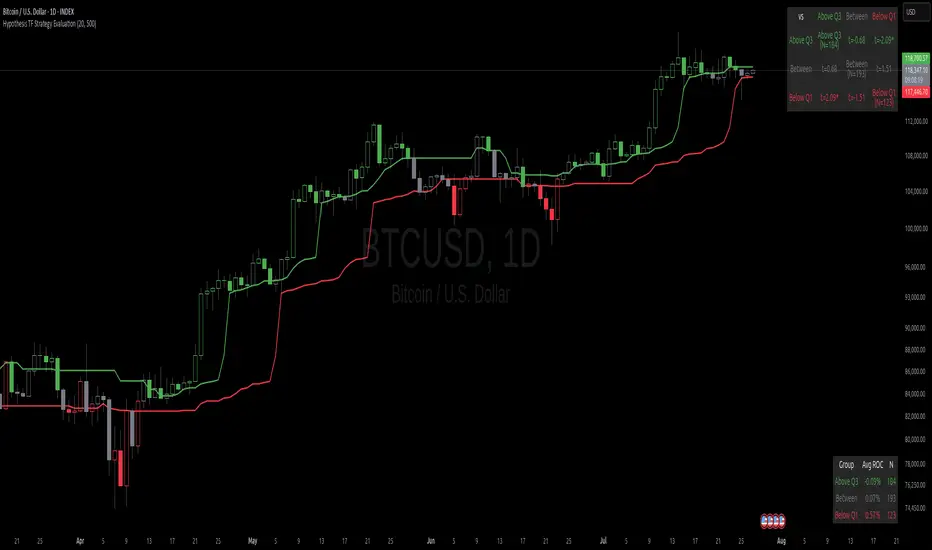
Hypothesis TF Strategy EvaluationThis script provides a statistical evaluation framework for trend-following strategies by examining whether mean returns (measured here as 1-period Rate of Change, ROC) differ significantly across different price quantile groups.
Specifically, it:
Calculates rolling 25th (Q1) and 75th (Q3) percentile levels of price over a user-defined window.
Classifies returns into three groups based on whether price is above Q3, between Q1 and Q3, or below Q1.
Computes mean returns and sample sizes for each group.
Performs Welch's t-tests (which account for unequal variances) between groups to assess if their mean returns differ significantly.
Displays results in two tables:
Summary Table: Shows mean ROC and number of observations for each group.
Hypothesis Testing Table: Shows pairwise t-statistics with significance stars for 95% and 99% confidence levels.
Key Features
Rolling quantile calculations: Captures local price distributions dynamically.
Robust hypothesis testing: Welch's t-test allows for heteroskedasticity between groups.
Significance indicators: Easy visual interpretation with "*" (95%) and "**" (99%) significance levels.
Visual aids: Plots Q1 and Q3 levels on the price chart for intuitive understanding.
Extensible and transparent: Fully commented code that emphasizes the evaluation process rather than trading signals.
Important Notes
Not a trading strategy: This script is intended as a tool for research and validation, not as a standalone trading system.
Look-ahead bias caution: The calculation carefully avoids look-ahead bias by computing quantiles and ROC values only on past data at each point.
Users must ensure look-ahead bias is removed when applying this or similar methods, as look-ahead bias would artificially inflate performance and statistical significance.
The statistical tests rely on the assumption of independent samples, which might not fully hold in financial time series but still provide useful insights
Usage Suggestions
Use this evaluation framework to validate hypotheses about the behavior of returns under different price regimes.
Integrate with your strategy development workflow to test whether certain market conditions produce statistically distinct return distributions.
Example
In this example, the script was run with a quantile length of 20 bars and a lookback of 500 bars for ROC classification.
We consider a simple hypothetical "strategy":
Go long if the previous bar closed above Q3 the 75th percentile).
Go short if the previous bar closed below Q1 (the 25th percentile).
Stay in cash if the previous close was between Q1 and Q3.
The screenshot below demonstrates the results of this evaluation. Surprisingly, the "long" group shows a negative average return, while the "short" group has a positive average return, indicating mean reversion rather than trend following.
The hypothesis testing table confirms that the only statistically significant difference (at 95% or higher confidence) is between the above Q3 and below Q1 groups, suggesting a meaningful divergence in their return behavior.
This highlights how this framework can help validate or challenge intuitive assumptions about strategy performance through rigorous statistical testing.
Markov Chain Trend ProbabilityA Markov Chain is a mathematical model that predicts future states based on the current state, assuming that the future depends only on the present (not the past). Originally developed by Russian mathematician Andrey Markov, this concept is widely used in:
Finance: Risk modeling, portfolio optimization, credit scoring, algorithmic trading
Weather Forecasting: Predicting sunny/rainy days, temperature patterns, storm tracking
Here's an example of a Markov chain: If the weather is sunny, the probability that will be sunny 30 min later is say 90%. However, if the state changes, i.e. it starts raining, how the probability that will be raining 30 min later is say 70% and only 30% sunny.
Similar concept can be applied to markets price action and trends.
Mathematical Foundation
The core principle follows the Markov Property: P(X_{t+1}|X_t, X_{t-1}, ..., X_0) = P(X_{t+1}|X_t)
Transition Matrix :
-------------Next State
Current----
--------P11 P12
-----P21 P22
Probability Calculations:
P(Up→Up) = Count(Up→Up) / Count(Up states)
P(Down→Down) = Count(Down→Down) / Count(Down states)
Steady-state probability: π = πP (where π is the stationary distribution)
State Definition:
State = UPTREND if (Price_t - Price_{t-n})/ATR > threshold
State = DOWNTREND if (Price_t - Price_{t-n})/ATR < -threshold
How It Works in Trading
This indicator applies Markov Chain theory to market trends by:
Defining States: Classifies market conditions as UPTREND or DOWNTREND based on price movement relative to ATR (Average True Range)
Learning Transitions: Analyzes historical data to calculate probabilities of moving from one state to another
Predicting Probabilities: Estimates the likelihood of future trend continuation or reversal
How to Use
Parameters:
Lookback Period: Number of bars to analyze for trend detection (default: 14)
ATR Threshold: Sensitivity multiplier for state changes (default: 0.5)
Historical Periods: Sample size for probability calculations (default: 33)
Trading Applications:
Trend confirmation for entry/exit decisions
Risk assessment through probability analysis
Market regime identification
Early warning system for potential trend reversals
The indicator works on any timeframe and asset class. Enjoy!
