Efficient Trend Step ChannelIntroduction
The efficient trend-step indicator is a trend indicator that make use of the efficiency ratio in order to adapt to the market trend strength, this indicator originally aimed to remain static during ranging states while fitting the price only when large variations occur. The trend step indicator family unlike most moving averages has a boxy appearance and could therefore not be classified as smooth, this makes it an indicator relatively uninteresting to use as input for other non-trending indicators such as oscillators.
Today a channel indicator making use of the efficient trend-step is proposed, the indicator has an upper and a lower extremity who can be used for breakout or support and resistance methodologies, however we will see that the indicator is sometimes able to return accurate support and resistance levels.
The Indicator
The indicator has the same settings has the efficient trend step indicator, length control the period of the efficiency ratio, fast control the period of the rolling standard deviation used for trending states, slow control the period of the rolling standard deviation used for ranging states, fast should be lower than slow , if both are equal then the indicator is equal to the classical trend step indicator and length does no longer affect the indicator output. Lower values of fast/slow will make the indicator more reactive to small variations thus changing direction more often.
The color changes you can see on the indicator are changed depending on the prior direction took by the indicator output, if the indicator where higher than its precedent value, then the color will be blue until the indicator is lower than its precedent value. Those colors help you have an estimate of the current trend direction.
Channel Calculation And Role
The extremities made from the efficient trend step allow for more advanced trading rules, they can act as stop/target level and can also give a rough estimate of the current market volatility, with wider extremities indicating a more volatile market.
The extremities are made directly from the dev element used by the efficient trend-step, the upper extremity is made by summing the efficient trend step with the value of dev when the efficient trend step change, the lower extremity is made the same way but the value is subtracted instead.
Is it a weird choice ? It sure is strange to see such approach, the absolute rolling average error between the price and the efficient trend step could have been a logical measure but using dev instead is more efficient and also allow for a more adaptive approach which can benefit the support and resistance methodology, the last reason is because i didn't wanted to "denature" the trend-step signature of the indicator.
The figure above represent the measurement used for making the extremities (in green).
Since the previously described measure change only when the efficient trend step change, we can conclude that such measure is representative of a relatively large variation, since the efficient trend step aim to only change when a large variations appear.
We can see that the upper extremity acted as an accurate resistance in this upper variation of AMD,
Here as well, however like other bands indicators it is safer to take into account the current trend direction, a strong uptrend will have less difficulties crossing the upper extremity, therefore it might be better to rely on the support (lower extremity) on an up-trending market (indicator in blue), and on the resistance (upper extremity) on an down-trending market (indicator in orange).
The figure above show support and resistances signals, a cross represent a false signal, while green arrows represent correct ones with their respective direction.
Conclusion
The presented indicator add more possibilities to the interpretation of the efficient trend step, the extremities can act as stop/target level, however this use has to be controlled, and the level should be in accordance to your risk/reward ratio.
Showcasing another trend-step indicator was a real pleasure. Thanks for reading :)
Stop

Guppy CBLThis is the Count Back Line script from the book Guppy Trading by Daryl Guppy.
It is usually used as a stop loss line, but can also be used to find entries.
Hope someone finds it usefull, if you find anything that is wrong with it, please let me know and I will try to fix it.
This is my first PineScript, hope it is working as intended.

Scripting Tutorial B - TManyMA - Commission/FeesThis script is for a triple moving average strategy where the user can select from different types of moving averages, price sources, lookback periods and resolutions.
Features:
- 3 Moving Averages with variable MA types, periods, price sources, resolutions and the ability to disable each individually.
- Crossovers are plotted on the chart with detailed information regarding the crossover (Ex: 50 SMA crossed over 200 SMA )
- Forecasting available for all three MAs. MA values are forecasted 5 values out and plotted as if a continuation to the MA.
- Forecast bias also applies to all forecasting. Bias means we can forecast based on an anticipated bullish , bearish or neutral direction in the market.
- To understand bias, please read the source code, or if you can't read the code just send me a message on here or Twitter . Twitter should be linked to my profile.
- Ribbons added and on by default. Optional setting to disable the ribbons. 5 ribbons between MA1 and MA2 and another 5 between MA2 and MA3.
- Ribbons are alpha-color coded based on their relation to their default MAs.
- Ribbons are only visible between MAs if the MAs being compared share the same Type, Resolution, and Source because there is no way to consolidate those three in a simple manner.
- Ribbon values are calculated based on calculated MA Periods between the MAs.
- Converted the existing study into a strategy.
- Strategy only enters long positions with a market order when MA crossovers occur.
- Strategy exits positions when crossunders occur.
- Trades 100% of the equity with one order/position by default.
- Ability to disable trading certain crosses with input checks.
- Ability to exit trades with a take profit or stop loss.
- User input to allow quick changes to the take profit or stop loss percentages.
- Strategy now calculates on every tick
- Strategy also includes fixed commission values based on Coinbase standard order fees
This script is meant as an educational script with well-formatted styling, and references for specific functions.
*** PLEASE NOTE - THIS STRATEGY IS MEANT FOR LEARNING PURPOSES. DEPENDING ON IT'S CONFIGURATION IT MAY OR MAY NOT BE USEFUL FOR ACTUAL TRADING. THE STRATEGY IS NOT FINANCIAL ADVICE ***

Scripting Tutorial A - TManyMA - StopsThis script is for a triple moving average strategy where the user can select from different types of moving averages, price sources, lookback periods and resolutions.
Features:
- 3 Moving Averages with variable MA types, periods, price sources, resolutions and the ability to disable each individually.
- Crossovers are plotted on the chart with detailed information regarding the crossover (Ex: 50 SMA crossed over 200 SMA )
- Forecasting available for all three MAs. MA values are forecasted 5 values out and plotted as if a continuation to the MA.
- Forecast bias also applies to all forecasting. Bias means we can forecast based on an anticipated bullish, bearish or neutral direction in the market.
- To understand bias, please read the source code, or if you can't read the code just send me a message on here or Twitter. Twitter should be linked to my profile.
- Ribbons added and on by default. Optional setting to disable the ribbons. 5 ribbons between MA1 and MA2 and another 5 between MA2 and MA3.
- Ribbons are alpha-color coded based on their relation to their default MAs.
- Ribbons are only visible between MAs if the MAs being compared share the same Type, Resolution, and Source because there is no way to consolidate those three in a simple manner.
- Ribbon values are calculated based on calculated MA Periods between the MAs.
- Converted the existing study into a strategy.
- Strategy only enters long positions with a market order when MA crossovers occur.
- Strategy exits positions when crossunders occur.
- Trades 100% of the equity with one order/position by default.
- Ability to disable trading certain crosses with input checks.
- Ability to exit trades with a take profit or stop loss.
- User input to allow quick changes to the take profit or stop loss percentages.
This script is meant as an educational script with well-formatted styling, and references for specific functions.
*** PLEASE NOTE - THIS STRATEGY IS MEANT FOR LEARNING PURPOSES. DEPENDING ON IT'S CONFIGURATION IT MAY OR MAY NOT BE USEFUL FOR ACTUAL TRADING. THE STRATEGY IS NOT FINANCIAL ADVICE ***

Average True Range Multiplied (Volatility Stop)Plots crosses above and below the current price giving you the ability to quickly set your stop loss (or the 1st profit target) depending on a custom variable by which the average true range is multiplied with the option to specify the length as well as the type of the moving average (RMA, SMA, EMA or WMA) that are taking into account.
Optionally, you can disable showing of the crosses on the chart and just let the indicator display the calculated value by itself.

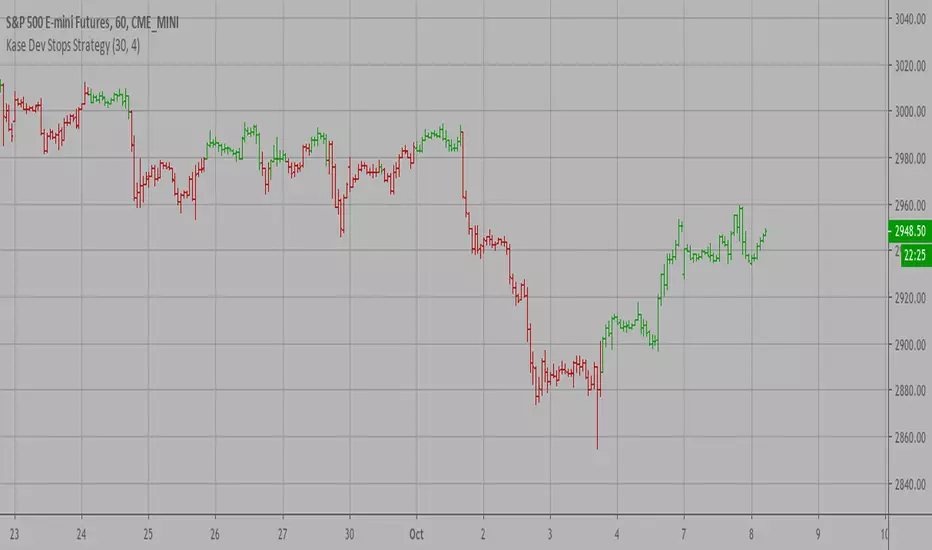
Kase Dev Stops Strategy The Kase Dev Stops system finds the optimal statistical balance between letting profits run,
while cutting losses. Kase DevStop seeks an ideal stop level by accounting for volatility (risk),
the variance in volatility (the change in volatility from bar to bar), and volatility skew
(the propensity for volatility to occasionally spike incorrectly).
Kase Dev Stops are set at points at which there is an increasing probability of reversal against
the trend being statistically significant based on the log normal shape of the range curve.
Setting stops will help you take as much risk as necessary to stay in a good position, but not more.
WARNING:
- For purpose educate only
- This script to change bars colors.
CKSDHi. It's simply histogram that shows divergence between the lines of the Chande Kroll Stop ind (built-in TradingView ind). I noticed that the lines intersect or are very close to each other if the volatility decreases. You can use MA like the main line or just 5, 10 lines how I do. Sorry for code Im not a programmer

ATR ChannelsATR Channels help you to identify where to place your stop-loss or trailing stop-loss based on price volatility, according to the Average True Range (ATR).


ATR based Pivots mcbwHey everyone this is an exciting new script I have prepared for you.
I was reading an old forex bulletin article some time ago when I came across this: solar.murty.net (or you can download the full bulletin with lots of other good articles here: www.forexfactory.com).
You can already buy this for metatrader (www.mql5.com) so I figured to make it for free for tradingview.
This bulletin suggested that you can reasonably predict daily volatility by adding or subtracting multiples of the daily ATR to the daily opening. Using this you can choose multiples to use as price targets and alternatively as stop losses. For example, if you already have a sense of market direction you can buy at market open place a stop loss at - 1 daily ATR and a profit target at + 3 ATRs for a risk to reward ratio of 3. If you are looking for smaller/quicker moves with a ratio of 3 you can have a stop loss at -0.25 ATR and a take profit at +0.75 ATR.
Alternatively this article also suggests to use this method to catch volatility breakouts. If price is higher than the + 1 ATR area then you can safely assume it will be going to the +2 ATR area so you can put a buy stop at + 1 ATR with a profit target at + 2 ATR with a stop loss at +0.5 ATR to catch a volatility breakout with a risk to reward ratio of 2!
Even further there are methods that you can use with ATRs of multiple window sizes, for example by opening two copies of this indicator and measuring recent volatility with a 1 week window and long term volatility within a 1 month window. If the short term volatility is crossing the long term volatility then there is a high probability chance that even more price movement will occur.
However I have found that this method is good for more than daily volatility , it can also be used to measure weekly volatility , and monthly volatility and use these multiples as good long term price targets.
To select if you want daily, weekly, or monthly values of the ATR of volatility you're using go to the settings and click on the options in the "Opening period". The default window of the ATR here is 14 periods, but you can change this if you want to in "ATR period". Most importantly you are able to select which multiples of the ATR you would like to use in the settings in "ATR multiple 1" which is the green line, "ATR multiple 2" which is the blue line, and "ATR multiple 3" which is the purple line. You can select any values you want to put in these, the choice of 0.25, 0.5, and 1 is not special, some people use fibonacci numbers here or simply 0.33, 0.66, and 0.99.
Repainting issue: This script uses the daily value of the Average True Range (ATR), which measures the volatility that is happening today. If price becomes more volatile then the value of the ATR can increase throughout the day, but it can never decrease. What this means is that the ATR based pivots are able to expand away from the opening price, which should not affect the trades that you take based on these areas. If you base your take profit on one of these ATR multiples and the daily volatility increase this means that your take profit area will be closer to your entry than the ATR multiple. Meaning that your trades will be more conservative.
While this all may sound very technical it is super intuitive, throw this on your chart and play around with it :)
Happy trading!

ATR for Trailing StopAn ATR (Average True Range) can be used to position a trailing stop
In this script, the true range of today is calculated based on the low of yesterday in order to be more stable.
It only goes up, as a trailing stop should do.
It only goes down when the trailing stop is reached by the price.

ATR for Trailing StopThe calculation of this ATR is based on the low of yesterday in order to not change continuously during the day.
You can use this indicator to create a trailing stop taking into account volatility on the nATRPeriod previous days.
It also always go up as a trailing stop should. It only goes down the price reaches the trailing stop.
Parabolic SARThis is a redesign of the built-in Parabolic SAR indicator. I added a proper input system, an option to highlight initial points for both lines and an option to choose points width. So, customize it as you want.
Parabolic SAR was originally developed by J. Welles Wilder and described in his book "New Concepts in Technical Trading Systems" (1978). It is a trend-following indicator that can be used as a trailing stop loss.
To know which settings for PSAR are the most profitable on your instrument and timeframe you can use this tool
Profitable Parabolic SAR

SuperTrendThis is a redesign of the SuperTrend indicator. It removes stupid transitions between SuperTrend states and highlights initial points for both lines.
SuperTrend is a moving stop and reversal line based on the volatility (ATR).


Binque's Stop LossFixed Script only showing Daily Stop Loss. Now will show stop loss based on the resolution of the chart you are on, i.e. 1 min, 5 min, 15 min, 1 h, 4 h, 1 d, 1 w, 1 month, etc...

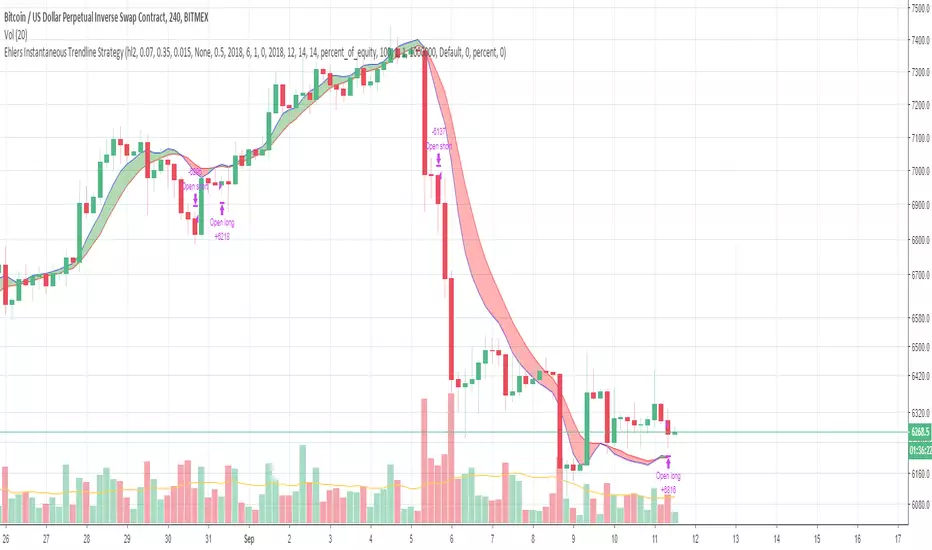
Ehlers Instantaneous Trendline StrategyInstantaneous Trendline Strategy by John Ehlers from his book "Cybernetic Analysis for Stocks and Futures".
You can choose implementation of stop-loss. Don't forget to define correct spread for your instrument.

BitMex Trailing Stop StrategyThis script is designed for those who want to use BitMex's trailing stop. It's not meant to be used as entry exits, but rather to get an idea of how wide the trailing stop needs to be. I suggest you backtest with different values. The script can also be integrated into an existing strategy which does give entry/exits to act as its stop loss.

Double EMA with stop loss indicatorThis is an updated version of my previous stop loss script.
I've added a double EMA line and modified the stop as below;
In an uptrend....
1. a yellow dot will appear once it's time to move your stop. The yellow dot will display at the level of the stop loss. Place your stop 1 pip below the dot.
2. The yellow dot will only appear if a new higher low has formed and has been confirmed. Also the current candle must have broken the high of a previous bullish candle or the dot will not appear.
3. The dot will also appear if there is a likely reversal of the current trend.
Also works in downtrends.....
