ROS [Range of Swag]Creates any multitimeframe level and marks opens, highs lows and midpoints
Comes with labels (hidable)
Works on Bar-by-bar replay
Customizable color!
The default 3 ranges are weekly, monthly, and quarterly in that order.
If you want to change the labels change it in the code... or just hide them.
Big thanks to @spacemanbtc @Kriswaters for the code (levels and session breaks) respectively.
Will be looking to improve it
Support and Resistance
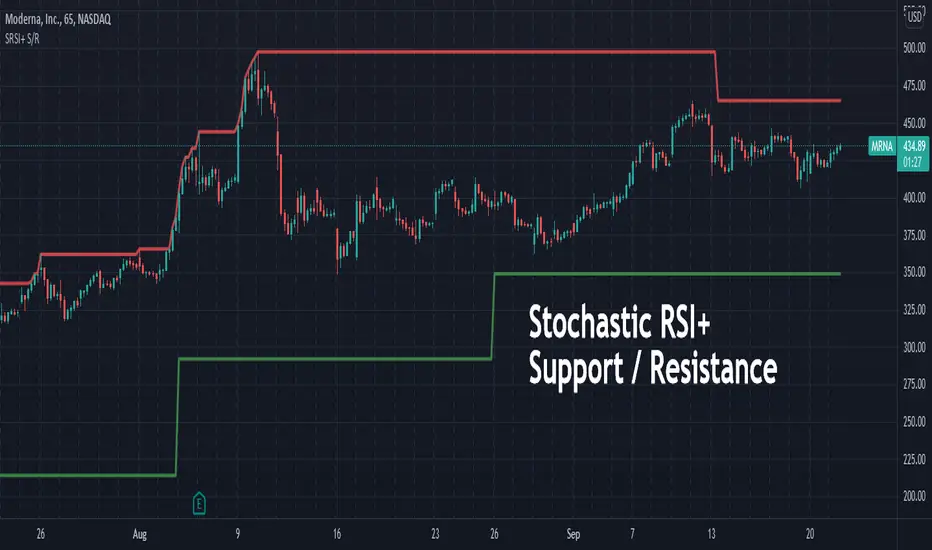
Stochastic RSI+ Support/Resistance (beta)This indicator uses Stochastic RSI+ as a means to determine overbought and oversold conditions which subsequently define recent support and resistance levels.
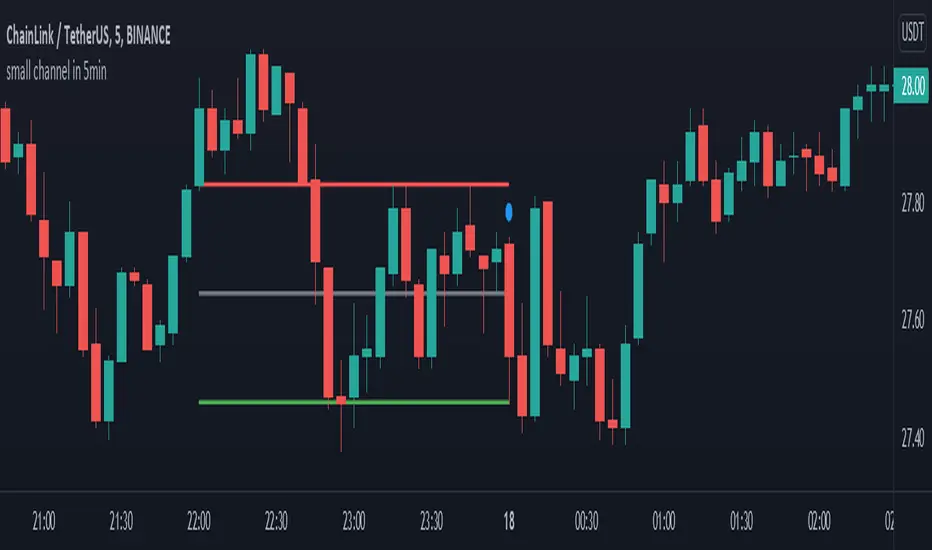
small channel in 5minThis indicator designed for 5min time-frame.
it detects a candlestick pattern in one hour time-frame and draw a channel based on the detected pattern, where two candles and are covered by the third one , in 5 min time-frame.
the bottom, middle and top of the channel are colored by green, gray and red respectively. this channel may help user to use it as a possible support and resistance region.
(the pattern is defined in line 11 to 13.)
enjoy it
Auto Fibonacci and Gann Fan/Retracements ComboIntroduction
This is a combination of Fibonacci and Gann fan/retracements.
The script can automatically draw as many:
Fibonacci Retracements
Fibonacci Fan
Gann Retracements
Gann Fan
as the user requires on the chart. Each level set or fan consists of 7 lines based on the most important ratios of Fibonacci/Gann.
Basics
What are Fibonacci retracements?
Fibonacci retracement levels are horizontal lines that indicate where support and resistance are likely to occur. They stem from Fibonacci’s sequence. Each level is associated with a percentage which is how much of a prior move the price has retraced. The Fibonacci retracement levels are 23.6%, 38.2%, 61.8%, and 78.6%. While not officially a Fibonacci ratio, 50% is also used. The indicator is useful because it can be drawn between any two significant price points, such as a high and a low. The indicator will then create the levels between those two points.
What are Gann retracements?
A developer of technical analysis and trading was W.D. Gann. Gann theory expects a normal retracement of 50 percent. This means that under normal selling pressure, the stock price will decline half the amount of its most recent rise, and vice versa. It also suggests that retracements occur at the halfway point of a move, such as 25 percent (half of 50 percent), 12.5 percent (half of 25 percent), and so on.
What is Fibonacci fan?
Fibonacci fan is a set of sequential trend lines drawn from a trough or peak through a set of points dictated by Fibonacci retracements. The first step to create it is to draw a trend line covering the local lowest and highest prices of a security. To reach retracement levels, the trader divides the difference in price at the low and high end by ratios determined by the Fibonacci series. The lines formed by connecting the starting point for the base trend line and each retracement level create the Fibonacci fan.
What is Gann fan?
A Gann fan consists of a series of lines called Gann angles. These angles are superimposed over a price chart to show potential support and resistance levels. The resulting image is supposed to help technical analysts predict price changes. Gann believed the 45-degree angle to be most important, but the Gann fan also draws angles at degrees like 75, 63.75, 26.25 and 15. The Gann fan originates at a low or high point. The resulting lines show areas of potential future support and resistance. The 45-degree line is known as the 1:1 line because the price will rise or fall at a 45-degree angle when the price moves up/down one unit for each unit of time. All other lines in the Gann fan are drawn above and below the 1:1 line. The other angles are associated with 2:1, 3:1, 4:1, 8:1 and 1:8, 1:4, 1:3, and 1:2 time-to-price moves.
Challenges
The most of the time I dedicated to writing this script has been spent on handling these problems:
1. Finding Local Highest/Lowest Prices
In order to draw Fibonacci and Gann fan/retracements, it's necessary to find local highest and lowest price points (Extrema) on the chart. As this could be so challenging, most traders and coders draw the lines covering the low and high prices over a given period of time or a limited number of bars back instead. I already wrote an indicator using this approach ( Auto Fibonacci Combo ).
In this new script I tried to find the exact highest and lowest prices based on this idea that: if a high point is formed lower than previous high which was after a lowest point, then that previous one was the local highest point, and vice versa if a low point is formed higher than previous low which was after a highest point, then that previous one was the local lowest point. So logically an extremum price on the chart won't be found until the next high/low point is formed.
2. Finding Proper Chart Scale for Gann Fan
Based on the theory, Gann angles are sensitive to the chart price scale and in order to have the right angles, the chart must be made with the proper scale. J.A. Hyerczyk in his book "Pattern, Price & Time - Using Gann Theory in Technical Analysis" suggests that the easiest way to determine the scale of a market is by taking the difference between top-to-top and bottom-to-bottom and dividing it by the time it took the market to move from top to top and bottom to bottom.
Thus on a properly constructed chart, the basic equation for calculating Gann angles is: Price * Time.
3. Drawing Fans and Relocating Fan Labels at Each New Bar in Pine (A Programming-Related Subject)
To do this, I used linear equations and line slopes. Of course it was so complicated and exhausting, but finally I overcame that thanks to my genius cousin.
Settings and Usage
By default, the script shows detected extremum points plus 1 Fibonacci fan, 1 Gann fan, 1 set of Fibonacci retracements and no Gann retracements on the chart. All of these could be changed in the indicator settings beside the color and transparency of each line.
Feel free to use this and send me your thoughts!

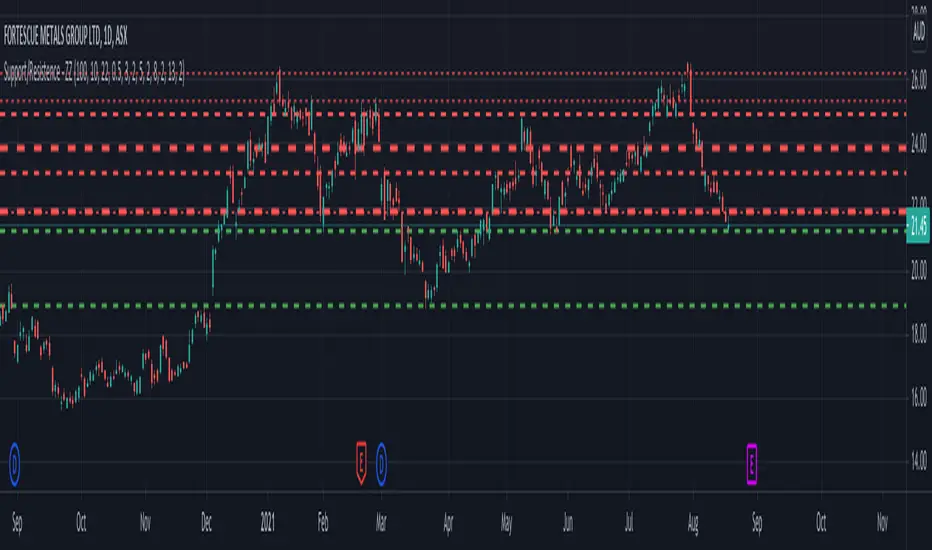
zigzag support&resistance multi timeframe levels [LM]Hello Traders,
I would like to introduce you zigzag support&resistance multi timeframe levels. It is based on the ZigZag semafor script made by DevLucem so shout out to him
The Semafor is used to spot future multi-level Supports and Resistance zones.
It is also useful to spot HL or LL or HH or LH zones at different Depth settings.
I's the same zigzag indicator as my other zigzag indicator with distinction that supports multi timeframe levels as well, with depth setting for every timeframe.
I hope you will enjoy it as I enjoyed to write it.
Lukas

[FN] Strategy - Store Level on ConditionThis is a function that you can use in strategies. Not a strategy in and of itself.
Example thumbnail is showing the function applied to a strategy.
Oftentimes, I am asked a question regarding how to hold a variable at a specific, constant level over a conditional period of time. This question is always asked in a very long convoluted way like "I want the strategy to know what the high of the last pivot was while I'm in a long." or some other variation of wanting a script to remember something from prior bars.
This function is designed to store a price or some numeric level on the bar that your conditional (bool) statements determine that it should be stored. In this construct, you would set conditional statement(s) to flip the 'hold condition' to be true on the next bar, then hold that value until either the "hold condition" is no longer true or the initial conditions trigger again, causing an update to the level that you want to capture.
You still have to come up with the logic for the start condition and hold condition on your own, but I've provided an example that should give you an idea of how to accomplish this and customize/deploy the function for your purposes.
The function will return 'na' when neither the start condition nor hold condition are true. There's multiple ways to implement this and variations on how the level is chosen. I've written extensive notes in the script to guide you through the logic behind the function. My hope is that it will be useful to those trying to build strategies or anyone attempting to get their script to remember a level under given conditions.
In the thumbnail example, the take profit level is defined at the beginning of the trade and held until the take profit order executes. The order execution is a separate matter. However, storing the take-profit level at a static value is key to telling the strategy.exit() function what price to execute a limit exit order at.
Example: strategy.exit("Exit Long", from_entry = "long", qty_percent = 100, limit = stored_value)
Let me know how it works out for you and if I can be of any assistance.
Note: Strategy results are mainly derived from the fact that the strategy is long-only, the NQ only goes up, and there is no stop loss in place. So don't ask for the specific strategy, because unless you're trading a single contract with a $500,000 account, you'll probably get liquidated using this strategy as it is presented.

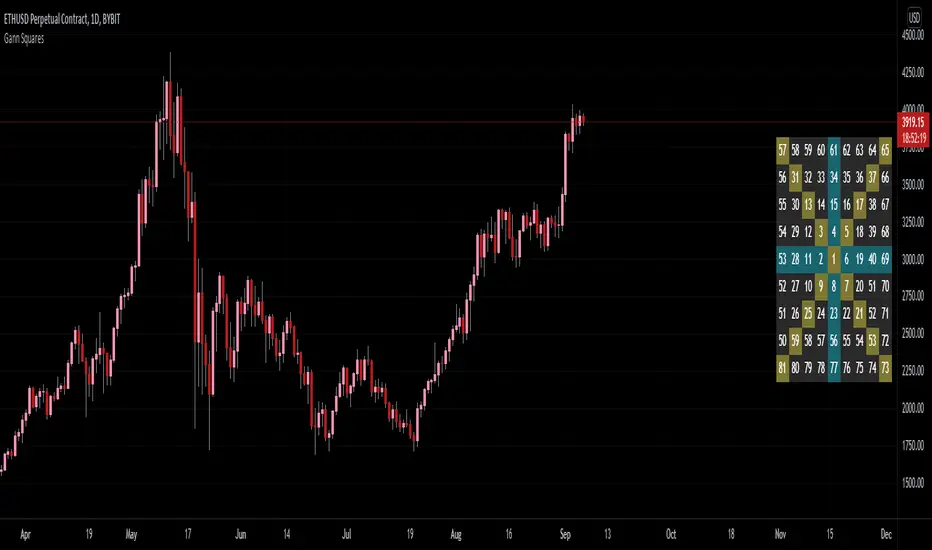
Gann Square of 9Gann's Square's are some of the best known tools created by Gann. His most well known square was his Square of 9.
The reason for this was because of the symmetry 9 had with itself. Gann was able to balance both price and time with this symmetry.
- 9 is the last single-digit and largest number
- You can add anything to 9 and it will give you a natural number
- (9 + 3 = 12); 1 + 2 = 3... (9 + 9 = 18); 1 + 8 = 9... etc.
- Multiplying any number by 9 will have the natural number be 9
- (9 * 6 = 54); 5 + 4 = 9... (9 * 3 = 27); 2 + 7 = 9... etc.
For these reason, Gann claimed that 9 has everything within itself.
Here I have created an on-chart square of 9 including the cardinal and ordinal cross points colored. In the settings you are able to customize the starting value of the table as well as the period movement. In most cases, 81 is not high enough to be useful in charting cases, so I'd recommend printing out your own Gann Square of 9 that goes as high as you need it to go.
THIS IS NOT TRADING ADVICE ; please use your own technical analysis before making any decisions based off of public indicators. Learn more about Gann's Squares before attempting to use them as this script was not meant to give you answers, only the table.
MTF Order Block FinderAn Order Block is a special type of pivot point that satisfies the following requirement:
A Bull/Bear candle followed by X consecutive candles in the opposite direction.
Order Blocks are interesting areas that are frequently revisited and can be treated as Support/Resistance levels.
Often, you can see explosive price rejection of these areas via long wicks, high volume, and rapid price change.
Features
Choose from two themes:
- LIGHT: a classic Red and Green representing Bearish and Bullish OBs, respectively
- DARK: a clean Blue and White scheme
Choose from two drawing styles:
- LINE: three lines representing the High, Low, and Mid price levels of the OB candle
- BOX: a bounded area similar to the "rectangle" tool
Chose a custom timeframe:
- From 1 Minute (useful for Seconds interval) up to 1 Month
Note, this setting is experimental and choosing a timeframe that is extraordinarily large may not function properly.
Filter order blocks with two settings:
- Number of consecutive bars
- Minimum % change of the potential OB bar (default 0.25%)
Keep your charts clean and show only relevant OBs
- Maximum number of Bullish zones to show
- Maximum number of Bearish zones to show
FAQ
Q: How do I trade with this indicator?
A:Personally, I use a fast entry indicator to confirm Long/Short position when price is rejected. I set my SL and TP based on the current Zone and the next one, if available.
Q: Does this repaint?
A:Yes and this is okay! The "Bear" and "Bull" signals are not meant for taking positions, only showing which candle reveals the Order Block. The Zone is much more useful to us and can result in several successful trades in the near future when treated as a support/resistance area.
Q What's the winrate?
A:Hard to say - this isn't a standalone strategy and I haven't been able to properly backtest it quite yet.

[CP]Pivot Boss Candlestick Scanner - No Repainting This indicator is based on the high probability candlestick patterns described in the ’Secrets of a Pivot Boss’ book.
The indicator does not suffer from repainting.
I have kept this indicator open source, so that you can take this indicator and design a complete trading system around it.
Although the patterns have some statistical edge in the markets, blindly using them as Buy/Sell Indicators will certainly result in a heavy loss.
I like some of these setups more than others, and I have listed them in the order of my likeness.
The first one I like the most, the last one, I like the least.
The patterns are universal and work well in both intraday, daily and even larger timeframes.
Signals in the example charts are manually marked by,
Hammer - profitable short signal
Rocket - profitable long signal
X - unprofitable long or short signal
GENERAL USER INPUTS:
These settings exist as the indicator uses ‘Labels’ to mark the patterns and Pine Script limits a maximum of 500 labels on a chart.
If you want to go back in the past and check how the indicator was doing, set the Start and End dates both and check the ’Use the date range above to mark the Candlestick Setups?’ option.
EXTREME REVERSAL SETUP:
This is by far my favorite setup in the lot. Classic Mean Reversion setup.
The logic, as explained in the book, goes like this,
1. The first bar of the pattern is about two times larger than the average size of the candles in the lookback period.
2. The body of the first bar of the pattern should encompass more than 50 percent of the bar’s total range, but usually not more than 85 percent.
3. The second bar of the pattern opposes the first.
The setup works extremely well in high beta stocks like Vedanta VEDL.
Feel free to play with the settings in order to better align this pattern with your favorite stock.
Check out the examples below,
No indicator is perfect, failed patterns are marked with an X.
OUTSIDE REVERSAL SETUP:
My second favorite setup, it is quite good at catching intraday trends.
Here’s the logic,
1. The engulfing bar of a bullish outside reversal setup has a low that is below the prior bar’s low and a close that is above the prior bar’s high. Reverse the conditions for bearish outside reversal.
2. The engulfing bar is usually 5 to 25 percent larger than the size of the average bar in the lookback period.
Settings for this pattern simply reflect these conditions. Feel free to modify them as you wish.
The pattern is pretty powerful and will sometimes help you catch literally all the highs and lows of the market, as shown in the examples of Vedanta VEDL and RELIANCE stocks below.
As usual, this pattern is not PERFECT either.
DOJI REVERSAL SETUP:
Doji candles signify market indecision and this pattern tries to profit off these market conditions.
Logic:
1. The open and close price of the doji should fall within 10 percent of each other, as measured by the total range of the candlestick.
2. For a bullish doji, the high of the doji candlestick should be below the ten-period simple moving average. Vice-versa for bearish.
3. For a bullish doji setup, one of the two bars following the doji must close above the high of the doji. Vice-versa for bearish.
Feel free to modify the settings and optimize according to the stock you are trading.
Don't optimize too much :)
This pattern works brilliantly well on larger intraday timeframes, like 15m/30m/60m.
This pattern also has a higher propensity to give false indications than the two described above.
Doji reversal typically helps to catch larger trend reversals. Check out the examples below from RELIANCE and NIFTY charts,
Note that the RELIANCE chart below is the same as shown for the Outside Reversal Setup above, notice the confluence of Outside
Reversal and Doji Reversal on the 31st August.
Confluence of patterns usually increases the probability of success.
RELIANCE 15m Chart - Pattern can catch nice trends on higher timeframes
NIFTY 15m Chart
WICK REVERSAL SETUP:
This pattern tries to capture candlesticks with large wick sizes, as they often indicate trend reversal when coupled with significant support and resistance levels.
Logic:
1. The body is used to determine the size of the reversal wick. A wick that is between 2.5 to 3.5 times larger than the size of the body is ideal.
2. For a bullish reversal wick to exist, the close of the bar should fall within the top 35 percent of the overall range of the candle.
3. For a bearish reversal wick to exist, the close of the bar should fall within the bottom 35 percent of the overall range of the candle.
This pattern must always be coupled with important support resistance levels, else there will be a lot of false signals.
The chart below is the same NIFTY chart as above with the Wick Reversal candles marked as well.
You can see that there are a lot of false signals, but the price also indicates ’pausing’ at important levels by printing a wick reversal setup.
You can use this information to your advantage when riding a trend.
FINAL WORDS:
Settings for various patterns simply reflect the logic described.
You will probably need to tweak and optimize the pattern settings for the stock that you are trading.
Higher Beta/Higher Volatility stocks are a great choice for these patterns.
Using these patterns at critical support and resistance levels will result in dramatically high accuracy.
Be creative and try to develop a proper system around this indicator, with rules for position sizing, stop loss etc.
You do not have to trade all the patterns. Even trading just one pattern with a proper system is good enough.
DO NOT USE THIS INDICATOR AS A BUY/SELL SYSTEM, YOU WILL LOSE MONEY.
Feel free to drop any feedback in the comments section below, or if you have any unique candlestick patterns that you would like me to code.

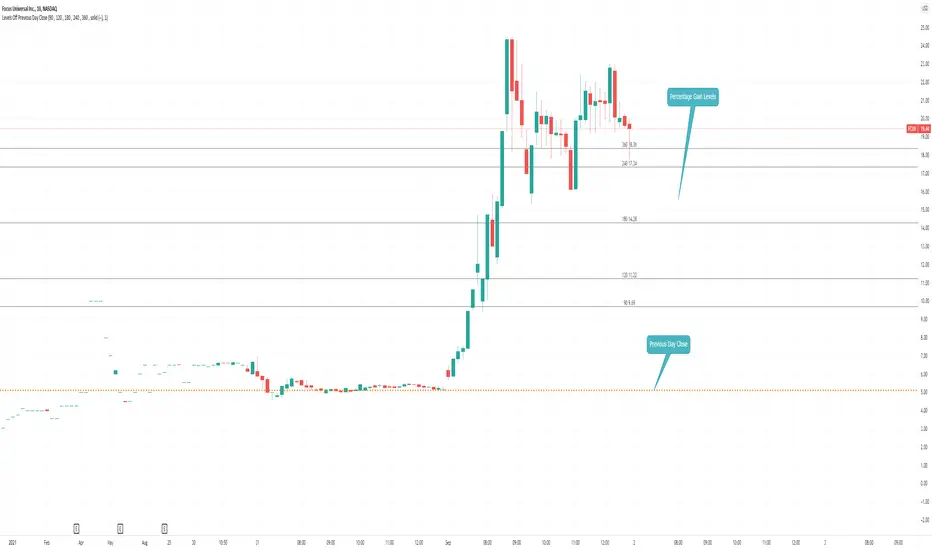
Levels Off Previous Day CloseThis script calculate the 90-120-180-240-360 Percent gains based on the previous day close.
Three Week Tight Pattern IndicatorThree Week Tight Pattern is a consolidation indicator which give extra buy point on strong fundamental stocks. You can read about it from IBD here: www.investors.com

Order Block FinderAfter finding a huge amount of use from TV user's wugamlo script Order Block Finder (Experimental) , I decided to make some much needed upgrades! Added support for plotting the last X number of Order Blocks and am currently working on a multi-timeframe version.
If you'd like to contribute to the MTF analysis portion, that would benefit tons of other scripts and open the possibility to more "MTF Panel" style indicators.
Please visit the original script page (link at top) to review how the indicator is used in trading.

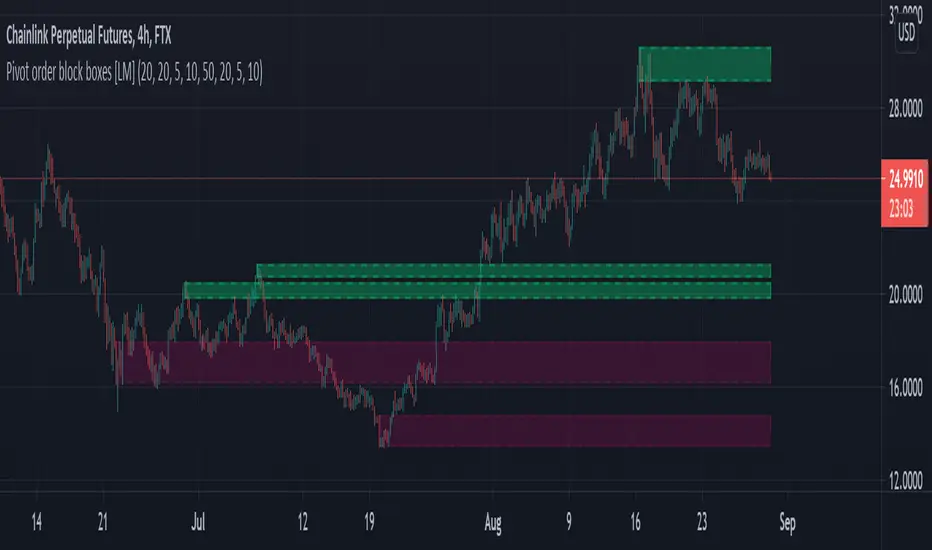
Pivot order block boxes [LM]Hello traders,
let me intoduce you pivot order block boxes. The idea is find the pivot point that within the right side count of candles achieved some percentage change and in that way filter out important pivots. Once the pivot point is found and matches the volatility condition then from the left side of pivot first candle that is up candle for pivot high and down candle for pivot low, could be also the pivot candle itself is selected and rendered high and low of that candle. The premise behind is that those are the levels profesional traders are buying.
It has two settings that you can change at your will, it also enables hide/show particular pivot setting
Hope you will enjoy as I enjoyed to write it.
Lukas
Round numbers above and below(Forex) (Original by DavitBrunet)Round number indicator that draws horizontal lines at each 50 pips for Forex.
The original indicator is developed by DavitBrunet and I have modified enabling to select line style, line color and line width.
Original: ROUND-NUMBERS-INDICATOR-BY-DAVID-BRUNET
Thank you @DavitBrunet for inspiring me!
----------------------
50pips 刻みのキリ番を表示するインジケーターです。(対象は為替商品のみ)
DavitBrunet氏作成のインジケーター"ROUND-NUMBERS-INDICATOR-BY-DAVID-BRUNET"をライン種類、ライン色、ラインの太さを選択できるように変更しました。
オリジナル: ROUND-NUMBERS-INDICATOR-BY-DAVID-BRUNET

Harmonic Trading System Educational (Source Code)This indicator was intended as educational purpose only for Harmonic Patterns using XABCD Pattern Tool.
This indicator was build upon Harmonic Trading : Volume One and Harmonic Trading : Volume Three, written by Scott M Carney.
Harmonic Trading System consist of 3 important elements such as Trade Identification, Trade Execution and Trade Management, each of these element description can be hover at each label.
Harmonic Trading System
1. Trade Identification
This technique use historically proven and repetitive price patterns that focus on overbought and oversold signals generated by price action.
Understanding parameters is critical to define specific opportunities based on individual harmonic pattern including ratio is important.
2. Trade Execution
During harmonic pattern is complete, must focus actual trade within specific time period.
3. Trade Management
Specific Initial Price Objective (IPO) based on risk and opportunity.
Indikator ini bertujuan sebagai pendidikan sahaja untuk Harmonic Pattern menggunakan XABCD Pattern Tool.
Indikator ini dibina berdasarkan buku Harmonic Trading : Volume One dan Harmonic Trading : Volume Three, ditulis oleh Scott M Carney.
Harmonic Trading System mengandungi 3 element penting seperti Trade Identification, Trade Execution dan Trade Management, penerangan setiap elemen boleh didapati dengan meletak mouse pada label.
Harmonic Trading System
1. Trade Identification
Teknik ini menggunakan price patterns yang berulang dan sejarahnya terbukti yang fokus pada signal overbought dan oversold terhasil daripada price action.
Memahami parameter adalah penting untuk mengenalpasti peluang secara spesifik berdasarkan harmonic patern yang tertentu termasuk ratio adalah penting.
2. Trade Execution
Semasa harmonic pattern adalah lengkap, mestilah focus pada trade yang sebenar dalam jangka masa yang spesifik.
3. Trade Management
Initial Price Objective (IPO) secara spesifik berdasarkan risiko dan peluang.
Indicator features :
1. List XAB=CD patterns including ratio and reference page.
2. For desktop display only, not for mobile.
3. Hover to label to display tooltip (example Trade identification).
Kemampuan indikator :
1. Senarai XAB=CD pattern termasuk ratio and rujukan muka surat.
2. Untuk paparan desktop sahaja, bukan untuk mobile.
3. Letak mouse pada labell untuk memaparkan tooltip (example Trade identification).
FAQ
1. Credits / Kredit
Scott M Carney, Harmonic Trading : Volume One
Scott M Carney, Harmonic Trading : Volume Three
2. Pattern and Chapter involved / Pattern dan Bab terlibat
Bullish Harmonic Trade Management Model - Harmonic Trading: Volume One - Page 209
Bearish Harmonic Trade Management Model - Harmonic Trading: Volume One - Page 220
The Harmonic Trading Process - Harmonic Trading: Volume Three - Page 42 to 44
Bullish Phases of Trading - Harmonic Trading: Volume Three - Page 48
Bearish Phases of Trading - Harmonic Trading: Volume Three - Page 50
3. Code Usage / Penggunaan Kod
Free to use for personal usage but credits are most welcomed especially for credits to Scott M Carney.
Bebas untuk kegunaan peribadi tetapi kredit adalah amat dialu-alukan terutamanya kredit kepada Scott M Carney.
Bullish Harmonic Trading System
Bearish Harmonic Trading System

Psychological Levels Redefined With LuckyNickVaPsychological Levels. Also described & speculated as Bank Levels by alot. These are Price levels that the masses are speculated to be more likely to trade based on more than anything else. These levels are great for entries & exits & market manipulation. This custom script is made to highlight price action at these Levels with Barcolor to see the price behavior & the candles that are closing above or below these levels to capture a better perspective to analyze based on this concept. These levels can be considered a form of support & resistance for the retail. Traders which can be used as insight to how the big players leave their footprints at these levels .

Harmonic Pattern Educational Volume 2 (Source Code)This indicator was intended as educational purpose only for Harmonic Patterns using XABCD Pattern Tool.
This indicator was build upon Harmonic Trading : Volume Two, which was continuation from Harmonic Trading : Volume One and The Harmonic Trader, written by Scott M Carney.
Explaination was similar to previous build, build 0 and build 1 .
Volume 2 introduce Harmonic Ratio Progression, which result new patterns such as 5-0 and Alternate Bat.
Indikator ini bertujuan sebagai pendidikan sahaja untuk Harmonic Pattern menggunakan XABCD Pattern Tool.
Indikator ini dibina berdasarkan buku Harmonic Trading : Volume Two, juga sambungan daripada Harmonic Trading : Volume One and The Harmonic Trader, ditulis oleh Scott M Carney.
Penerangan yang sama berdasarkan binaan lepas, build 0 and build 1 .
Volume 2 memperkenalkan Harmonic Ratio Progression, membolehkan pattern baru seperti 5-0 dan Alternate Bat.
Indicator features :
1. List XAB=CD patterns including ratio and reference page.
2. For desktop display only, not for mobile.
Kemampuan indikator :
1. Senarai XAB=CD pattern termasuk ratio and rujukan muka surat.
2. Untuk paparan desktop sahaja, bukan untuk mobile.
FAQ
1. Credits / Kredit
Scott M Carney, Harmonic Trading : Volume One
2. Pattern and Chapter involved / Pattern dan Bab terlibat
Bullish 5-0 - Page 79
Bearish 5-0 - Page 88
Bullish Alternate Bat - Page 103
Bearish Alternate Bat - Page 106
3. Code Usage / Penggunaan Kod
Free to use for personal usage but credits are most welcomed especially for credits to Scott M Carney.
Bebas untuk kegunaan peribadi tetapi kredit adalah amat dialu-alukan terutamanya kredit kepada Scott M Carney.
5-0
Alternate Bat

Harmonic Pattern Educational Volume 1 (Source Code)This indicator was intended as educational purpose only for Harmonic Patterns using XABCD Pattern Tool.
This indicator was build upon Harmonic Trading : Volume One, which was continuation from The Harmonic Trader, written by Scott M Carney.
From the previous build , only Gartley and Butterfly were explained ideally based on The Harmonic Trader.
For this buid, Gartley and Butterfly were further refined and additional patterns such as Bat, Crab and Deep Crab were born based on Harmonic Trading : Volume One.
Explaination was similar to previous build . In addition, Perfect Patterns are added except for Deep Crab.
Indikator ini bertujuan sebagai pendidikan sahaja untuk Harmonic Pattern menggunakan XABCD Pattern Tool.
Indikator ini dibina berdasarkan buku Harmonic Trading : Volume One, juga sambungan daripada The Harmonic Trader, ditulis oleh Scott M Carney.
Berdasarkan binaan lepas , cuma Gartley dan Butterfly diterangkan secara ideal berdasarkan The Harmonic Trader.
Untuk binaan ini, Gartley dan Butterfly telah dihalusi dan pattern tambahan seperti Bat, Crab and Deep Crab telah lahir berdasarkan Harmonic Trading : Volume One.
Penerangan yang sama berdasarkan binaan lepas . Tambahan, Perfect Pattern telah ditambah kecuali untuk Deep Crab.
Indicator features :
1. List XAB=CD patterns including ratio and reference page.
2. For desktop display only, not for mobile.
Kemampuan indikator :
1. Senarai XAB=CD pattern termasuk ratio and rujukan muka surat.
2. Untuk paparan desktop sahaja, bukan untuk mobile.
FAQ
1. Credits / Kredit
Scott M Carney, Harmonic Trading : Volume One
2. Pattern and Chapter involved / Pattern dan Bab terlibat
Bullish Ideal Bat - Page 72
Bearish Ideal Bat - Page 83
Bullish Perfect Bat - Page 91
Bearish Perfect Bat - Page 94
Bullish Ideal Gartley - Page 99
Bearish Ideal Gartley - Page 106
Bullish Perfect Gartley - Page 115
Bearish Perfect Gartley - Page 118
Bullish Ideal Crab - Page 123
Bearish Ideal Crab - Page 130
Bullish Perfect Crab - Page 143
Bearish Perfect Crab - Page 146
Bullish Ideal Deep Crab - Page 137
Bearish Ideal Deep Crab - Page 140
Bullish Ideal Butterfly - Page 150
Bearish Ideal Butterfly - Page 158
Bullish Perfect Butterfly - Page 163
Bearish Perfect Butterfly - Page 166
3. Code Usage / Penggunaan Kod
Free to use for personal usage but credits are most welcomed especially for credits to Scott M Carney.
Bebas untuk kegunaan peribadi tetapi kredit adalah amat dialu-alukan terutamanya kredit kepada Scott M Carney.
Ideal / Perfect Bat
Ideal / Perfect Gartley
Ideal / Perfect Crab
Ideal Deep Crab
Ideal / Perfect Butterfly

Harmonic Pattern Educational Volume 0 (Source Code)This indicator was intended as educational purpose only for Harmonic Patterns using XABCD Pattern Tool.
Gartley and Butterfly patterns were ideal patterns explained from The Harmonic Trader written by Scott M Carney.
Some values are further updated later in Harmonic Trading: Volume Three, also by Scott M Carney.
The Harmonic Trader book was also known as Harmonic Trading: Volume Zero.
Usually Bullish Patterns show as "M" shape while Bearish Patterns show as "W" shape.
";" indicates range, example : 1.27;1.618 meaning that value between 1.27 to 1.618.
Indikator ini bertujuan sebagai pendidikan sahaja untuk Harmonic Pattern menggunakan XABCD Pattern Tool.
Pattern Gartley dan Butterfly, juga sebagai pattern ideal telah diterangkan dari buku The Harmonic Trader ditulis oleh Scott M Carney.
Beberapa nilai kemudiannya telah dikemaskini dalam Harmonic Trading: Volume Three, juga oleh Scott M Carney.
Buku The Harmonic Trader book juga dikenali sebagai Harmonic Trading: Volume Zero.
Kebiasaanya Bullish Pattern tunjuk sebagai bentuk "M" manakala Bearish Pattern tunjuk sebagai bentuk "W".
";" menunjukkan range, contoh : 1.27;1.618 bermaksud nilai 1.27 hingga 1.618.
Indicator features :
1. List XAB=CD patterns including ratio and reference page.
2. For desktop display only, not for mobile.
Kemampuan indikator :
1. Senarai XAB=CD pattern termasuk ratio and rujukan muka surat.
2. Untuk paparan desktop sahaja, bukan untuk mobile.
FAQ
1. Credits / Kredit
Scott M Carney, The Harmonic Trader
2. Pattern and Chapter involved / Pattern dan Bab terlibat
Bullish Ideal Gartley - Page 160
Bearish Ideal Gartley - Page 171
Bullish Ideal Butterfly - Page 194
Bearish Ideal Butterfly - Page 204
3. Code Usage / Penggunaan Kod
Free to use for personal usage but credits are most welcomed especially for credits to Scott M Carney.
Bebas untuk kegunaan peribadi tetapi kredit adalah amat dialu-alukan terutamanya kredit kepada Scott M Carney.
Bullish (M) / Bearish (W) Ideal Gartley
Bullish (M) / Bearish (W) Ideal Butterfly

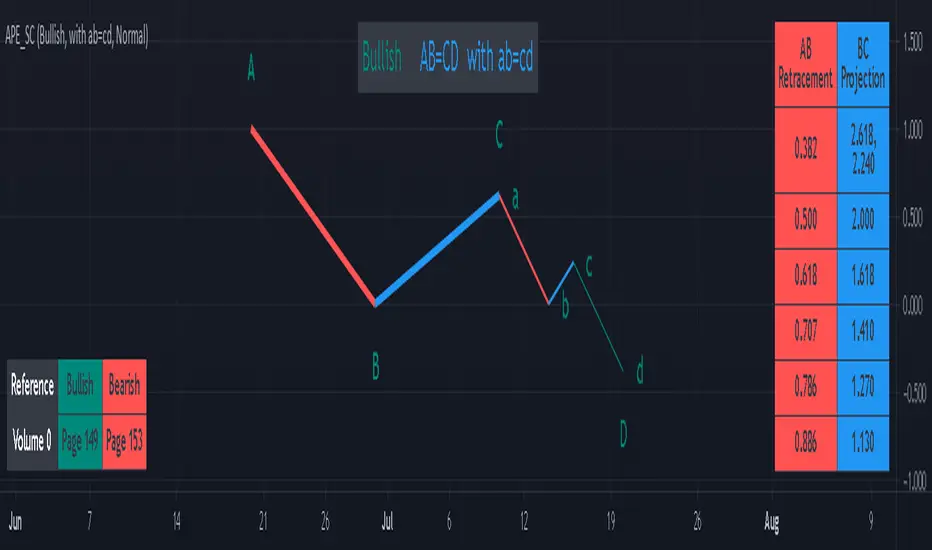
AB=CD Pattern Educational (Source Code)This indicator was intended as educational purpose only for AB=CD Patterns.
AB=CD Patterns were explained and modernized starting from The Harmonic Trader and Harmonic Trading: Volume One until Volume Three written by Scott M Carney.
Indikator ini bertujuan sebagai pendidikan sahaja untuk AB=CD Pattern.
AB=CD Patterns telah diterangkan dan dimodenkan bermula dari The Harmonic Trader dan Harmonic Trading: Volume One hingga Volume Three ditulis oleh Scott M Carney.
Indicator features :
1. List AB=CD patterns including ratio and reference page.
2. For desktop display only, not for mobile.
Kemampuan indikator :
1. Senarai AB=CD pattern termasuk ratio and rujukan muka surat.
2. Untuk paparan desktop sahaja, bukan untuk mobile.
FAQ
1. Credits / Kredit
Scott M Carney
Scott M Carney, Harmonic Trading: Volume One until Volume Three
2. Pattern and Chapter involved / Pattern dan Bab terlibat
Ideal AB=CD - The Harmonic Trader - Page 118 & 129
Standard AB=CD - The Harmonic Trader - Page 116, 117, 127 & 128, Harmonic Trading: Volume One - Page 42, 51, Harmonic Trading: Volume Three - Page 76 & 78
Alternate AB=CD - The Harmonic Trader - Page 142 & 145, Harmonic Trading: Volume One - Page 62, 63
Perfect AB=CD - Harmonic Trading: Volume One - Page 64 & 66
Reciprocal AB=CD - Harmonic Trading: Volume Two - Page 74 & 76
AB=CD with ab=cd - The Harmonic Trader - Page 149 & 153
AB=CD with BC Layering Technique - Harmonic Trading: Volume Three - Page 81 & 84
3. Code Usage / Penggunaan Kod
Free to use for personal usage but credits are most welcomed especially for credits to Scott M Carney.
Bebas untuk kegunaan peribadi tetapi kredit adalah amat dialu-alukan terutamanya kredit kepada Scott M Carney.
Bullish / Bearish Ideal AB=CD
Bullish / Bearish Standard AB=CD
Bullish / Bearish Alternate AB=CD
Bullish / Bearish Perfect AB=CD
Bullish / Bearish Reciprocal AB=CD (Additional value for reciprocal retracement 3.140 and 3.618)
Bullish / Bearish AB=CD with ab=cd
Bullish / Bearish AB=CD with BC Layering Technique
Multi ZZ - Support/ResistenceExperimental and probably can be improved further.
Method of deriving support/resistence is as follows:
Calculate Zigzags and start pushing them to SR array as and when they form
If any of the existing item is within the small distance - merge them. ATR is used to find if the prices are close by.
Whenever we merge two pivots, strength of support keeps increasing. This means, price has bounced off this point more time. Hence, keep track of number of pivots merged together.
Keep removing old pivots which are far away based on Loopback input
And that's all we got the full list of support and resistence points.
Now, to filter insignificant pivots, chose only those points which has been merged by more than Min Pivots input. Width of the support/resistence lines also will be thicker for the pivots which has more count. Hence thicker line imply strong support and resistence whereas the thinner ones are minor ones.
Price ActionFirst, you have to know price action, RTM price action Handbook could help you
this indicator shows you base and momentum candles
base candles could be zones of trade that show you fighting of bulls and bears, and momentum candles could show the power of those zones.
Base candles are white in the chart, and you can place your order at the good zone.
Rally candles and drop candles are momentum candles, and bold rally and bold drop show that it is more powerful than its before candle.
Zigzag compression is one way that shows the compression in trend.
it looks like the Wedges pattern at classic technical that shows pending orders are closed, so the target zone could be powerful to reverse the trend.
Black background of candle means that candle doesn't reach its before candle and so it is poor candle, I named it domination.
It is better to do not trade at poor candles.
At the end, I find Price action the best way to trade, and it makes you free of other indicator, even volume indicator.
This indicator is good for those who use price action strategy to trade and those who want to learn the price action.
It could be so helpful and reliable way to find the zones, and place buy or sell order and the target, specially for scalping.

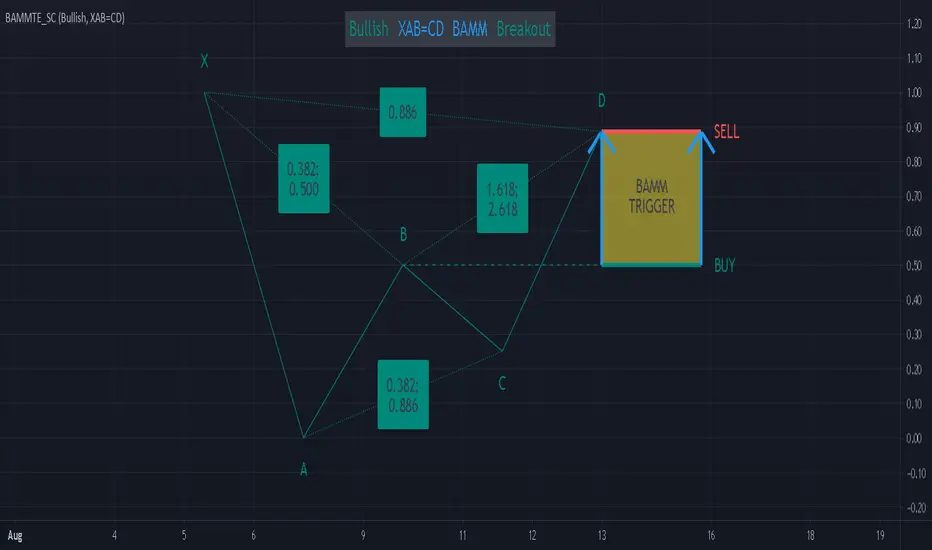
Bat Action Magnet Move BAMM Theory Educational (Source Code)This indicator was intended as educational purpose only for BAMM, which also known as Bat Action Magnet Move.
Indikator ini bertujuan sebagai pendidikan sahaja untuk BAMM, juga dikenali sebagai Bat Action Magnet Move.
BAMM is usually used for Harmonic Patterns such as XAB=CD (Bat Pattern) and AB=CD (0.5 AB=CD Pattern) - Chapter 5.
BAMM also can be used for other Harmonic Pattern with the help of RSI Divergence, hence become RSI BAMM - Chapter 6.
BAMM kebiasaanya digunakan untuk Harmonic Pattern seperti XAB=CD (Bat Pattern) dan AB=CD (0.5 AB=CD Pattern) - Chapter 5.
BAMM juga boleh digunakan untuk Harmonic Pattern lain dengan bantuan RSI Divergence, menjadi RSI BAMM - Chapter 6.
FAQ
1. Credits / Kredit
Scott M Carney,
Scott M Carney, Harmonic Trading: Volume Two (Chapter 5 & Chapter 6)
Bullish XAB=CD BAMM Breakout - Page 144
Bearish XAB=CD BAMM Breakdown - Page 148
Bullish AB=CD BAMM Breakout - Page 153
Bearish AB=CD BAMM Breakdown - Page 156
2. Code Usage / Penggunaan Kod
Free to use for personal usage but credits are most welcomed especially for credits to Scott M Carney.
Bebas untuk kegunaan peribadi tetapi kredit adalah amat dialu-alukan terutamanya kredit kepada Scott M Carney.
2.0 AB=CD Pattern
XAB=CD Bat Pattern