Scalp Tool
This script is primarily intended as a scalping tool.
The theory of the tool is based on the fact that the price always returns to its mean.
Elements used:
1. VWMA as a moving average. VWMA is calculated once based on source close and once based on source open.
2. the bands are not calculated like the Bollinger Band, but only a settlement is calculated for the lower bands based on the Lows and for the upper bands based on the Highs. Thus the bands do not become thicker or thinner, but remain in the same measure to the mean value above or below the price.
3. a volume filter on simple calculation of a MA with deviation. Therefore, it can be identified if a volume breakout has occurred.
4. support and resistance zones which are calculated based on the highs and lows over a certain length.
5. RSI to determine oversold and overbought zones. It also tries to capture the momentum by using a moving average (variable selectable) to filter the signals. The theory is that in an uptrend the RSI does not go below 50 and in a downtrend it does not go above 50.
However, this can be very different depending on the financial instrument.
Explanation of the signals:
The main signal in this indicator Serves for pure short-term trading and is generated purely on the basis of the bands and the RSI.
Only the first bands are taken into account.
Buy signal is generated when the price opens below the lower band 1 and closes above the lower band 1 or the RSI crosses a value of 25 from bottom to top.
Sell signal is generated when the price opens above the Upper Band 1 and closes below the Upper Band 1 or the RSI crosses a value of 75 from top to bottom.
The position should be closed when the price hits the opposite band. Alternatively, it can also be closed at the mean.
Other side signals:
1. breakouts:
The indicator includes 2 support and resistance zones, which differ only in length. For the breakout signals, the short version of the R/S is used. A signal is generated when the price breaks through the zones with increased volume. It is then assumed that the price will continue to follow the breakout.
The values of the S/R are adjustable and marked with "BK".
The value under Threshold 2 defines the volume breakout. 4 is considered as the highest value. The smaller the value, the smaller the volume must be during a breakout.
2. bounce
If the price hits a S/R (here the long variant is used with the designation "Support" or "Resistance") and makes a wick with small volume, the script assumes a bounce and generates a Sell or Buy signal accordingly.
The volume can be defined under "Threshold".
The S/R according to the designation as well.
Combined signals:
If the value of the S/R BK and the S/R is the same and the bounce logic of the S/R BK applies and an RSI signal is also generated, a signal is also plotted.
Here the idea was to get very strong signals for possible swing entries.
4. RSI Signals
The script contains two RSI.
RSI 1:
Bullish signal is generated when the set value is crossed from the bottom to the top.
Bearish signal is generated when the set value is crossed from the top to the bottom.
RSI 2:
Bullish signal is generated when the set value is crossed from the top to the bottom.
Bearish signal is generated when the set value is crossed from bottom to top.
For RSI 2 the theory is taken into account according to the description under Used elements point 5
Optical trend filter:
Also an optical trend filter was generated which fills the bands accordingly.
For this the VWMA is used and the two average values of the band.
Color definition:
Gray = Neutral
Red = Bearish
Green = Bullish
If the mean value is above the VWMA and the mean value based on the closing price is above the mean value based on the open price, the band is colored green. It is a bullish trend
If the mean value is below the VWMA and the mean value based on the closing price is below the mean value based on the open price, the band is colored red.
The band is colored gray if the mean value is correspondingly opposite. A sideways phase is assumed.
The script was developed on the basis of the pair BTCUSD in the 15 minute chart and the settings were defined accordingly on it. The display of S/R for forex pairs does not work correctly and should be hidden. The logic works anyway.
When using the script, all options should first be set accordingly to the asset and tested before trading afterwards. It applies of course also here that there is no 100% guarantee.
Also, a strong breakout leads to false signals and overheating of the indicator.
Supportandresitance

Psychological levels (Bank levels) PsychoLevels v3 - TartigradiaPsychological levels (Bank levels) plots the closest "round" price levels above and below current price, based on neuroscience research of how humans intuitively calculate in logarithms.
Psychological levels, also called bank levels, are "round" price numbers, by truncating after the nth leftmost digits, around which price often experience resistance or support, because traders and investors tend to set orders around these round numbers.
The calculation done here is fully automatic and dynamic, contrary to other similar scripts, this one uses a mathematical calculation that extracts the 1, 2 or 3 leftmost digits and calculate the previous and next level by incrementing/decrementing these digits. This means it works for any symbol under any price range.
This approach is based on neuroscience research, which found that human brains intuitively approximate numbers on a logarithmic scale, adults and children alike, and similarly to macaques, for more info see Numerical Cognition , Weber-Fechner Law , Zipf law .
For example, if price is at 0.0421, the next major price level is 0.05 and medium one is 0.043. For another asset currently priced at 19354, the next and previous major price levels are 20000 and 10000 respectively, and the next/previous medium levels are 20000 and 19000, and the next/previous weak levels are 19400 and 19300.
IMPORTANT: Please enable "Scale price chart only" in the chart's scale's options, as otherwise major levels may make the chart's scale very small and hard to read.
How it works
At any time, there are 3 levels of strength (1 leftmost digit, 2 leftmost digits, 3 leftmost digits) represented by different sizes, and 3 directional levels for each of these strengths (level above, level below, and half-level) represented by different colors and positions, around current price.
Indeed, contrary to other similar price levels scripts, we do not plot ALL price levels at all times, because otherwise the chart becomes wayyy too cluttered, and also it's highly processing intensive to plot so many lines. So we here use a dynamical approach: we plot only the relevant levels, the closest ones according to current price.
Hence, when a level disappears, it does not mean that it does not exist anymore, but simply that we are not drawing it right now because it is not pertinent for the current price movement (ie, too far away).
Breakouts can be detected in two different ways depending on if SMA is set to a value higher than 1 or not: if SMA == 1, then there is no smoothing, so the levels adapt instantaneously to the current price, so to detect breakout, you should refer to the levels at the previous tick and whether they were broken by current tick's price; if SMA > 1, then there is some smoothing, and so the levels will stay in-place even if there is a breakout, so it's easier to spot breakouts without having to look at the previous ticks, but on the other hand you won't see the new levels for the new price range until after a few more ticks for the smoothing window to adapt. Hence, by default, smoothing is disabled, so that you can see the currently pertinent levels at all time, even right after or during a breakout.
By default, the strong above level is in green, strong below level is in red, medium above level is in blue, medium below level is in yellow, and weak levels aren't displayed but can be. Half levels are also displayed, in a darker color. Strong levels are increments of the first leftmost digit (eg, 10000 to 20000), medium levels are increments of the second leftmost digit (eg, 19000 to 20000), and weak levels of the third leftmost digit (eg, 19100 to 19200). Instead of plotting all the psychological levels all at once as a grid, which makes the chart unintelligible, here the levels adapt dynamically around the current price, so that they show the above/below/half levels relatively to the current price.
Indeed, "half-levels" are also displayed (eg, medium level can also display 19500 instead of only 19000 or 20000). This was made because otherwise the gap between two levels was too big, especially for the strongest levels (eg, there was no major level between 20000 and 30000, but with a half-step we also get a half-level at 25000, and empirically price tends to respect these half levels - I also tried quarter levels but empirically the results were not good). In addition to this hard-coded half-level, you can also create more subdivisions (eg, quarter levels) by setting the simple moving average to a value higher than 1.
The script can be made to run on the daily timeframe whatever the current chart's timeframe is, to reduce the variability in levels, to make it less noisy than intraday price movement. But by default, the chart resolution is used, because I empirically found that the levels found with this indicator work on all time resolutions quite well.
The step can be adjusted to increase the gap between levels, eg, if you want to display one every 2 levels then input step = 2 (eg, 22000, 24000, 26000, etc), or if you want to display quarter levels, input 0.25 (eg, 22000, 22250, 22500, etc). The default values should fit most use cases and cover most psychological levels.
How to read
Focust first on bigger dotted levels, they are stronger and more likely to cause a rebound or a major event or price to stay at this level.
Remember that it's not enough to just look at levels, the context is important, because levels have various effects depending on current price movement: if price is above a level, the level is a support on which price can rebound; if price is below a level, the level is a resistance on which price can rebound (or break); and finally sometimes price also stays hovering around a level for some time.
Levels closer to 9 are less weaker, and levels closer to 0 are stronger, according to Zipf law. This is now reflected since v3 in the transparency, levels that are closer to 9 will be more transparent.
The switch in color for the same level illustrates how a level switches from being a support to a resistance and inversely. Eg, if a major level turns from green to red, then it changed from being a resistance (above) to a support (below).
As is well known in trading, longer standing levels are stronger. This indicator provides a direct illustration: in practice, the number of consecutive dots on the same line influences the strength of the level: the longer the chain of dots, the more you can expect this price level to be significant. The length does not mean the level will necessarily hold, but that other traders are likely to monitor if it holds, and if not then price will break down. Hence, longer levels are good spots to place stop losses, or to enter trades depending on your strategy. In general, a single dot is not enough to consider a level significant, but 2 or more is a good enough level, and 10+ is a strong level. Intuitively, this makes sense, and is what pro traders do: the longer a level is tested, the stronger it is. This indicator can visually represent this intuition and allows to use it as a more systematic trading signal.
Motivation
I initially made the first version of the PsychoLevels indicator mainly to train with PineScript, but I found it surprisingly accurate to define levels that are respected by price movements. So I guess it can be useful for new traders and experienced traders alike, as it's easy to forget that psychological levels can often be as strong if not stronger than technical levels. It can also be used to quickly screen other minor assets for trading opportunities. For example, a hybrid strategy would be to manually define levels on BTCUSD but using this script to automatically define levels in crypto altcoins and quickly screen them for a trade opportunity that can be greater than with BTCUSD but with the same trend.
Personally, although initially I did not believe an automated tool would work well for this purpose, I could now empirically verify that it is quite reliable for the purpose of detecting levels, and so I use it all the time to find the levels automatically and help me monitor them like a hawk, so that I only have to draw uber major levels, the ones that last between cycles and that are hard to autodetect, but otherwise all daily/weekly levels are usually covered. However, trendlines must still be drawn manually or with another indicator (but note that up to now I have found none that worked well enough), as PsychoLevels only draws levels (ie, horizontal lines, not oblique ones!).
Differences with the previous version PsychoLevels v2
price levels now have a transparency according to their importance for the human brain: numbers closer to 9 are weaker, and numbers closer to 0 are stronger and represent a major psychological threshold (eg, that's why prices marked as $9.99 sell better than $10.00). This option can be disabled to get the exact same behavior as v2.
modularized and typed code
PsychoLevels v2 can be found here:

NSDT Custom High and Low LinesFirst, the credit for the original script to plot a High and Low between a certain time goes to developer paaax.
I took that idea, converted it to Pinescript V5, cleaned up the code, and added a few more lines so you can plot different levels based on time of day.
Published open source like the original.
The example shown has:
Blue - plotting from the start of the Futures Asian session to the start of the Futures USA Session. (6:00PM - 9:30AM Eastern)
Yellow - plotting from the start of the Futures Europe session to the start of the Futures USA Session. (3:00AM - 9:30AM Eastern)
Green - plotting from the start of the Futures US Premarket session to the start of the Futures USA Session. (8:00AM - 9:30AM Eastern)
These are great levels to use for breakouts and/or support and resistance.
Combine these levels with the 5 min Open Range levels, as you have some good trades.
Each of the three sessions have individual start and end times that can be modified by the trader, so you can easily mark off important areas for your style of trading.

Autodrawn Support and Resistance LevelsAutodrawn Support and Resistance Levels is an indicator that helps traders identify key support and resistance levels on a chart. These levels are important because they can help traders make decisions about when to buy or sell an asset. The indicator uses three lookback periods to identify recent highs and lows and then draws lines at the highest support and resistance levels for those periods. The lines are color-coded, with green indicating support and red showing resistance. The thickness of the lines can also be adjusted to match a trader's preferences. The lines are updated automatically as new data is added to the chart, making it easy for traders to identify new levels of support and resistance as they emerge. Overall, this indicator is a helpful tool for traders who want to quickly and easily identify critical levels on a chart to inform their trading decisions.
By having one lookback period on a medium-term timeframe (e.g. 50), a short-term timeframe (e.g. 10), and a long-term timeframe (e.g. 300), it can be easier to identify support and resistance levels that are relevant to the current market trend, and see multiple critical levels at once. This can help you make more informed decisions about when to enter and exit trades, as well as where to set stop-loss orders. It may be valuable to consider that as shorter-term and longer-term support/resistance levels become closer together, it is more likely for there to be a reversal in the opposite direction.
This indicator is less useful in markets that have strong trends, where the horizontal support and resistance levels are likely to be less useful than trend line support and resistance levels, however it works well in sideways trading markets
Note: reupload since previous description violated tradingview rules

Support & Resistance AnalyzerThis script analyzes the effectiveness of support and resistance (S&R) levels by examining their impact on price action. It measures the compression or reversion of price action around these levels to determine their overall performance.
To use the script, simply copy and paste the Moving Average (MA) or desired level script that you want to test. The results will be displayed in the data window for easy reference.
The script provides a metric called S&R overperformance or underperformance, which offers a concise summary of the S&R level's effectiveness. This metric is determined by comparing the price action near the S&R level to the overall price action throughout the dataset.
Additionally, the script includes specific metrics to further illustrate how the S&R level affects the price. These metrics provide more detailed insights into the S&R's influence on price action, enabling users to make better-informed decisions when applying S&R levels to their trading strategies.

Multi-Timeframe High Low (@JP7FX)Multi-Timeframe High Low Levels (@JP7FX)
This Price Action indicator displays high and low levels from a selected timeframe on your current chart.
These levels COULD represent areas of potential liquidity, providing key price points where traders can target entries, reversals, or continuation trades.
Key Features:
Display high and low levels from a selected timeframe.
Customize line width, colors for high and low levels, and label text color.
Enable or disable the display of high levels, low levels, and labels.
Receive alerts when the price takes out high or low levels.
How to use:
It is important to note that using this indicator on it's own is not advisable. Instead, it should be combined with other tools and analysis for a more comprehensive trading strategy.
Possibly look to use my MTF Supply and Demand Indicator to look for zones to trade from at these levels?
If the price breaks above a high level, you might consider entering a long position, with the expectation that the price will continue to rise. Conversely, if the price breaks below a low level, you may think about entering a short position, anticipating further downward movement.
On the other hand, you can also use high or low levels to look for reversal trades, as these areas can represent attractive liquidity zones.
By identifying these key price points, you could take advantage of potential market reversals and capitalise on new trading opportunities.
Always remember to use this indicator in conjunction with other technical analysis tools for the best results.
Additionally, you can enable alerts to notify you when the price takes out high or low levels, helping you stay informed about significant price movements.
This indicator could be a valuable tool for traders looking to identify key price points for potential trading opportunities.
As always with the markets, Trade Safe :)

Rail Line Levels [s3]Plots support/resistance lines based on a neutral signal (white portion) of the Rail Line (variable moving average) for a period of time designated by the user (defaults to 9 bars). Support/Resistance lines will be removed after a period of tests and can be determined by the user (defaults to 26). Support/Resistance is deemed not as important or strong after several touches or tests. The trailer uses a combination of the calculation for the Rail Line (variable moving average) and an ATR to show the overall trend direction.
The indicator is centered around a Variable Moving Average. The Variable Moving Average (VMA) is a study that uses an Exponential Moving Average being able to automatically adjust its smoothing factor according to the market volatility.
In addition to the VMA, the indicator makes use of the ATR which measures market volatility by decomposing the entire range of an asset price for that period. The true range is taken as the greatest of the following: current high less the current low; the absolute value of the current high less the previous close; and the absolute value of the current low less the previous close.

Gann Square of 9Here it is, the Gann Square of 9. An easy-to-use tool to determine possible support and resistance levels. Input a starting value to be the starting point of the square. Then the increasing value will be used to get the value of each cell on the table.
It's possible to show the diagonals and a spot number to see what cell value the current price is close to. The diagonals are known to be the key support and resistance levels in Gann's analysis. That way, it's possible to show those diagonals in the chart for easy reading of those levels.

The Perfect Support & ResistanceSupport & Resistance drawn based on overbought & oversold RSI . where the overbought acts as resistance and oversold acts as support.
It has 2 levels (for support and resistance - i call them level_n_high or level_n_low) for each lookback period. it checks the highest pivot and the lowest pivot based on the lookback period then we compare if rsi is higher than the highest pivot or the lowest pivot and we also check if rsi is overbought or oversold and if the statement is true, then we assign the high to the variable level_n_high or level_n_low. n being the number of levels. in total there are 5 levels with both high & low for 5 lookback periods. This is basically how the code works.
these levels can be accessed at any timeframe. the defaults are 5m and 30m.
RSI settings: (default)
-------------------
length - 14
source - close
overbought - 70
oversold - 30
lookback settings: (default)
---------------------
lookback_0 - 200
lookback_1 - 100
lookback_2 - 50
lookback_3 - 20
lookback_4 - 10
Timeframe Settings: (default)
-------------------
htf1 - 5m
htf2 - 30m
Enjoy!

Relative Price Volume
Relative Price Volume is an indicator which shows anomalies between price and volume on a chart over a given period. The goal is to identify potential reversal and/consolidation areas for price as it relates to volume. It is a simple variation of a Volume at Price indicators. It can also be used to mark potential support and resistance lines on the chart as the areas it signals is where the price battles are waged.
Settings:
Period = length for which to calculate average candle body and average volume
Long Factor = relative size multiplier to determine if a candle is larger than average or if volume is higher than average
Short Factor = relative size multiplier to determine if a candle is smaller than average or if volume is lower than average
Anomaly Conditions
1. If a candle is larger than average and volume is lower than average, then this is an anomaly, and we should be on alert for a change in momentum.
2. if a candle is smaller than average and volume is higher than average, then this too is an anomaly and should put us on alert.
The indicator will draw a cross on the chart indicating the candle is that is flashing the warning that the run is done and a potential consolidation and/or reversal is pending. Used in conjunction with support and resistance levels this could signal a time to enter or exit a trade.
The default size factors considers a candle or volume:
1. Larger than average if it is 60% or more (.6) larger than average.
2. Smaller than average if it is 40% or less (.4) smaller than average.
Hope this helps! Happy trading!
Dynamic Linear Regression Oscillator | AdulariDescription:
This dynamic linear regression oscillator visualizes the general price trend of specific ranges in the chart based on the linear regression calculation, it automatically determines these ranges with pivot detection. The central line of the indicator is the baseline of the linear regression itself. This is a good tool to use to determine when a price is unusually far away from its baseline. The lines above or below it are overbought and oversold zones. These zones are based on the high or low of the range, in combination with the set multipliers.
The overbought and oversold lines indicate support and resistance; when the prices stay outside these levels for a significant period of time, a reversal can be expected soon. When the oscillator's value crosses above the signal or smoothed line the trend may become bullish. When it crosses below, the trend may become bearish.
This indicator is quite special, as it first determines price ranges using pivot detection. It then uses the middle of the range to determine how far the current price is from the baseline. This value is then rescaled compared to a set amount of bars back, putting it into relevant proportions with the current price action.
How do I use it?
Never use this indicator as standalone trading signal, it should be used as confluence.
When the value crosses above the signal this indicates the current bearish trend is getting weak and may reverse upwards.
When the value crosses below the signal this indicates the current bullish trend is getting weak and may reverse downwards.
When the value is above the middle line this shows the bullish trend is strong.
When the value is below the middle line this shows the bearish trend is strong.
When the value crosses above the upper line this indicates the trend may reverse downwards.
When the value crosses below the lower line this indicates the trend may reverse upwards.
Features:
Oscillator value indicating how far the price has currently deviated from the middle of the range. Proportioned to data from a set amount of bars ago.
Signal value to indicate whether or not the price is abnormally far from the middle of the range.
Horizontal lines such as oversold, overbought and middle lines, indicating possible reversal zones.
Automatic range detection using pivots.
Built-in rescaling functionality to ensure values are proportionate with the latest data.
How does it work? (simplified)
1 — Calculate the middle of the range.
2 — Define whether the current price is above the middle of the range or below.
3 — If above the middle of the range, calculate the difference of the current high and the middle line. If below, calculate the difference of the current low and the middle line.
4 — Smooth the value using a set moving average type.
5 — Rescale the value to proportionate it with the latest data.

Support Resistance - Dynamic v2 w/ Timeframe optionThis script is a modification from the awesome "Support Resistance - Dynamic v2" by @LonesomeTheBlue
This script is very similar to the original indicator mentioned above, but with a modification that, in my opinion, would be very useful for many traders. It enables the option to choose different timeframe to calculate the S/R levels. Very often, traders would like to use higher timeframes to define S/R levels, rather than using the same timeframe that they are trading at. For example, if trading at 5min, we often use 15min, 30min or 1hr timeframe to define our S/R levels.
For example, below shows S/R levels from three different timeframes:
Hope you find value in this indicator~ Enjoy~
Multi Timeframe Support and Resistance [ABA Invest]About
Automatic level of support and resistance ( SnR ) in the chart. It helps users to decide where is the level of SnR and also optimize the level by changing the input base on their needs
Input:
Pivot - The number of bars left and right side of the pivot to choose how detailed the SnR level
Type - To draw the line on the candle wick endpoints or body
Timeframes option - you can choose to display other timeframes beside the current chart timeframe
Adaptive moving average - to help users identify breaks of the SnR level with the moving average line
Line length - length of the moving average line if you activate the adaptive moving average option
How to use:
Attach the indicator to the chart and then you will find the red and green lines. Red line work as resistance level and green line works as support level and also you can merge adjacent line levels into an area of SnR.
The Adaptive moving average (AMA) line function is to see the break of SnR level and prepare for the setup.
Buy setup: AMA line break resistance level, when the price retest the support (the previous break resistance) we can enter buy trade
Sell setup: AMA line break support level, when the price retest the resistance (the previous break support) we can enter sell trade
Note: Don’t blindly follow the AMA trend signal

Support & Resistance Trendlines with PP + Fib. Channel█ Support & Resistance Trendlines with Pivot Points + Fibonacci Channel
This script automatically draw support and resistance trend lines based on pivot points and add a fibonacci channel.
It will show potential patterns with the help of support and resistance lines as well as breakout target and pullback entry with the fibonacci extension and retracement levels.
It is based on atolelole's script, I only made it more configurable so please check out his script.
I added the possibility to change values and add additional retracement and extension levels.
I also made it customizable with the possibility to change lines color, width and style.

Pivot mtf semaphore support&resistance [LM]Hello Traders,
I would like to introduce you pivot semaphore mtf support&resistance levels. The idea is the same as my other S/R scripts to have a look at the important levels. The Semaphore is used to spot future multi-level Supports and Resistance zones. It is also useful to spot HL or LL or HH or LH zones. The script is based on amazing work of @LucF so really big thanks for your work on mtf line offsetting.
It has three settings:
First two settings are for higher timeframes
Third setting is setting for pivots on current timeframe
!!!! Very important is there is limitation in pinescript how many candles you can look back(4999) if you choose timeframes that are very distant from each other there is a chance that those lines won't show up
Hopefully you will enjoy
Cheers, Lukas

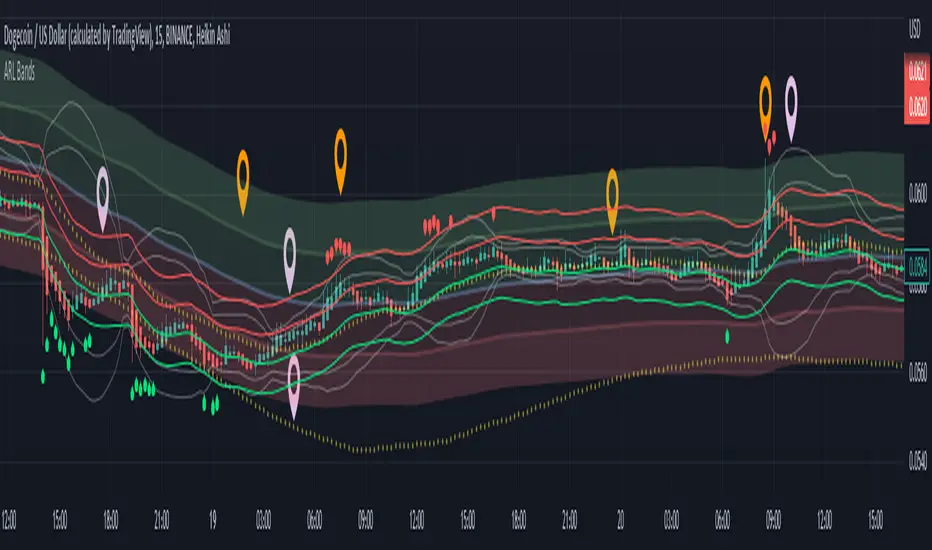
Adaptive Rebound Line Bands (ARL Bands)These bands consist of 4 ARLs (See: Adaptive Rebound Line ('ARL'/AR Line)) that help accurately spot price rebounds.
It is excellent for 15 minute scalping and price-action trading.
See notes in the picture above for more details.
Note: "Top Deviation" is the deviation of the top 'ARL', "High Deviation" is for the high 'ARL', etc.
Support and resistance zonesDiscretionary traders often use support and resistance zones that are based on past price action of the instrument traded.
This simple script is used to plot support and resistance zones for a given instrument. The data for the zones themselves has to be determined by the past price action of the instrument and are not based on the provided data by Tradingview.
The zones input has to come as a string. Each zone consists of a string with: ",,<"S"|"R"|"L">,<"Normal"|"Strong">"" The different zone strings have to be seperated by either new line or space.
An example for the zones input looks like:
3919.25,3919.25,L,Normal
3897.50,3906.50,R,Normal
3891.00,3894.50,S,Strong
I appreciate any feedback.
Average Daily Range Lines + VWAP by TenozenOANDA:EURUSD
Hello! I created an indicator called ADRL (Average Daily Range Lines). This is my first original work, and I hope it's helpful to you guys.
1. Let me explain a bit of how it works...
So first of I need the ADR value, as by default length I use 19 for it. I want this indicator to calculate every start of the new day and break if another new day starts, so if the target level isn't reached, then the value would start to go back to 0 and get the new target level of the day. The target level is based on the first ADR multiplied by how much "percent" we want for the target level to hit, based on the first ADR value of the day. When the new day starts, the algo would start to add up the ADR value. If the added ADR hits the target level, it starts to plot a line by the candlestick by its high, low, and mid-level; it would create a new line if there is a new target being hit. So that's it.
About the VWAP, I took Tradingview's VWAP. I added the anchored part so I can plot a line if there is a new target level being hit. I hope that's okay.
2. How to use it...
- Using this indicator is pretty easy. When a new box is being plotted, that means that's the time when you should trade, as the box is still fresh. The VWAP helps if the market is trending or not.
- You can treat this indicator just like an S&R, as the price tends to respect the box. So best to use it as a pullback trade.
- We can assume if the price above the box, is a buy; vice versa.
3. Best Market to use...
- I suggest a trade in a nonvolatile market. The more volatile the market is, the harder the box is to be respected by the price. But if you really want to trade in that market, I suggest adjusting the inputs by how the box is being respected.
4. Suggestions...
- Use this indicator in 5 minutes chart if you day trade.
- Try using 30 minutes and setting the percent input from 100 to 80 and changing the ADR length from 19 to 14, this is much more suitable if you tend to hold trades.

Psychological levels (Bank levels) PsychoLevels v2 - TartigradiaPsychological levels (Bank levels) plots "round" price levels above and below current price, by truncating after the nth leftmost digits, based on neuroscience research of how humans intuitively calculate in logarithms.
Psychological levels, also called bank levels, are "round" price numbers around which price often experience resistance or support, because traders and investors tend to set orders around these round numbers.
Calculation here is fully automatic and dynamic, contrary to other similar scripts, this one uses a mathematical calculation that extracts the 1, 2 or 3 leftmost digits and calculate the previous and next level by incrementing/decrementing these digits. This means it works for any symbol under any price range.
This approach is based on neuroscience research, which found that human brains intuitively approximate numbers on a logarithmic scale, adults and children alike, and similarly to macaques, for more info see Numerical Cognition , Weber-Fechner Law , Zipf law.
For example, if price is at 0.0421, the next major price level is 0.05 and medium one is 0.043. For another asset currently priced at 19354, the next and previous major price levels are 20000 and 10000 respectively, and the next/previous medium levels are 20000 and 19000, and the next/previous weak levels are 19400 and 19300.
Usage:
* By default, strong upper level is in green, strong lower level is in red, medium upper level is in blue, medium lower level is in yellow, and weak levels aren't displayed but can be. Half levels are also displayed, in a darker color. Strong levels are increments of the first leftmost digit (eg, 10000 to 20000), medium levels are increments of the second leftmost digit (eg, 19000 to 20000), and weak levels of the third leftmost digit (eg, 19100 to 19200). Instead of plotting all the psychological levels all at once as a grid, which makes the chart unintelligible, here the levels adapt dynamically around the current price, so that they show the upper/lower levels relatively to the current price.
* A simple moving average is implemented, so that "half-levels" are also displayed when relevant (eg, medium level can also display 19500 instead of only 19000 or 20000). This can be disabled by setting smoothing to 1.
* By default, the script runs on the daily timeframe, whatever the current chart's timeframe is. This is to reduce the variability in levels, to make it less noisy than intraday price movement, but this can be changed in the settings.
* The step can be adjusted to increase the gap between levels, eg, if you want to display one every 2 levels then input step = 2 (eg, 22000, 24000, 26000, etc), or if you want to display quarter levels, input 0.25 (eg, 22000, 22250, 22500, etc). The default values should fit most use cases and cover most psychological levels.
I made this script mainly to train with PineScript, but I found it surprisingly accurate to define levels that are respected by price movements. So I guess it can be useful for new traders and experienced traders alike, as it's easy to forget that psychological levels can often be as strong if not stronger than technical levels. It can also be used to quickly screen other minor assets for trading opportunities. For example, a hybrid strategy would be to manually define levels on BTCUSD but using this script to automatically define levels in crypto altcoins and quickly screen them for a trade opportunity that can be greater than with BTCUSD but with the same trend.
Changes compared to v1:
* Deduplicated redundant calculations and hence faster script.
* Added half-step levels, which allows to more easily see breakouts (because the levels are still on-screen).
* All steps are now configuration on the GUI.
* Revamped color scheme.
* And major reasons to post as a separate v2 script rather than updating: because we can't update the original description nor screenshot. I have now read more about the House Rules and saw other scriptmakers, so I am trying to write better descriptions like wizards do, by explaining not only how the script works but what the underlying financial concept is to a neophyte audience.

Simple LevelsSimple Level provides a (you guessed it) simple user to user level sharing experience, with less boxes, less formatting, and less hassle.
Simply insert your levels into the input box, separated by commas. That's it.
Example: 1,2,3,4,5
The Simple Levels indicator will automatically color your lines based on their position to the current close price.
If the level is crossed, the level line will change color.
This indicator is intended for those who just want to skip filling out boxes or typing in a tricky format, and cut to the chase.
There are additional, nice-to-have settings as well for the "more" technically inclined; however, nothing too complicated.
Enjoy!

Price Pivots for NASDQ 100 StocksPrice Pivots for NASDQ 100 Stocks
What is this Indicator?
• This indicator calculates the price range a Stock can move in a Day.
Advantages of this Indicator
• This is a Leading indicator, not Dynamic or Repaint.
• Helps to identify the tight range of price movement.
• Can easily identify the Options strike price.
• Develops a discipline in placing Targets.
Disadvantages of this Indicator
• The indicator is specifically made for NASDQ 100 stocks. The levels won't work for other stocks.
• The indicator shows nothing for other indexes and stocks other than above mentioned.
• The data need to be entered manually.
Who to use?
Highly beneficial for Day Traders, it can be used for Swing and Positions as well.
What timeframe to use?
• Any timeframe.
• The highlighted levels in Red and Green will not show correct levels in 1 minute timeframe.
• 5min is recommended for Day Traders.
When to use?
• Wait for proper swing to form.
• Recommended to avoid 1st 1 hour or market open, that is 9.15am to 10.15 or 10.30am.
• Within this time a proper swing will be formed.
What are the Lines?
• The concept is the price will move from one pivot to another.
• Entry and Exit can be these levels as Reversal or Retracement.
Gray Lines:
• Every lines with price labels are the Strike Prices in the Option Chain.
• Price moves from 1 Strike Price level to another.
• The dashed lines are average levels of 2 Strike Prices.
Red & Green Lines:
• The Red and Green Lines will appear only after the first 1 hour.
• The levels are calculated based on the 1st 1 hour.
• Red Lines are important Resistance levels, these are strong Bearish reversal points. It is also a breakout level, this need to be figured out from the past levels, trend, percentage change and consolidation.
• Green Lines are important Support levels, these are strong Bullish reversal points. It is also a breakdown level, this need to be figured out from the past levels, trend, percentage change and consolidation.
What are the Labels?
• First Number: Price of that level.
• Numbers in (): Percentage change and Change of price from LTP (Last Traded Price) to that Level.
How to use?
Entry:
• Enter when price is closer to the Red or Green lines.
• Enter after considering previous Swing and Trend.
• Note the 50% of previous Swing.
• Enter Short when price reverse from each level.
• If 50% of swing and the pivot level is closer it can be a good entry.
Exit:
• Use the logic of Entry, each level can be a target.
• Exit when price is closer to the Red or Green lines.
Indicator Menu
Source
• Custom: Enter the price manually after choosing the Source as Custom to show the Pivots at that price.
• LTP: Pivot is calculated based on Last Traded Price.
• Day Open: Pivot is calculated based on current day opening price.
• PD Close: Pivot is calculated based on previous day closing price.
• PD HL2: Pivot is calculated based on previous day average of High and Low.
• PD HLC3: Pivot is calculated based on previous day average of High, Low and Close.
"Time (Vertical Lines)"
• This is a marker of every 1 hour.
• Usually major price movement happen between previous day last 1 hour to today first 1 hour.
• Two swings can happen between first 2 hour of current day.
• At the end of the day last 1 hour another important movement will happen.
• Usually rest of the time won't show any interesting movement.
To the Users
• Certain symbols may show the levels as a single line. For such symbols choose a different Source or Timeframe from the indicator menu.
• Please inform if any of the Symbol's price levels don't react to the pivots , include the Symbol a well.
• Also inform if you notice any wrong values, errors or abnormal behavior in the indicator.
• Feel free to suggest or adding new features and options.
General Tips
• It is good if Stock trend is same as that of Index trend.
• Lots of indicators creates lots of confusion.
• Keep the chart simple and clean.
• Buy Low and Sell High.
• Master averages or 50%.
• Previous Swing High and Swing Low are crucial.
Important Note
• Currently the levels are in testing stage.
• Eventually the levels of certain symbols will be corrected after each update and test.

Next Gen Auto S/RThis indicator will automatically plot support and resistance levels and will also allow you to overlay multi time frame support and resistance on any time frame that you are currently conducting analysis on. In addition you can also set alerts when a support and resistance level is tested, fine tune how many levels you would like to view on your charts, option to input how many candlesticks minimum you would like between support and resistance levels. You can also select breakout mode which will turn old support into resistance by a colour change and turn old resistance into support. NEW you can now use extended levels and change your zones into lines.

Price Pivots for NSE Index & F&O StocksPrice Pivots for NSE Index & F&O Stocks
What is this Indicator?
• This indicator calculates the price range a Stock or Index can move in a Day, Week or Month.
Advantages of this Indicator
• This is a Leading indicator, not Dynamic or Repaint.
• Helps to identify the tight range of price movement.
• Can easily identify the Options strike price.
• The levels are more reliable and authentic than Gann Square of 9 Levels.
• Develops a discipline in placing Targets.
Disadvantages of this Indicator
• The indicator is specifically made for National Stock Exchange of India (NSE) listed index and stocks.
• The indicator is calculated only for index NIFTY, BANKNIFTY, FINNIFTY, MIDCPNIFTY and Stocks listed in Futures and Options.
• The indicator shows nothing for other indexes and stocks other than above mentioned.
• The data need to be entered manually.
• The data need to be updated manually when the F&O listed stocks are updated.
Who to use?
Highly beneficial for Day Traders, it can be used for Swing and Positions as well.
What timeframe to use?
• Any timeframe.
• The highlighted levels in Red and Green will not show correct levels in 1 minute timeframe.
• 5min is recommended for Day Traders.
When to use?
• Wait for proper swing to form.
• Recommended to avoid 1st 1 hour or market open, that is 9.15am to 10.15 or 10.30am.
• Within this time a proper swing will be formed.
How to use?
Entry
• Enter when the Price reach closer to the Blue line.
• Enter Long when the Price takes a pullback or breakout at the Red lines.
Exit
• Exit position when the Price reach closer to the Red lines in Long positions.
What are the Lines?
Gray Lines:
• Every lines with price labels are the Strike Prices in the Option Chain from NSE website.
• Price moves from 1 Strike Price level to another.
• The dashed lines are average levels of 2 Strike Prices.
Red & Green Lines:
• The Red and Green Lines will appear only after the first 1 hour.
• The levels are calculated based on the 1st 1 hour.
• Red Lines are important Resistance levels, these are strong Bearish reversal points. It is also a breakout level, this need to be figured out from the past levels, trend, percentage change and consolidation.
• Green Lines are important Support levels, these are strong Bullish reversal points. It is also a breakdown level, this need to be figured out from the past levels, trend, percentage change and consolidation.
What are the Labels?
• First Number: Price of that level.
• Numbers in (): Percentage change and Change of price from LTP(Last Traded Price) to that Level.
How to use?
Entry:
• Enter when price is closer to the Red or Green lines.
• Enter after considering previous Swing and Trend.
• Note the 50% of previous Swing.
• Enter Short when price reverse from each level.
• If 50% of swing and the pivot level is closer it can be a good entry.
Exit:
• Use the logic of Entry, each level can be a target.
• Exit when price is closer to the Red or Green lines.
Indicator Menu
Source
• Custom: Enter the price manually after choosing the Source as Custom to show the Pivots at that price.
• LTP: Pivot is calculated based on Last Traded Price.
• Day Open: Pivot is calculated based on current day opening price.
• PD Close: Pivot is calculated based on previous day closing price.
• PD HL2: Pivot is calculated based on previous day average of High and Low.
• PD HLC3: Pivot is calculated based on previous day average of High, Low and Close.
"Time (IST) (Vertical)"
• This is a marker of every 1 hour.
• Usually major price movement happen between previous day last 1 hour (2:15 pm) to today first 1 hour (10:15 pm).
• Two swings can happen between first 2 hour of current day.
• At the end of the day last 1 hour from 2.15 pm another important movement will happen.
• Usually rest of the time won't show any interesting movement.
To the Users
• Certain symbols may show the levels as a single line. For such symbols choose a different Source or Timeframe from the indicator menu.
• Please inform if any of the Symbol's price levels don't react to the pivots, include the Symbol a well.
• Also inform if you notice any wrong values, errors or abnormal behavior in the indicator.
• Feel free to suggest or adding new features and options.
General Tips
• It is good if Stock trend is same as that of NIFTY trend.
• Lots of indicators creates lots of confusion.
• Keep the chart simple and clean.
• Buy Low and Sell High.
• Master averages or 50%.
• Previous Swing High and Swing Low are crucial.
