Time Divergence - TDV [SHK]A truly time based indicator to check the strength of the asset based on "Time". The main idea came to my mind about 2 years ago, When i was counting the candles in an impulse move and comparing it to number of retracement candles .
So i got a period (13 for example) and checked the price change between the 13 candles, Then the space between those two points (the price!) is divided to 13 (the time!).
The result can be analyzed by checking the Divergence, or checking the Linear Regression, or bollinger band, or trend lines and channels, or ...
You can also test different periods.
I'm price action trader and i don't use indicators, But i publish my past works for other users.
Hope you find new usage methods and share them in comments.
TIME

Start the Script on Last Nth Bar [Experimental]Hello Pine Scripters,
Sometimes we need to run some processes in the scripts on last N bar but currently we don't know bar_index value of realtime bar or number of remaining bars before we reached it. So most of us use "start date" as input and run some processes after "start date".
This experimental script finds last Nth bar approximately. As you can see in the script we (should) use GMT, otherwise as I see the result might not be accurate (we don't know timezone used on the chart)
The idea is to find/use similar bar in the past (using timenow as reference) and then calculate aproximate the time of last Nth bar. the results may not be accurate all the time, also we can not know local holidays etc.
At the moment the script works on 1minute or higher time frames (it won't work on less 1min timeframes)
In the future if the Pine Team add something like "bar_index_realtime" then we will not need such things. by the way many thanks to Pine Team, they are doing great job.
You can use this script in your scripts as you want, no need to ask permission. If you can improve it let me know ;)
Enjoy!

Forex Session Breaks DST AWARE!There seems to be no open source forex trading session DST (Daylight Savings Time) aware scripts which I think is absurd. This amazing community deserves better. So I adapted some code by icostan adding DST capabilities.
Original code by icostan here
I added DST code. Warning may not be perfect yet. Could be a bug or two. It only supports 3 major sessions right now but you can add your own rules for the other timezones by copying my logic.
It is open source so please add the other sessions and regions as needed and update me please.

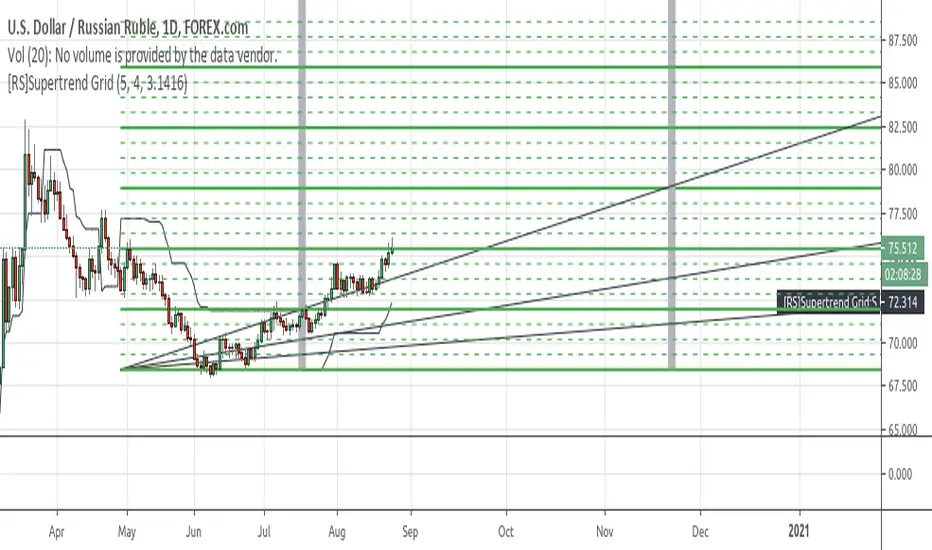
[RS]Supertrend GridDynamic grid system based on supertrend.
note: the input nlines/nfractions are not locked so if values too high might start overlapping line objects.
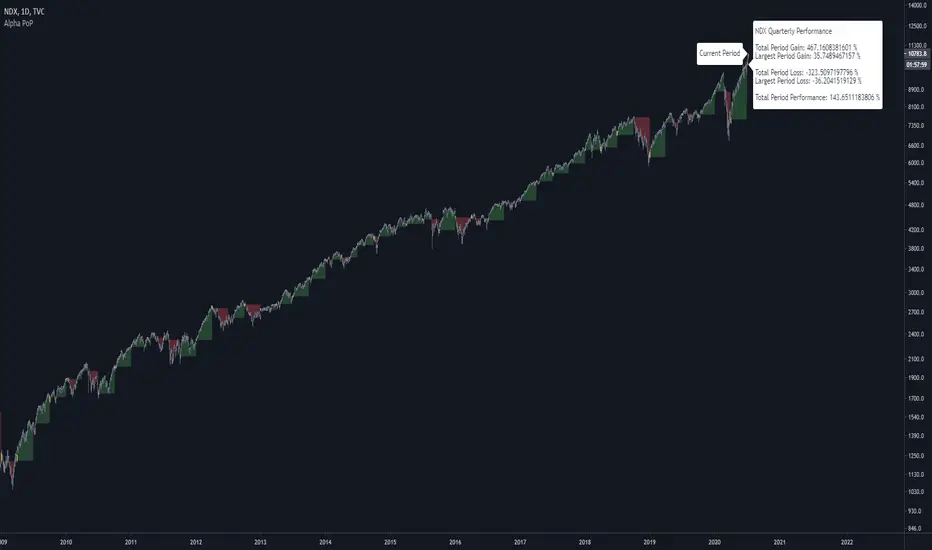
Alpha Performance of PeriodAlpha Performance of Period (PoP) produces a visualization of returns (gains and losses) over a quarterly, monthly, or annual period. It also displays the total % gain and loss over any length of days, months, and years as defined by the user.
Performance of Period (PoP) can be used to understand the performance of an asset over multiple periods using a single chart layout, and to compare the performance of different assets by using a multi-chart layout.
This can, for example, be used to compare the NASDAQ, S&P, and DJI over the past 20 years to create a dow vs. nasdaq vs. s&p performance chart. This can help you understand a comparison of historical returns by showing which performs the best month-over-month, quarter-to-quarter, year-to-year, throughout any custom period of days/months/years.
The ability to get a visualization of the % gain/loss can help to better understand how markets have performed over time and which markets have historically performed the best.
Check out the up and coming Educational Idea we will be releasing soon after this is live to see an example of how we use this tool.
Current Period Label
-----
Current Period : This label shows the current period's performance only when you hover over it.
(This label is located to the left of the current period's open candle and at the current candles close price)
TICKER "Time Period" Performance Label
-----
Total Period Gain : The total of all % gain periods from the start to end date.
Largest Period Gain : The biggest % gain period from the start to end date.
Total Period Loss : The total of all % loss periods from the start to end date.
Largest Period Loss : The biggest % loss period from the start to end date.
Total period Performance : The total % performance, the difference between the total gain and total loss.
NOTE : The "Current Period" performance is excluded from ALL five of the above-mentioned figures. This was done to avoid giving inaccurate comparison figures due to the period not being finished yet.
Inputs
-----
Current Script Version + Info : A drop-down list of instructions for the user to refer to.
Dark Mode Labels : Toggle on for Dark Mode. This is done since Labels text and background color can not be adjusted separately within the visual inputs so this is the best fit solution.
Time Period of Returns : Pick the period of performance you would like to emulate monthly/quarterly/annual.
Start Date : The day to start tracking performance.
Start Month : The month to start tracking performance.
Start Year : The year to start tracking performance.
End Date : The day to stop tracking performance.
End Month : The month to stop tracking performance.
End Year : The year to stop tracking performance.
As always if you have any feedback let us know in the comments and leave a like if you enjoy this tool :)
Combination Parabolic MA/IIR/ALMA Strategy, and other goodies Okay, so this is a lot. It started mostly with me combining indicators and looking for ideal entry criteria.
It is also a collection of conditions, whether used or unused, for my current chosen "best" strategy. It is currently set how I like it, but it has changed with time, and will continue to do so. Within, there are variables that are unused, but offer some insight into the overall odds of a trade. They were, in fact, once used but fell out of favor. And all details for this strategy are within the comment header of the script.
As this evolves, I most certainly wont keep any future findings and hope for profit from my peers (yinz). Also, I'd like to give a sincere thanks to the people of TV for what I learned in a few month's time and their flexible membership plans. Basically, I'm just a mad scientist, but this monster's a masterpiece and folks here before me made many indirect contributions to it.
--------------------------
Okay guys, lastly and most importantly,
Each smack of the like button is a vote of your confidence in me, to my beautiful landladies, Celeste and Adele, that my rent will be caught up and that it won't always be a problem. Which, in my mind, makes me a graph. And they've got strong hands and don't sell the low. I more than respect that. Seriously. And I'm very grateful for their willingness to work with me, but the thing is that I didn't ask first; life just happens. But few are tolerant of others. And quite importantly, I truly believe that I will be successful one day, and that "thumbs-up" button is your vote of confidence. If you're not sure, then don't hit it yet. Maybe my scripts will boost your confidence in me :)
-------------------------
PS: And you know what? I'ma give a shout-out to Philakone for teaching me everything that I know about Elliot Wave . Absolutely. Two years ago, I would keep telling myself that one day I will put something in his gratuity wallet or pursue the paid courses. And, I still plan on it, because I'm grateful. And so also, to everybody else, I'm recommending him to learn from. because as a trader who might not know everything for free, you can certainly fill in the gaps with his altruistic offerings. And I'm betting that you will then feel more than inclined to buy the Udemy course.
"If wave 2 retraces a lot; number 4 will not". Repetition. Philakone didn't fix my memory but he sure did find a workaround, haha
Okay, everyone, Thanks!

Renko AccelerationRenko is a very useful charting method for analyzing stock movement. It does a great job of filtering out all the excess noise so that all we're left with is pure price action. But, what about time? Time is a fundamental part of chart analysis and we are only seeing part of the picture. After all, shouldn't we take a very different approach to trading signals from a block that renders in 2 seconds as opposed to a block that renders in 30 minutes?
This indicator provides the best of both worlds, enabling us to correlate the passing of time with price movement and clearly see when squeezes and breakouts occur.
As the indicator turns up to green we can see that volatility is on the move and the market is accelerating (breakout), and as it turns down to red the market is stagnating (squeeze). There is also an alternate 'Precise' view which renders the exact time per block for more granular analysis.

[FN] Session Range & Date Range For BacktestingThis has been done before in different ways, however, my goal is to publish a single, simplified copy/paste version of the idea so you can quickly and easily incorporate it into your strategy backtesting.
You can designate weekdays, weekdays + weekends for 24/7 markets, and also session range.
So, you trade bitcoin? It works. CME futures? It works. You are a discretionary trader so the only signals that matter are the ones that happen when you're awake? It works. Copy and paste.
The goal is that its that easy. You'll have to let me know if it is. glhf everyone.
If I'm not mistaken, you should be able to copy/paste this directly into your strategy script (Paste it in before your entry declarations). Just leave out the last 2 lines where the bgcolor() is declared... unless you want the background color lit up, that's up to you. It's just for demonstration purposes in this script.
After you've pasted it in, then in your strategy.entry() function you are adding: to the strategy.entry() function.
e.g:
strategy.entry("Long", strategy.long, qty=1, when = ENTRY_SIGNAL and signal_backtest())
Shoutouts to @zenandtheartoftrading and @allanster for providing the basis of this code that I put together here. We stand on the shoulders of giants.

World Markets Session ShadingHighlights different world session times the times and highlight colors can be adjusted

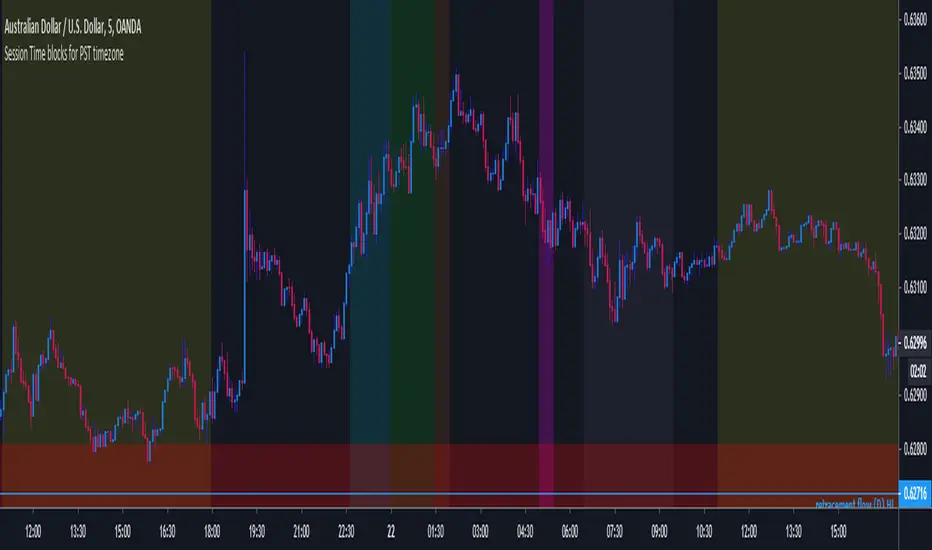
MF Custom Sessions (PST)Public Version - This is a session timing indicator for people in the PST time zone and represents each major session with a different color time block for intraday studies.
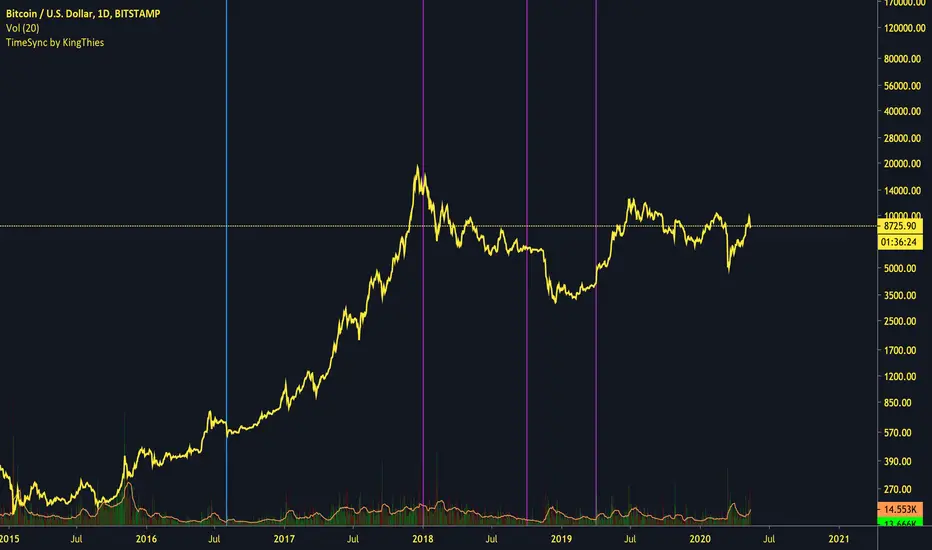
TimeSync by KingThies TimeSync by Kingthies
Written in Pine v4
Applies one function that was published in the Tradingview Pinescript Manual
The Motivation behind this script - Time is 50% of your chart. Many ignore it entirely. This should help give an idea on how to read it and incorporate it in their analysis.
TimeSync by KingThies takes a simple concept and turns it into a visual tracking system of when timeframes of significant impact, all close at the same time.
By utilizing several high time-frames, we see overlaps in periods and more significant events occurring when multiple periods close at once.
The TFs included are 3D,1W,2W and 1M. When users use the timeframes above intraday, the resolution for these HTF's is shown. When using the LTFs, anything lower than 1D/is intraday, the user sees a similar concept but comprised of the 4H, 6H,8H and 10H charts.
Users can adjust the settings to show the HTFs in sync AND also factor in if the event was on a business quarter or new year, which adds more significance to the occurrence.
By seeing when these periods end in sync, we can assume more volatility is present in a given market, presenting various opportunities for traders to take advantage of a given situation.
Apologies in advance for any questions that come up - I will do my best to reply or respond here on Tradingview.com.
Additional Resources for this topic can be found in my account signature, located at the bottom of this post.
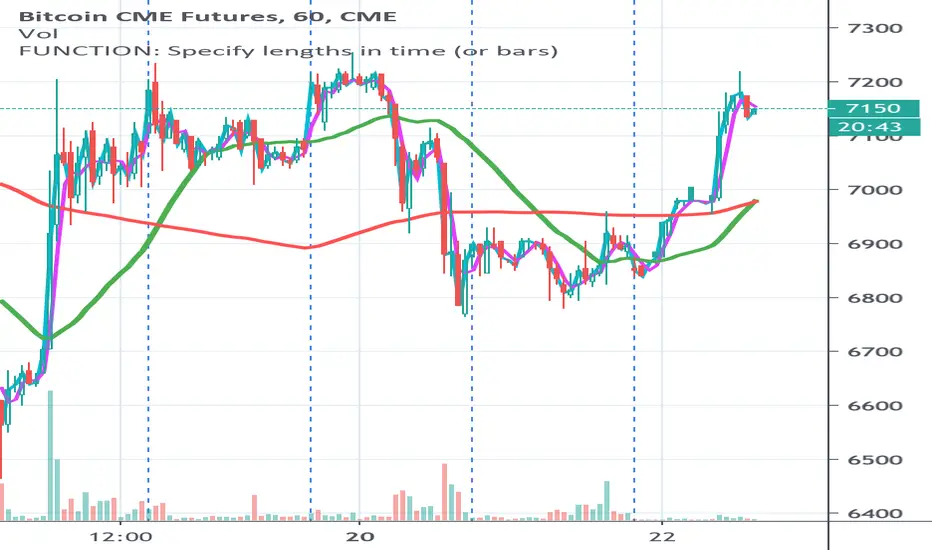
FUNCTION: Specify lengths in time (or bars) This is a function to give measures in time rather than bars...
I often want to measure in things in time rather than bars and change the sample rate (the candle size)
without reconfiguring my settings. This is a handy function for setting you input lengths in time units
(or bars when you want that)
For example
I want a 3 hour moving average, regardless of whether I have 5 minute candles or 30 min candles...
I want a 200 day moving average, regardless of whether I have 1 day or 1 week candles...
This is designed for you to put in your own scripts for your own purpose, but you can use this as is for time constant moving averages
or as an indicator on an indicator.
This shows the same moving averages 45 min / 3 hours in aqua / fuchsia and 1 day / 1 week in red / green
First row: On an extended session chart with 10m, 30m and 60m candles (all of them use the same settings (day length is 16 hours) everything else default.
Second row: On a standard session chart with 10m, 30m and 60m candles (all of them use the same settings everything else default.
[RS]Shadows Of Past, Present and FutureExperimental:
session projection into the future..
Past, Present, Future
Tell me, tell me, smiling child,
What the past is like to thee ?
'An Autumn evening soft and mild
With a wind that sighs mournfully.’
Tell me, what is the present hour ?
'A green and flowery spray
Where a young bird sits gathering its power
To mount and fly away.’
And what is the future, happy one ?
'A sea beneath a cloudless sun ;
A mighty, glorious, dazzling sea
Stretching into infinity.’
by Emily Brontë
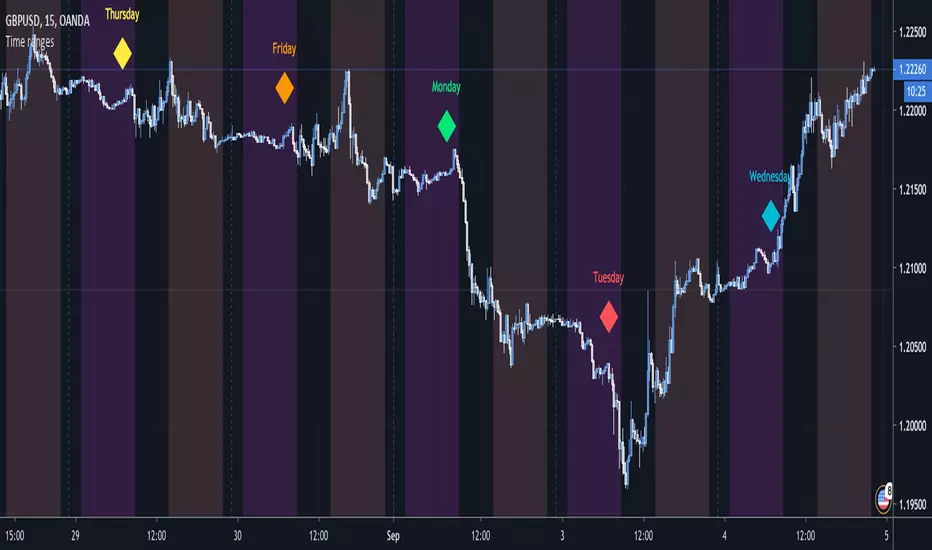
Custom Time ranges. Daily price ranges.Addition to previous time range script, now containing daily ranges. You can select a day of the week, and have it show the high, low, mid, and open of that day.
For the time bands:
Monday = 2
Tuesday = 3
Wednesday = 4
Thursday = 5
Friday = 6
Saturday = 7
Sunday = 1
Example 1:
1500-1800:2
This will colour the background between 3pm and 6pm on Mondays.
Example 2:
0000-0600:247
This will colour the background between midnight and 6am on Mondays, Wednesdays, and Saturdays.
For the Daily price ranges:
Just select the tick-box forthe day, and then the price levels you'd like to see.
I want to add specific weekly levels to this, for example: week 06 of year 2020, but I've not figured out how to do it yet. If anyone knows, I'd appreciate it if you let me know. I'll then update this script.
As always, any questions you may have, please leave in comments below and I'll respond when I have time.
If you notice anything good with this indicator, let me know. We are all in this to make money after all! ;)

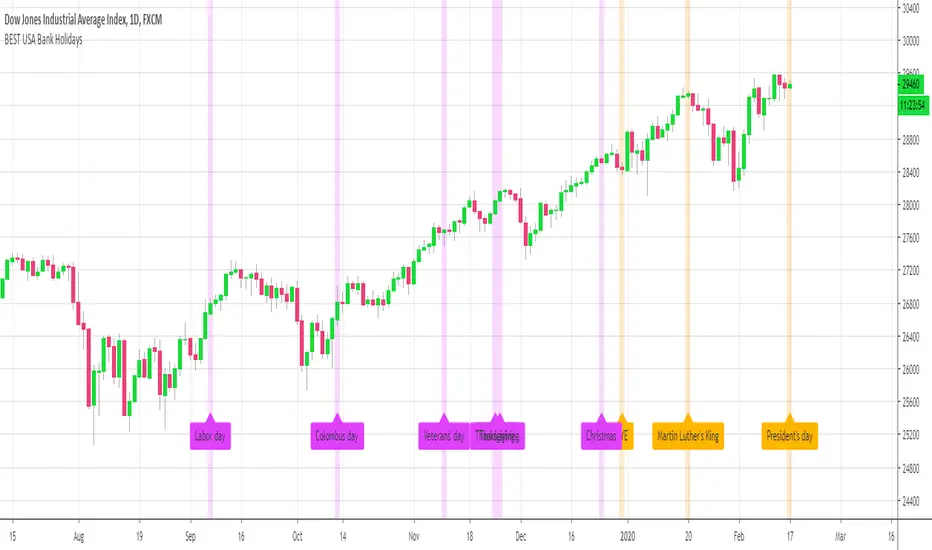
BEST USA Bank Holidays HelperHello traders
This is a quick helper displaying the US bank holidays labels 1 day before the actual bank holiday date
Useful to be reminded when it's better to not trade as the big "whales" aren't trading either - and are probably drinking cocktails on their yachts in the Caribbeans island
This is my way of saying that, the days where the USA are off, the derivatives like indices aren't likely to give big opportunities
Of course, big move might happen but statistically, we're better off going to the Caribbeans islands as well (or preparing for the next trading day)
Bonus
The indicator displays in fuschia (never knew how to write that word properly without checking google first...) the 2019 US bank holidays
Best regards and enjoy your cocktails today :)
Dave
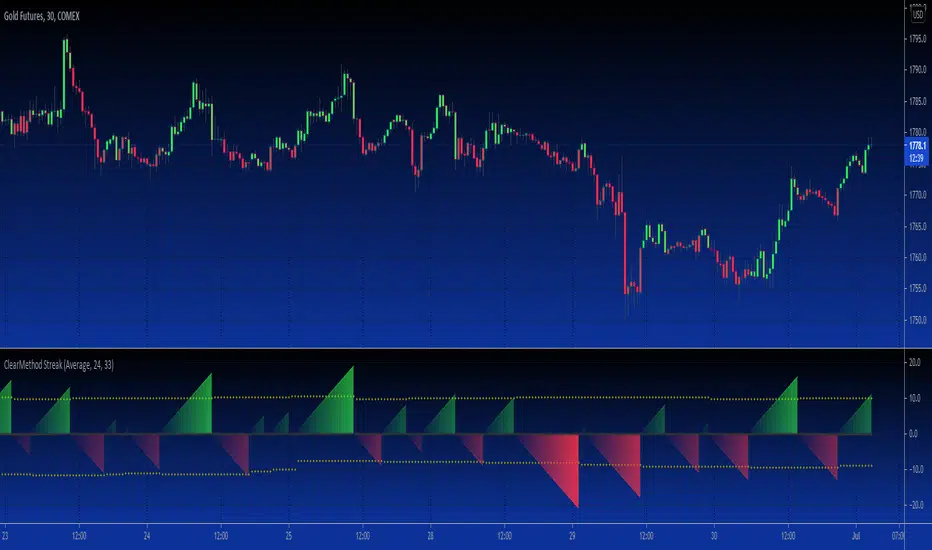
B3 Clear Method Streak CountAbout Clear Method -- to repeat my prior post on the bar painter script:
This indicator is translated out of Technical Analysis of Stocks & Commodities , September 2010, (I take zero design credit). The script simply looks for the price action to break or "clear" the most recent action, and only changes the paintbar color if the action indeed clears the previous candles. Simple to use, just add to your chart from your favorites and change the colors in the UI. It does the rest.
This version can replace my previous Clear Method Bar Painter as it also paints the bars.
What is different is this share is a lower study that counts the streak of the bars shown via histogram.
The way to use the streak is to notice the previous streaks and get a sense of how long the current trend is lasting versus prior trends of the same direction.
@Tradestation recently posted their "price streak" study, and this one is quite similar in nature.
Enjoy, the code open to view,
_B3
d^.^b
How To Set Backtest Time Ranges
Example how to set the time range window to be backtested for both entries and exits. Additional examples are also included showing how to set the date range and toggle plot visibility.
By incorporating this code with your own strategy's logic, it will allow you to backtest various time windows.
Much gratitude to @LucF and @a.tesla2018 for help with including ':1234567' for time ranges on weekends. Thank you both!
NOTICE: This is an example script and not meant to be used as an actual strategy. By using this script or any portion thereof, you acknowledge that you have read and understood that this is for research purposes only and I am not responsible for any financial losses you may incur by using this script!

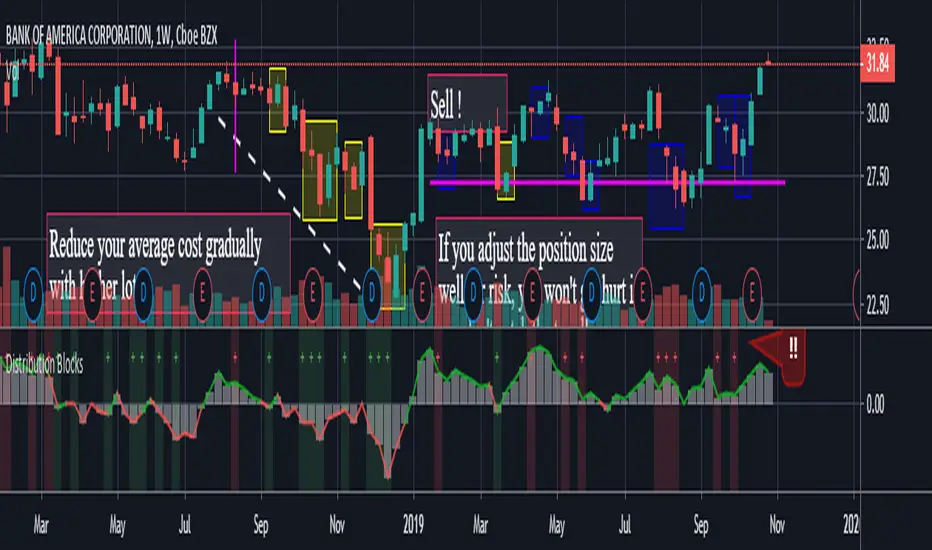
Distribution BlocksThis idea has been created by the combination of the two existing systems as a result of my efforts to create a distributional buying and selling guide that has plagued my head for a long time.
1st idea is Accumulation / Distribution Line :
2nd idea is Distribution Day :
These two ideas, the intellectual assistance of professional brokers, and my observations of cot data played a role in the formation of this idea.
Let's start.
No matter how often we divide our risk, both our minds are not comfortable and our capital may end at any moment, and if we do not use professional systems, our chances of success are 50 percent.
If we take this system as an aid to our classic systems, we can determine the amount of risk with those predictions and gradually trade.
If we don't use leverage and we have a little predictive ability, our chances of success go above 50 percent.
But for the first time, we can keep our first lot very low and increase the number of positions in the same order of orders (example: buy and buy and buy).
If we keep the first amount low, the folds won't hurt us.
When we catch up with the trend, purchases with larger position sizes than lower prices lower our average price, so that we can make a good profit when the rising trend starts.
By accepting the zone changes as the reset point just like in the martingale system, we enter the folds in the new zone with our first lot weight.
Although we cannot catch the trend, we determine the stoploss level by adding the first point we entered or the first point we entered and the commission cost.
In fact, this method is the method of buying and selling very large traders and producers, banks, pro-brokers, hedge funds and in other words the new popular phrase "whales".
Because if he trades otherwise, he cannot find buyers because his goods are too big.
I like the comfort of mind in this way.
Finally, your methods separating the negative and positive regions (macd, rsi, interpretation observation etc.)
the stronger you are, the higher your success rate.
I think the Accumulation Distribution method is very successful, but it can be adjusted for the period.
I can't wait to integrate my relativity system on this.
And when my deep learning series is over, I will integrate them on ANN series and share them publicly.
To start with, I can say briefly.
If your capital is 100:
(first lot + (increase multiplier * first lot) + (increase multiplier * increase multiplier * first lot) + .....) = 100
I tell you that you can have the same position in this series 10 - 15 times,
this will help you decide how small a position size is to be used as the starting rate and choose a low increment multiplier!
I think that this idea cannot be converted into strategy, because when our expectations come true, we may want to free all positions and start again.And I think that's better.
And in sudden movements and developments we take action with different expectations.
I'm going to talk about this script's calculations and profits on educational ideas.
Regards , Noldo.
Time rangesThis script visualizes the different time sessions during the day.
The time ranges are set to the default Frankfurt, London, NY, Sydney and Tokyo, but can be
freely modified and turned off (I personally use to display only Tokyo and NY).
If you are a day trader, e.g. you trade with the Market Makers, this tool is a "must have".
It also displays the day of the week, which can be set off as well.
vitelot/yanez/Vts Sept 2019
PS I chose this script to belong to the "volatility" category since it can be used to highlight the Asian session,
and there was no suitable category available.
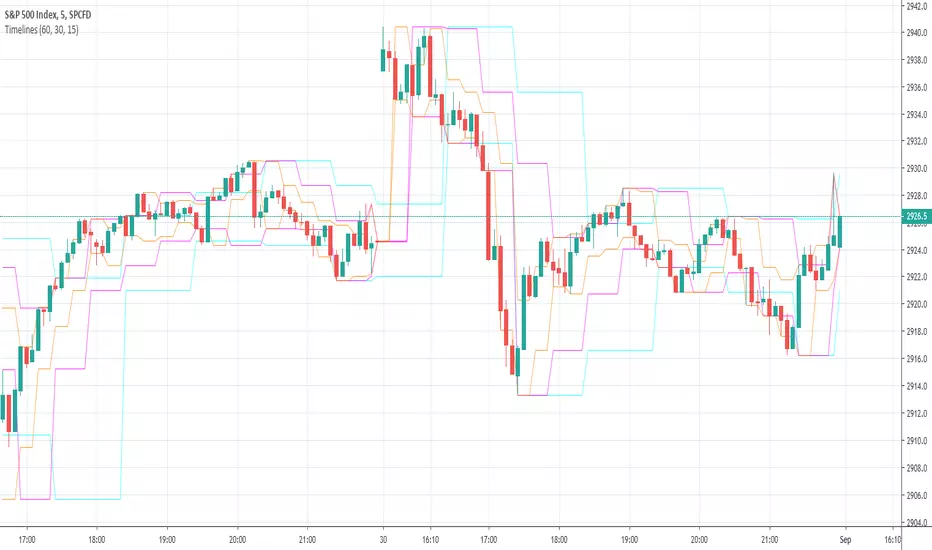
Timelines-Buschi
English:
This is a little, simple script I made upon request from a user.
It shows the highs ad lows of up to three custom timelines (e. g. 60 min, 30 min and 15 min) within a chart.
Deutsch:
Dies ist ein kleines, einfaches Skript, das ich auf Anfrage eines Nutzers erstellt habe.
Es zeigt die Hochs und Tiefs von bis zu drei individueller Zeitreihen (z. B. 60 min, 30 min und 15 min) innerhalb eines Charts.
HTF Candle [Custom Time Period] by JustUncleL [SOMMI 1.0 edit]This is a custom High Time Frame indicator, originally created by JustUncleL. 💚
I have edited the Pine Script to allow a custom Time Period input. 💛
In the original version, you could only select from a few time periods as your High Time Frame. 💙
In this version you can put any time frame as your reference. 🧡
Example: 6-hour HTF or 2-Day HTF
SOMMI'S SPECIAL NOTES:
-This indicator works with Heikin-Ashi candles.
-Please change your candles to Heikin-Ashi and apply the indicator.
-Advised to disable "Body Wicks"
-Advised to also refresh your page a few times a day as it doesn't update properly due to limitations of TradingView / Pinescript currently.
💙💛💚🧡


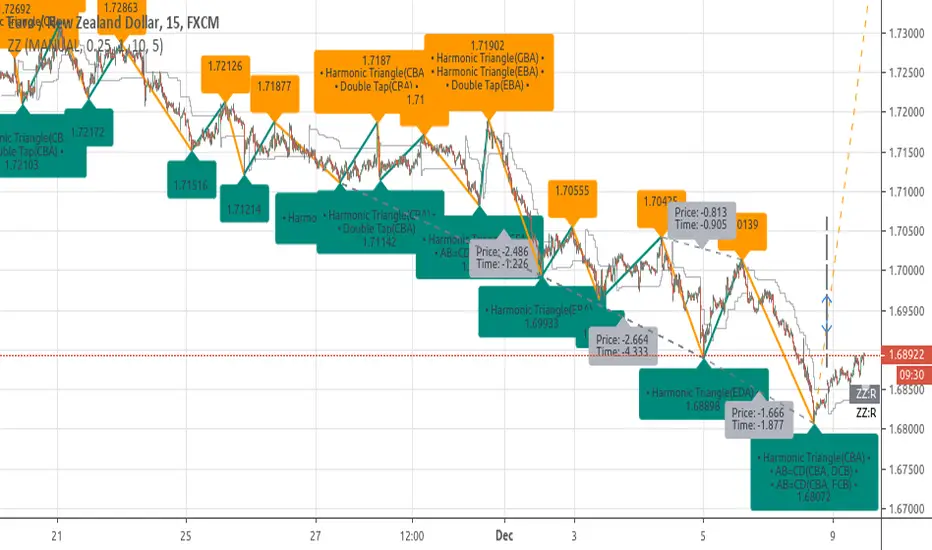
[RS]ZigZag Percent Reversal - Forecast - patterns - labels description:
• Zig Zag indicator plots points on the chart whenever prices reverse
by a percentage greater than a pre-chosen variable.
• Forecasts area based on zigzag statistics.
• Displays labels with detected patterns.
• Displays slope information rate of price, time diferentials and angle(experimental)