Uber Trend IndicatorThis is my first custom indicator that I created as a medium to long term trend indicator. Buy if it is above 0 and sell if it is below 0.
Since this is my first unique indicator, I would love to hear your feedback! Please let me know if you would like to see any other scripts!
Trend
Demand OscillatorThe Demand Oscillator was created by James Sibbet (Stocks & Commodities June, 1986) and I changed his formula quite a bit to what you see on here. If it rises above the signal then buy or if not then sell. This is my custom version of his formula so let me know what you think.
Let me know if you would like to see me write any other scripts!
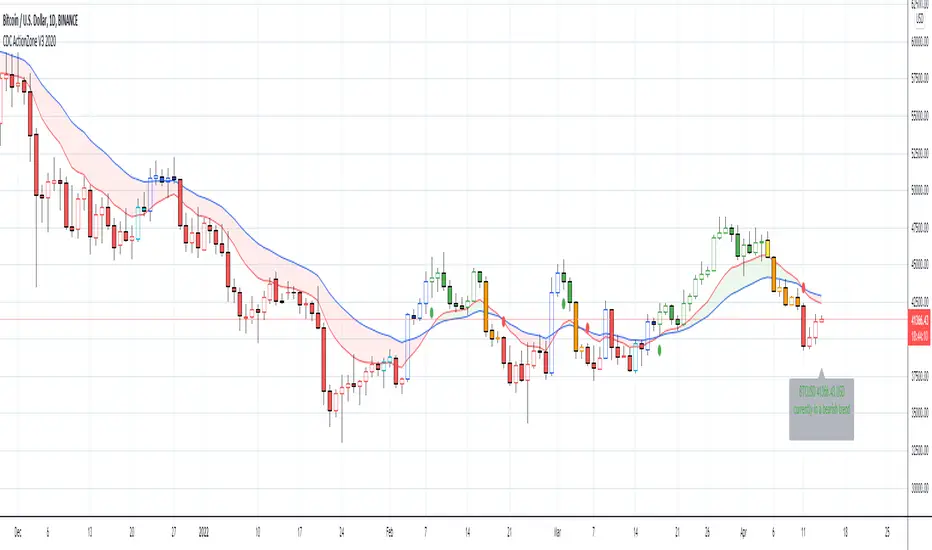
CDC ActionZone V3 2020## CDC ActionZone V3 2020 ##
This is an update to my earlier script, CDC ActionZone V2
The two scripts works slightly differently with V3 reacting slightly faster.
The main update is focused around conforming the standard to Pine Script V4.
## How it works ##
ActionZone is a very simple system, utilizing just two exponential moving
averages. The 'Zones' in which different 'actions' should be taken is
highlighted with different colors on the chart. Calculations for the zones
are based on the relative position of price to the two EMA lines and the
relationship between the two EMAs
CDCActionZone is your barebones basic, tried and true, trend following system
that is very simple to follow and has also proven to be relatively safe.
## How to use ##
The basic method for using ActionZone is to follow the green/red color.
Buy when bar closes in green.
Sell when bar closes in red.
There is a small label to help with reading the buy and sell signal.
Using it this way is safe but slow and is expected to have around 35-40%
accuracy, while yielding around 2-3 profit factors. The system works best
on larger time frames.
The more advanced method uses the zones to switch between different
trading system and biases, or in conjunction with other indicators.
example 1:
Buy when blue and Bullish Divergence between price and RSI is visible,
if not Buy on Green and vise-versa
example 2:
Set up a long-biased grid and trade long only when actionzone is in
green, yellow or orange.
change the bias to short when actionzone turns to te bearish side
(red, blue, aqua)
(Look at colors on a larger time frame)
## Note ##
The price field is set to close by default. change to either HL2 or OHLC4
when using the system in intraday timeframes or on market that does not close
(ie. Cryptocurrencies)
## Note2 ##
The fixed timeframe mode is for looking at the current signal on a larger time frame
ie. When looking at charts on 1h you can turn on fixed time frame on 1D to see the
current 'zone' on the daily chart plotted on to the hourly chart.
This is useful if you wanted to use the system's 'Zones' in conjunction with other
types of signals like Stochastic RSI, for example.
Sell Gravitation IndexThe Sell Gravitation Index was created by Howard Wang and was published in Stocks & Commodities V37:02 (36-38)
This indicator is similar to the relative strength index but the big difference is that this indicator gives early buy and sell signals which I find very helpful. Buy when it rises above its signal line and sell when it falls below its signal line.
Let me know if you would like to see me publish any other scripts!

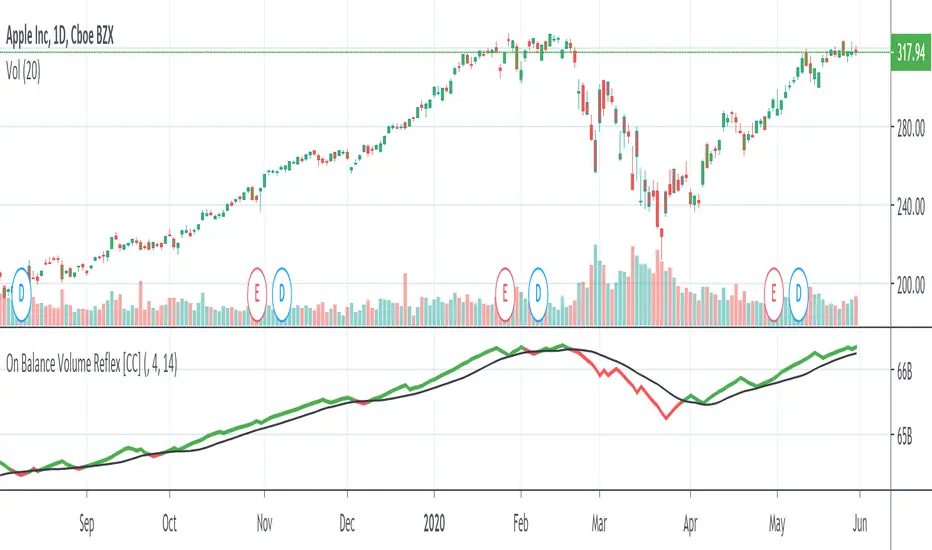
On Balance Volume ReflexThe On Balance Volume Reflex Indicator was developed by Fred Purifoy (Stocks & Commodities V 6:4 142-144) and it is similar in calculation to the On Balance Volume indicator but uses a lookback period for the change comparisons. Buy when the OVR is above the signal and sell when it falls below the signal.
I have included my On Balance Volume Modified Indicator to highlight the differences between both indicators.
Let me know if you would like to see me write scripts for more indicators!
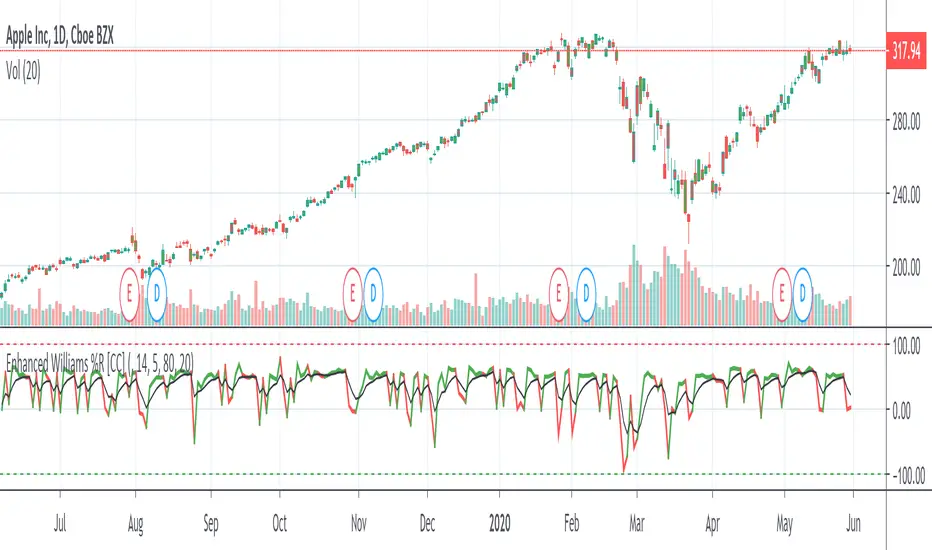
Enhanced Williams %RThe Enhanced Williams %R Indicator was created by Robert J Kinder Jr (Stocks & Commodities V5:5 (180-182)) and is based on the Williams %R Indicator. It takes volume into account and the buy and sell signals are pretty much the same. I would recommend to buy when the indicator is over the signal and if you want a confirmation then also make sure the signal is above 0. Sell if it falls below the signal or if the signal goes below 0 or of course buy or sell when the indicator goes into overbought or oversold territory.
I'm still tinkering with this indicator and it is the first time I have seen this indicator script published so let me know if you have any suggestions for me.
And of course let me know if you would like me to write indicators for you or anything else you would like to see!
McGinley Dynamic IndicatorMcGinley Dynamic is a technical indicator developed by a market technician, R. McGinley in 1997
I based my indicator from code by everget so you should go follow him if you aren't already!
I had issues with the default version of this indicator using different lengths so this is my fix for those issues. This follows the price very closely especially when the stock is falling. I have color coded so go long when it is green and short when it is red.
Let me know if you would like me to write any other scripts for indicators out there!

Validated PSARPSAR works well as trailing stop loss (or WinStop), but is often whipsaw'd as it detect trend changes over enthusiastically.
So, a filter to validate trend changes was added. It basically requires 3 straight bars completely breaking the prior saved PSAR level.
Enjoy!

Force IndexWhat is the force index ?
The force index is an oscillator used to confirm price breakout strengths and identify potential trends.
It was popularized by A. Elder.
How the force index is computed ?
Knowing that volume is the fuel of a price movement, reliable breakouts and trend continuation are more likely to occur on high volume breakouts. This is why the force index is computed with the intensity of the price movement, and it's volume , using the formula ema13((close(n) - close(n-1)) * volume ) .
How to use the force index
An important change in the force index indicate a strong momentum in the price action.
You can read more about the force index interpretation on Investopedia
Customization
You can display the indicator as an histogram, or as a line chart.
You can change EMA length, although it's recommended to keep it at default value.

Z-HistogramIt is possible to approximate the underlying distribution of a random variable by using what is called an "Histogram". In order to construct an histogram one must first split the data into several intervals (also called bins) often of the same size and count the number of values falling within each intervals, the histogram plot is then constructed with the X axis representing the measured variable and the Y axis representing the frequency.
The proposed script aim to estimate the underlying distribution of a rolling z-score by constructing its histogram, here the histogram consist of 13 bins of width 0.5 rolling standard deviations. The length setting define the rolling z-score period, the window setting define the number of past data to be counted, finally using the "Total" option (true by default) will count all the rolling z-scores values since the first bar, in order to use the window setting make sure to uncheck the "Total" option.
DISPLAY
In order to see the entirety of the histogram make sure to double click on the indicator window and to have all the lower panels (text notes, pine editor...etc) hidden, finally make sure to zoom-in in order to see the frequency numbers displayed.
Z-Histogram on BTCUSD 15 min TF, the blue bins represent intervals situated over 0 while red bins represent intervals situated under 0. Here σ represent the X-axis in standard deviations, the histogram start with a bin situated at σ = -3 which count the number of times the rolling z-score was within -3 and -2.5, the histogram end with the bin situated at σ = 3 which count the number of time the rolling z-score was within 3 and 3.5.
It is also possible to look at the shape of the histogram without having the indicator window at full size.
INTERPREATION
An histogram can give really interesting information such as overall trend direction and strength. The direction can be measured by looking at the skewness of the histogram, with a negative skewness (the peak of the histogram situated at the right from the center) representing down-trending variations and positive skewness (the peak of the histogram situated at the left from the center) representing up-trending variations, while a symmetrical histogram could represent a ranging market. The farther away the peak of the histogram is situated from the center, the stronger the trend.
Another interesting characteristic is the tailedness of the histogram, which can give information about the cleanliness of the trend, for example a positive skew and high tailedness would represent a clean up-trend, as it could suggest less variations contrary to the main trend.
An histogram applied to the rolling z-score can give various useful information. As a recall the rolling z-score of the price measure the distance between the closing price and its moving average in term of rolling standard deviations, for example if the rolling z-score is equal to 2 it means that the closing price is currently 2 rolling standard deviations over its moving average.
Lets for example analyze the histogram using INTC 15 min tf with a window of 456 bars and rolling z-score of length = 100 in order to review longer term variations.
We can see from the histogram that the uptrend visible on the chart is represented by the bins situated over 0 having an overall higher frequency than the bins under 0, we can see that the closing price tended to stay between 1 and 1.5 rolling standard deviations over its period 100 moving average. Here bins under 0 accounts for retracements in the trend.
IN SUMMARY
An histogram can give various information regarding the price evolution of a security, the proposed script aim to plot the histogram of a rolling z-score. Now this script might not be too useful but it was fun to make, also it does not mean that an histogram is not an useful tool in the context of trading, the only thing required is a god implementation of it (like volume profiles for example)
In this post we have also reviewed some important statistical concepts such as distributions, z-score, skewness and tailedness, each being extremely important in the quantitative trading field.
Thx for reading !

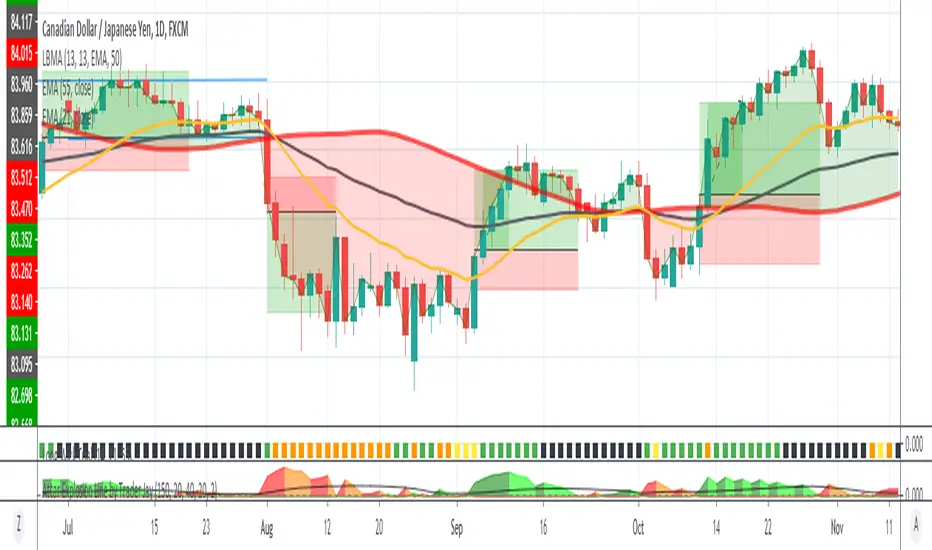
FTSMA - Trend is your frendThis my new solid strategy: if you belive that "TREND IS YOUR FRIEND" this is for you!
I have tested with many pairs and at many timeframes and have profit with just minor changes in settings.
I suggest to use it for intraday trading .
VERY IMPORTANT NOTE: this is a trend following strategy, so the target is to stay in the trade as much as possible. If your trading style is more focused on scalping and/or pullbaks, this strategy is not for you.
This strategy uses moving averages applied to Fourier waves for forecasting trend direction.
How strategy works:
- Buy when fast MA is above mid MA and price is above slow MA, which acts as a trend indicator.
- Sell when fast MA is below mid MA and price is below slow MA, which acts as a trend indicator.
Strategy uses a lot of pyramiding orders because when you are in a flat market phase it will close 1 or 2 orders with a loss, but when a big trend starts, it will have profit in a lot of orders.
So, if you analize carefully the strategy results, you will note that "Percent Profitable" is very low (30% in this case) because strategy opened a lot of orders also in flat markets with small losses, BUT "Avg # bars in winning trades" is very high and overall Profit is very high: when a big trend starts, orders are kept open for long time generating big profits.
Thanks to all pinescripters mentioned in the code for their snippets.
I have also a study with alerts. Next improvement (only to whom is interested to this script and follows me): study with alerts on multiple tickers all at one. Leave a comment if you want to have access to study.
HOW TO USE STRATEGY AND STUDY TOGHETER:
1- Add to chart the strategy first, so your workspace will be as clean as possible.
2- Open the Strategy Tester tab at footer of the page.
3- Modify settings to get best results (Profit, Profit Factor, Drawdown).
4- Add study with alerts to your chart with same setting of strategy.
I WILL PROVIDE A DETAILED QUICK INSTALLATION GUIDE WITH THE STUDY!
Please use comment section for any feedback or contact me if you need support.

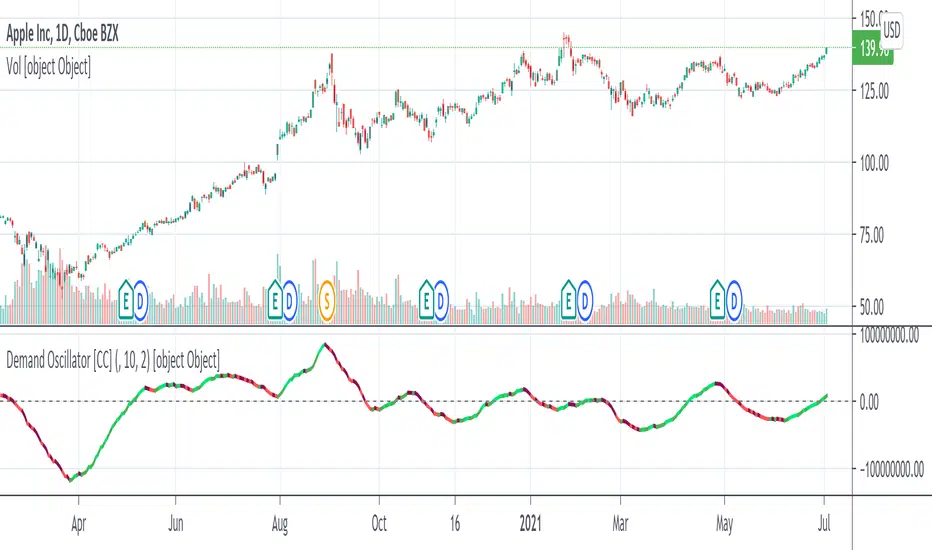
Z Score Enhanced Time Segmented Volume (Multi MA)**THIS VERSION HAS BEEN STANDARDIZED WITH A Z SCORE CALCULATION AND ALLOWS THE USER TO SELECT WHICH MOVING AVERAGE THEY WOULD LIKE TO UTILIZE FOR THE SIGNAL LINE**
Chart shows the Non-Standardized Enhanced Time Segmented Volume (Multi MA) with default settings on top and the Standardized version with default settings on the bottom.
Time Segmented Volume was developed by Worden Brothers, Inc to be a leading indicator by comparing various time segments of both price and volume . Essentialy it is designed to measure the amount of money flowing in and out of an instrument.
Time Segmented Volume was originally ported to TradingView by user @liw0 and later corrected by user @vitelot. I never quite understood how to read Time Segmented Volume until I ran across a version by user @storma where they indicated when price would be long or short, but that code also utilized the incorrect calculation from user @liw0.
In an effort to make Time Segmented Volume more accessible and easier to read, I have re-coded it here. The calculations are based on the code from @vitelot and I have added direction indicators below the chart.
If the histogram (TSV) is greater than zero and greater than the moving average, price should be moving long and there will be a green box below the chart.
If TSV falls below the moving average while still being greater than zero, the trend may be exhausting and has been coded to read Price Action Long - FAILURE with a black x below the chart.
If the histogram (TSV) is less than zero and less than the moving average, price should be moving short and there will be a red box below the chart.
If TSV rises above the moving average while still being less than zero, the trend may be exhausting and has been coded to read Price Action Short - FAILURE with a black x below the chart.
At times, the moving average may be above zero while TSV is below zero or vice versa. In these situations the chart will indicate long or short based on whether or not TSV is greater or less than zero. It is possible a new trend may be forming as the moving average obviously lags, but also possible price is consolidating with little volume and causing TSV to oscillate close to zero.
**Z Score // Standardized Option **
Thist Standardized code implements all of the above but also allows the user to select a threshold level that should not need to be adjusted for each instrument (since the output is standardized).
If the TSV value meets the long and short signal requirements above and TSV is greater than the threshold values a green or red box will print ABOVE the oscillator. The histogram will also change color based on which threshold TSV has met.
This calculation allows us to compare current volatility to the mean (moving average) of the population (Z-Length). The closer the TSV Z-Score is to the mean, the closer it will be to the Zero Line and therefore price is likely consolidating and choppy. The farther TSV Z-Score is from the mean, the more likely price is trending.
The MA Mode determines the Moving Average used to calculate TSV itself. The Z-Score is ALWAYS calculated with a simple moving average (as that is the standard calculation for Z-Score).
The Threshold Levels are the levels at which TSV Z-Score will change from gray to yellow, orange, green ( bullish ), or red ( bearish ).
Statistically speaking, confidence levels in relation to Z-Score are noted below. The built in Threshold Levels are the positive and negative values for 90%, 95%, and 99%. This would indicate when volatility is greater than these values they are out of the ordinary from the standard range. You may wish to adjust these levels for TSV Z-Score to be more responsive to your trading needs
80% :: 1.28
85% :: 1.44
90% :: 1.64
95% :: 1.96
99% :: 2.58
The Z Length is the period for which the Z Score is calculated
More information regarding Time Segmented Volume can be found here: www.worden.com
Original code ported by @liw0
Corrected by @vitelot
Updated/Enhancements by @eylwithsteph with inspiration from @storma
Multiple MA Options Credits to @Fractured and @lejmer
Bits and Pieces from @AlexGrover, @Montyjus, and @Jiehonglim
As always, trade at your own risk.

Enhanced Time Segmented Volume (Multi MA)**THIS VERSION ALLOWS THE USER TO SELECT WHICH MOVING AVERAGE THEY WOULD LIKE TO UTILIZE FOR THE SIGNAL LINE**
Chart shows two different options of many. Top option is the default settings and bottom option is a different moving average with no other changes.
Time Segmented Volume was developed by Worden Brothers, Inc to be a leading indicator by comparing various time segments of both price and volume. Essentialy it is designed to measure the amount of money flowing in and out of an instrument.
Time Segmented Volume was originally ported to TradingView by user @liw0 and later corrected by user @vitelot. I never quite understood how to read Time Segmented Volume until I ran across a version by user @storma where they indicated when price would be long or short, but that code also utilized the incorrect calculation from user @liw0.
In an effort to make Time Segmented Volume more accessible and easier to read, I have re-coded it here. The calculations are based on the code from @vitelot and I have added direction indicators below the chart.
If the histogram (TSV) is greater than zero and greater than the moving average, price should be moving long and there will be a green box below the chart.
If TSV falls below the moving average while still being greater than zero, the trend may be exhausting and has been coded to read Price Action Long - FAILURE with a black x below the chart.
If the histogram (TSV) is less than zero and less than the moving average, price should be moving short and there will be a red box below the chart.
If TSV rises above the moving average while still being less than zero, the trend may be exhausting and has been coded to read Price Action Short - FAILURE with a black x below the chart.
At times, the moving average may be above zero while TSV is below zero or vice versa. In these situations the chart will indicate long or short based on whether or not TSV is greater or less than zero. It is possible a new trend may be forming as the moving average obviously lags, but also possible price is consolidating with little volume and causing TSV to oscillate close to zero.
More information regarding Time Segmented Volume can be found here: www.worden.com
Original code ported by @liw0
Corrected by @vitelot
Updated/Enhancements by @eylwithsteph with inspiration from @storma
Multiple MA Options Credits to @Fractured and @lejmer
Bits and Pieces from @AlexGrover, @Montyjus, and @Jiehonglim
As always, trade at your own risk.

Enhanced Time Segmented VolumeTime Segmented Volume was developed by Worden Brothers, Inc to be a leading indicator by comparing various time segments of both price and volume. Essentialy it is designed to measure the amount of money flowing in and out of an instrument.
Time Segmented Volume was originally ported to TradingView by user @liw0 and later corrected by user @vitelot. I never quite understood how to read Time Segmented Volume until I ran across a version by user @storma where they indicated when price would be long or short, but that code also utilized the incorrect calculation from user @liw0.
In an effort to make Time Segmented Volume more accessible and easier to read, I have re-coded it here. The calculations are based on the code from @vitelot and I have added direction indicators below the chart.
If the histogram (TSV) is greater than zero and greater than the moving average, price should be moving long and there will be a green box below the chart.
If TSV falls below the moving average while still being greater than zero, the trend may be exhausting and has been coded to read Price Action Long - FAILURE with a black x below the chart.
If the histogram (TSV) is less than zero and less than the moving average, price should be moving short and there will be a red box below the chart.
If TSV rises above the moving average while still being less than zero, the trend may be exhausting and has been coded to read Price Action Short - FAILURE with a black x below the chart.
At times, the moving average may be above zero while TSV is below zero or vice versa. In these situations the chart will indicate long or short based on whether or not TSV is greater or less than zero. It is possible a new trend may be forming as the moving average obviously lags, but also possible price is consolidating with little volume and causing TSV to oscillate close to zero.
More information regarding Time Segmented Volume can be found here: www.worden.com
Original code ported by @liw0
Corrected by @vitelot
Updated/Enhancements by @eylwithsteph with inspiration from @storma
As always, trade at your own risk.

Long Wick TrialI've created this as a confirmation indicator to help know when market conditions are favorable to enter a trade. It measures volume, volatility, and ATR. It is not intended to tell you when to enter/exit the market, but use it with another indicator such as the mirror macd to filter out many losses and avoid entering the market during low volume or excessive volatility that may trip your stop loss.
Green = Favorable Market conditions
Yellow = Enter with caution, the market is moving sideways but is slightly trending
Orange = Enter with caution, the market is trending but extremely volatile and may trip stop loss early
Black = Shouldn't enter market here, market is moving sideways and volume is also low.
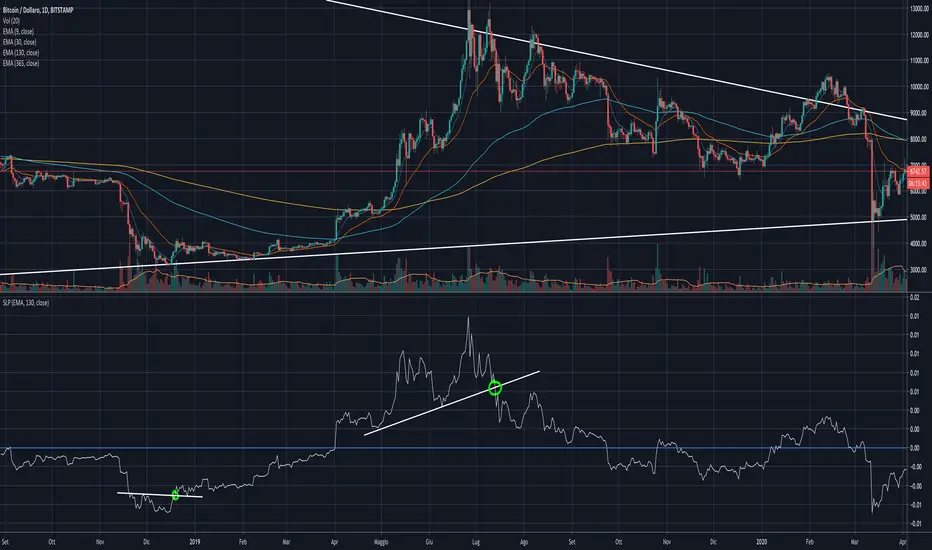
Moving Average SlopeA simple calculation and plotting of the slope of a Moving Average.
You'll be amazed looking at how accurate it is signaling early entries and exits from trend follower positions, just by applying some basic TA to it (support, resistance, trend lines).
Have a look:
In the settings, you can choose to use it on EMA on SMA, and the length of the MA involved.
I recommend using it on a medium-long sampling MA, to minimize noise.
Correlation Trend Indicator - Dr. John EhlersHot off the press, I present this "Correlation Trend Indicator" employing PSv4.0, originally formulated by Dr . John Ehlers for TASC - May 2020 Traders Tips. John Ehlers might describe it's characteristics as being a mean reverting trend identification oscillator range bound to +/-1.0 irregardless of any timeframe or asset. I could have finessed this indicator with all kinds of bells and whistles, but I wanted to keep it simple and handy enough for novice Pine programmers or Tradingview newcomers to use. This algorithm, in a slightly modified form, is actually a small portion of the base code for John Ehlers' highly complex Autocorrelation Periodogram and his Convolution SwamiChart.
Some members may have notice that I published a very similar script last month. That is correct. It's sole intention was completely different, having more diverse versatility and complexity, but with slightly reduced computational performance. While they seem eerily similar, they are genetically different. This function only has only one required "series" parameter and the correlation is calculated using the period, not bar_index. Correlating with bar_index or period yields identical results either way. Bottom line, this indicator is elegantly simplistic, yet highly utilitarian and easy to use.
Features List Includes:
Dark Background - Easily disabled in indicator Settings->Style for "Light" charts or with Pine commenting
AND a few more... You have the source!
The comments section below is solely just for commenting and other remarks, ideas, compliments, etc... regarding only this indicator, not others. When available time provides itself, I will consider your inquiries, thoughts, and concepts presented below in the comments section, should you have any questions or comments regarding this indicator. When my indicators achieve more prevalent use by TV members, I may implement more ideas when they present themselves as worthy additions. As always, "Like" it if you simply just like it with a proper thumbs up, and also return to my scripts list occasionally for additional postings. Have a profitable future everyone!

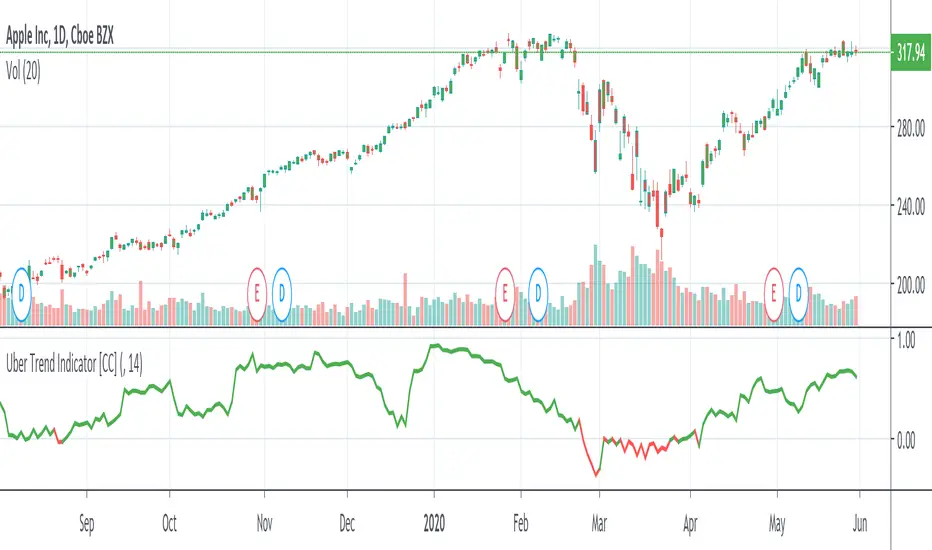
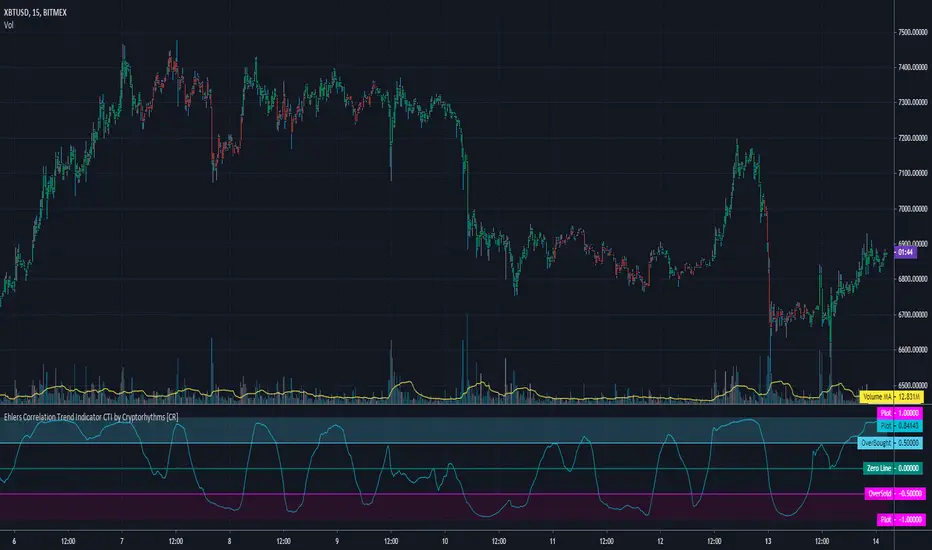
Ehlers Correlation Trend Indicator CTI by Cryptorhythms [CR]Ehlers Correlation Trend Indicator CTI by Cryptorhythms
📜Intro
In his article “Correlation As A Trend Indicator” in issue May 2020 of TASC, author John Ehlers introduces a new trend indicator that is based on the correlation between a security’s price history and the ideal trend: a straight line. He describes methods for using the indicator to not only identify the onset of new trends but to identify trend failures as well. He presents what looks like a simple and elegant idea for a trend-detection and mode-switching indicator.
📋Comments
Careful market selection may be the key to a correct application of the indicator. Even such barebone rules could shine with stocks like AAPL that tend to develop prolonged trends. But for others like CAT, which can keep oscillating in ranges for years, results will be much less impressive. They require a different approach. For example, you would want to buy when Correlation Trend falls significantly below zero and sell when it reaches positive values.
Therefore, it would be an interesting problem to research Correlation Trend’s ability to identify the switch to a cycle mode. That might help develop countertrend systems and
trade pullbacks. Another possible application might be to act as a system filter of change from trending mode to mean-reversion mode.
Extras
As usual when porting indicators to the library here on tradingview, I like to add some extra flare!
💠Customizable Overbought and Oversold Zones for Alert Creation
💠Bar coloration based on trade state for easy visual at a glance chart checking
💠Some basic example Entry and Exit conditions and a simple Trade State Engine to get you going creating your own strategy
Enjoy!
👍 We hope you enjoyed this indicator and find it useful! We post free crypto analysis, strategies and indicators regularly. This is our 81st script on Tradingview!
Fancy Triple Moving Averages [BigBitsIO]This script is for three moving averages with as many features as I can possibly fit into a single moving average.
Features:
- Three moving averages (MA1, MA2, MA3).
- Standard MA inputs.
- MA type.
- MA period.
- MA price.
- MA resolution (time frame).
- Visibility toggle.
- MA Candle Type
- Fancy MA inputs.
- Toggle to show only candles included in the MA calculation ("Highlight inclusion") or display entire MA history.
- Toggle to show a ghost trail when Highlight inclusion is toggled on. Displays a shaded version of past MA history before the inclusion period (as seen on snapshot).
- Toggle to show forecast values for the MA.
- Other inputs related to forecasting:
- Forecast bias. (Neutral forecasts MA if the current price remains the same.)
- Forecast period.
- Forecast magnitude.
*** DISCLAIMER: For educational and entertainment purposes only. Nothing in this content should be interpreted as financial advice or a recommendation to buy or sell any sort of security or investment including all types of crypto. DYOR, TYOB. ***

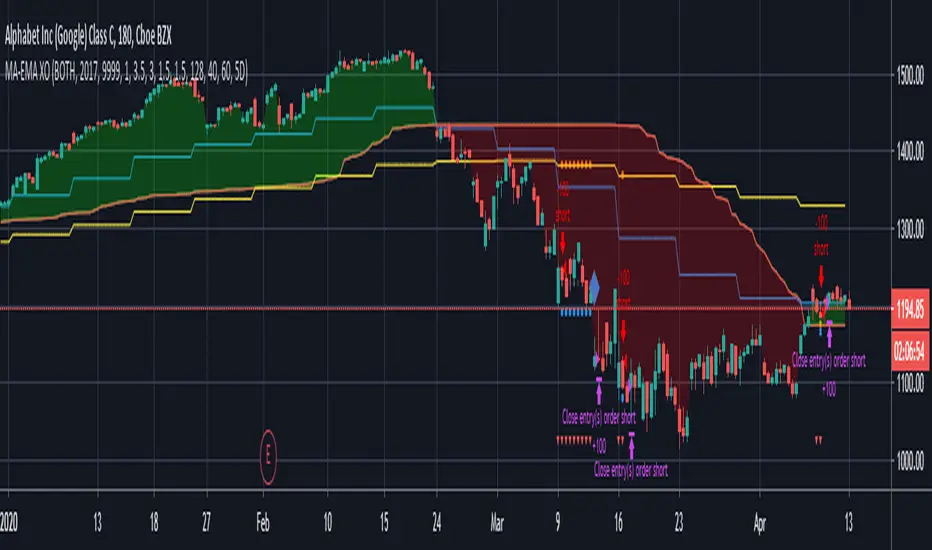
MA-EMA Crossover LTJust a simple strategy based on dynamic zones by Allenster. Still a work in progress.
Follow Line IndicatorThe FollowLine indicator is a trend following indicator. The blue/red lines are activated when the price closes above the upper Bollinger band or below the lower one.
Once the trigger of the trend direction is made, the FollowLine will be placed at High or Low (depending of the trend).
An ATR filter can be selected to place the line at a more distance level than the normal mode settled at candles Highs/Lows.
Alerts Added

Underworld Hunter + Base ZoneUnderworld Hunter + Base Zone is designed to keep traders out of ranging markets by establishing a "dead zone" between the bands where price may be choppy or trends may be short lived. The original Underworld Hunter from @greenmask9 adapted Bollinger Bands by changing the basis from SMA to the EMA of the EMA of the EMA. This version now allows the user to select which moving average they would like to utilize for the calculation.
If price is outside of the upper bands, price may be bullish. If price is outside the lower bands, price may be bearish.
If price is within the green or red areas of the bands, a trend may be forming.
The system also plots when RSI has become over extended above the thresholds selected (70/20 is the default).
MA Period is the length/period the moving average is calculated with
MA Mode is the type of moving average that will be utilized in the basis calculation
The "Standard MA Calculation" Option changes the basis to calculate the moving average selected in MA Mode only once, instead of 3 times
Deviation 1 and Deviation 2 determine how far the dead zone bands will be from the basis
RSI Period is the length/period the RSI function is calculated with
RSI Extended - High Cutoff is the level RSI must reach to be marked as over extended. Most traders refer to this zone as "Overbought"
RSI Extended - Low Cutoff is the level RSI must reach to be marked as over extended. Most traders refer to this zone as "Oversold"
As many NNFx traders know, overbought and oversold essentially do not exist, though the zones can still be utilized
The remaining options are utilized for specific moving average calculations and are set to what is typically considered as "standard" for their values.
There are many options available for this code. The code has not been optimized but merely compiled. Settings should be adjusted for the instrument(s) you are trading.
Adapted from user @greenmask9
Multiple MA Options Credits to @Fractured and @lejmer
Bits and Pieces from @AlexGrover, @Montyjus, and @Jiehonglim
As always, trade at your own risk.

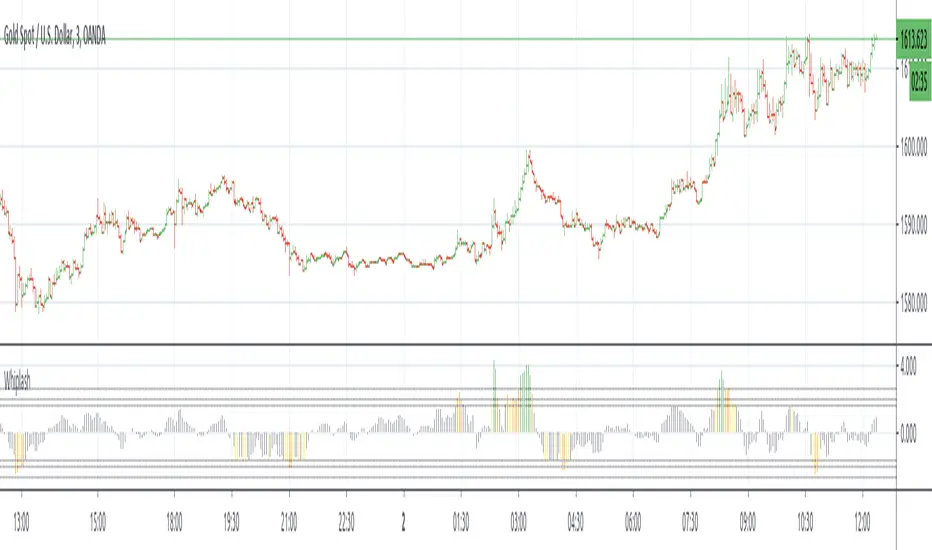
WhipLashThis is a study to determine if small candle bodies (little difference between open and close), regardless of overall candle length (high/low), can be used to filter choppy markets.
The indicator will calculate the selected average "MA Mode" of (close-open). To standardize this result and ensure any filters/thresholds do not need to be recalculated for each instrument the result will be used to calculate the Z Score.
The idea is that when candle bodies are small there is very little actual price movement, and therefore price is choppy. When considering the Z Score of that result, any outliers ie larger candle bodies, could show a potential trend forming. This indicator is similar to QStick but allows more customization by the user.
MA Mode determines which MA is used to smooth the results of (close-open)
Price Smoothing is the number of running periods the MA Mode is calculated for.
The three Thresholds are preset to the 90%, 95%, and 99% levels for Z Score. If these thresholds are altered you may wish to also alter the horizontal lines programmed for each level on the positive and negative sides.
The Z Length is the period for which the Z Score is calculated
Multiple MA Options Credits to @Fractured
Bits and Pieces from @AlexGrover, @Montyjus, and @Jiehonglim
As always, trade at your own risk.