Gann Swings Trend CounterBased on Rick Santos ' Swing Charts V1 Darvas Box V0.1'
However I have migrated script to pine version 3, customized to suite and added a higher number for the trend count
Trend

Febres StrategyThe strategy consist in every time that price failed to break any of the EMAs, we need to wait for the right price action and make a buy or sell when it bounce from it to keep surfing on the trend (using the stochastic oscillator and the 5-13 EMAs cross as an additional confirmation).
When do we start looking for a change on the trend? When it repeats the blue tracer (high or low of the previous day) without breaking it and bouncing from it, there will be our signal to start looking for a change of direction on the trend.
Only applicable on 15 minute chart.


Pullback Trading [Fhenry0331]The indicator is taken from Alexander Elders "Triple Screen System," minus using the Weekly MACD as a filter/trend. I believe waiting for the force index and the weekly MACD histogram to line-up is uber conservative and a trader will miss too many signals (In my opinion).
The indicator is for a pullback trader. A trader that waits for a trend to develop then enters on a pullback.
The indicator defines an uptrend start: as the 13 ema crossing above the 26 ema. It defines a downtrend start: as the 13 ema crossing below the 26 ema.
The pullback in an uptrend: 13 ema is above the 26 ema. Elders-Force-Index is below the zero line. Price low has crossed below the 13 ema (one can also say price closes below the 13 ema if they so wish).
The pullback in a downtrend: 13 ema is below the 26 ema. Elders-Force-Index is above the zero line. Price high has also crossed above the 13 ema.
Please note that the pullback signals do not necessitate an automatic buy or sell (the instrument can be still pulling back deeper and not ready to resume it's trend.) One should place orders above (long) or below (short) bars with the pullback signals. Do so on signals until orders are filled.
Although the indicator is meant for pullbacks one can make an aggressive entry at the onset of a crossover of ema's.
For clarity background colors has been added to the indicator.
works well on daily time frame. Also look at intraday (5) minute time frame on trending stocks (news, earnings, volume, etc.)
Keep It Simple.
Enjoy!

Stiffness IndicatorThis indicator was originally developed by Markos Katsanos (Stocks & Commodities, V.36:12 (November, 2018): "The Stiffness Indicator").
Like and follow for more open source indicators!
Happy Trading!

Klinger Volume OscillatorThis indicator was originally developed by Stephen J. Klinger (Stocks & Commodities, V.15:12 (December, 1997): "Identifying Trends with Volume Analysis").
NOTE : this is the only correct version of Klinger Volume Oscillator in the public library.
Like and follow for more open source indicators!
Happy Trading!

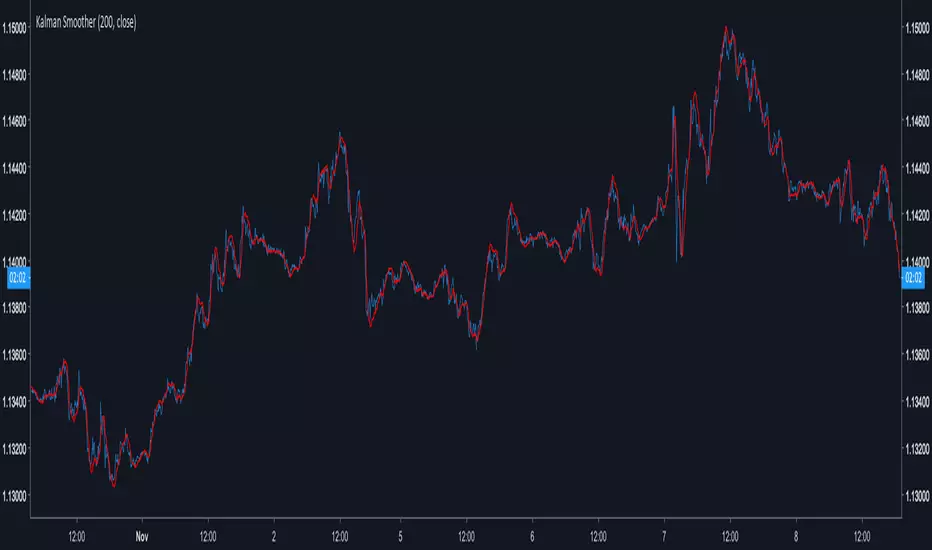
Kalman SmootherA derivation of the Kalman Filter.
Lower Gain values create smoother results.The ratio Smoothing/Lag is similar to any Low Lagging Filters.
The Gain parameter can be decimal numbers.
Kalman Smoothing With Gain = 20
For any questions/suggestions feel free to contact me
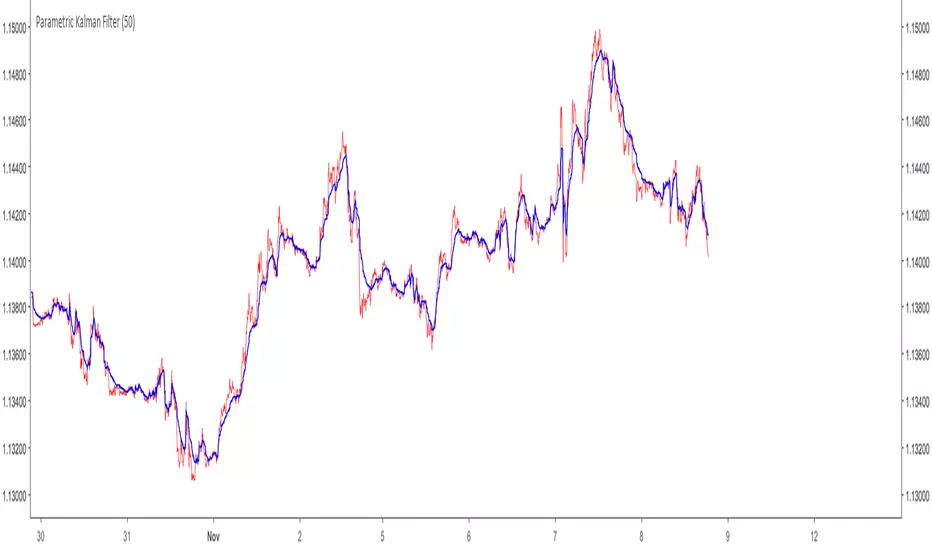
One Dimensional Parametric Kalman FilterA One Dimensional Kalman Filter, the particularity of Kalman Filtering is the constant recalculation of the Error between the measurements and the estimate.This version is modified to allow more/less filtering using an alternative calculation of the error measurement.
Camparison of the Kalman filter Red with a moving average Black of both period 50
Can be used as source for others indicators such as stochastic/rsi/moving averages...etc
For any questions/suggestions feel free to contact me
EMA TEMA crossoverHello,
as usual recently the chart is bugged if I dare post a log one so I deleted and reposted...
here is a simple ema/team script that could allow you to catch trends.
You can play with parameters to get alerted of strong trends, or to detect trends early on.
I want to adapt this to an inside bar strategy, I am going to release that in a while, it is not my priority thought I am a countertrend trader, so I cannot say why, but what I have seen is inside bar breaks in very strong trends work very well.
There is a condition for this inidcator to work: you have to use it on a Heikin Ashi chart (the candle type, selectable in the area right of the timeframe).
Works sometimes. I advice backtesting any strategy before using. Idk maybe this could work decently, seems to have given big winners on bch recently. That huge one from 600 to 1800 lol. *3
* No one should pay for things this simple by the way...

MA ZonesThis simple indicator paints the zone between up to 3 different Moving Averages and Exponential Moving Averages.
For example:
The green zone is the price between the 50 EMA and the 50 MA .
The orange zone is the price between the 100 EMA and the 100 MA .
The red zone is the price between the 200 EMA and the 200 MA .

Triple guppy w/ up/down colours - squattterThe trend is your friend.
Works well on 2hr TF which shows 30+60 ema from 8hr and Daily TFs.
Use a higher TF momentum indicator such as TRIX to confirm.

Auto-Line With DriftA variation on the Auto-Line indicator, we allow it to get closer to the price thanks to a drift , this also allow the line to be more directional .
This indicator can be used with moving averages using crosses as signals or as a band indicator by ploting a + dev as the upper band and a - dev as the lower one.
For any help or suggestions feel free to send a message :)

Cronos Trend Aroon by Zekis"The Aroon indicator is a technical indicator that is used to identify when trends are likely to change direction. In essence, the indicator measures the time it takes for the price to reach the highest and lowest points over a given timeframe as a percentage of total time. The indicator consists of the "Aroon up" line, which measures the strength of the uptrend, and the "Aroon down" line, which measures the strength of the downtrend."
Classic Aroon indicator with few changes:
1. Colors for trends: red line and red background = downtrend
green line and green background = uptrend
2. Crossover is signaled with an yellow stripe
3. Alerts are enabled for longs/entries and shorts/exits
Enjoy!
@ Zekis

Hermes Scalping Study by ZekisA simple scalping indicator, based on Highs and Lows.
It's working in any timeframe, the only condition is ... volatility .
Values are already set, but you can change them according to your preferences and to your chart.
Alerts are enabled.
Enjoy!
@ Zekis

Buying with momentumThis is a beginner script, any feedback is welcome.
It indicates a bull trend with or without volume (yellow and green arrow) and give a buy signal (green flag) once the trend is "confirmed" and the stock became good for the buy market.
I look forward to make this for a bear market as well, but it's not good for now.
Symbols and its meanings:
Yellow Arrows --> When the EMA of 9 candles and the MA of 21 candles are higher then the previous candle.
Green Arrows --> When the EMA of 9 candles and the MA of 21 candles are higher then the previous candle and the volume is higher than the MA of 21 candles.
Green Flag --> The previous candles has a green arrow and the running candle reaches the previous candle high + 1 point/cent.

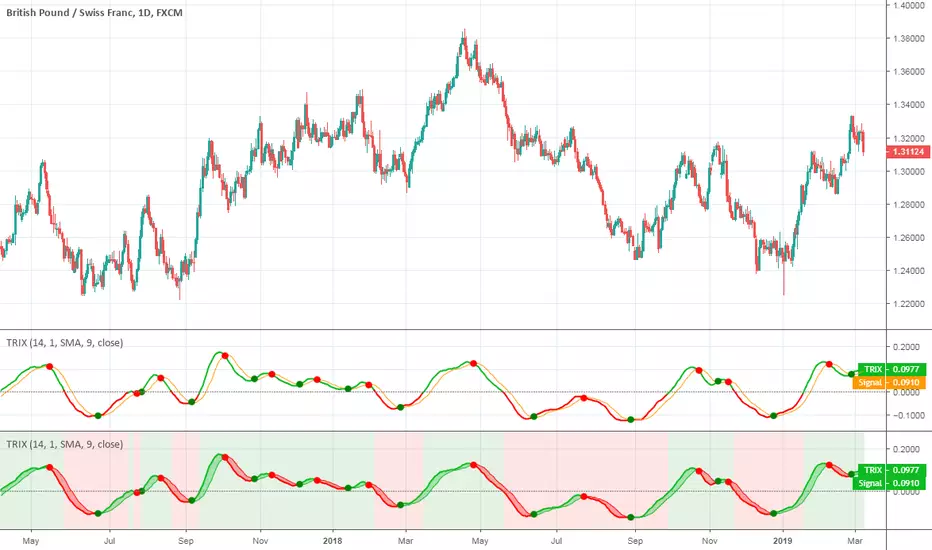
TRIXThis indicator was originally developed by Jack K. Hutson (Stocks & Commodities (July 1983): "Good TRIX").