cd_HTF_bias_CxOverview:
No matter our trading style or model, to increase our success rate, we must move in the direction of the trend and align with the Higher Time Frame (HTF). Trading "gurus" call this the HTF bias. While we small fish tend to swim in all directions, the smart way is to flow with the big wave and the current. This indicator is designed to help us anticipate that major wave.
________________________________________
Details and Usage:
This indicator observes HTF price action across preferably seven different pairs, following specific rules. It confirms potential directional moves using CISD levels on a Medium Time Frame (MTF). In short, it forecasts the likely direction (HTF bias). The user can then search for trade opportunities aligned with this bias on a Lower Time Frame (LTF), using their preferred pair, entry model, and style.
________________________________________
Timeframe Alignment:
The commonly accepted LTF/MTF/HTF combinations include:
• 1m – 15m – H4
• 3m – H1 – Daily / 3m – 30m – Daily
• 5m – H1 – Daily
• 15m – H4 – Weekly
• H1 – Daily – Monthly
• H4 – Weekly – Quarterly
Example: If you're trading with a 3m model on a 30m/3m setup, you should seek trades in the direction of the H1/Daily bias.
________________________________________
How It Works:
The indicator first looks for sweeps on the selected HTF — when any of the last four candles are swept, the first condition is met.
The second step is confirmation with a CISD close on the MTF — once a candle closes above/below the CISD level, the second condition is fulfilled. This suggests the price has made its directional decision.
Example: If a previous HTF candle is swept and we receive a bearish CISD confirmation on H1, the HTF bias becomes bearish.
After this, you may switch to a more granular setup like HTF: 30m and MTF: 3m to look for trade entries aligned with the bias (e.g., 30m sweep + 3m CISD).
________________________________________
How Is Bias Determined?
• HTF Sweep + MTF CISD = SC (Sweep & CISD)
• Latest Bullish SC → Bias: Bullish
• Latest Bearish SC → Bias: Bearish
• Price closes above the last Bearish SC → Bias: Strong Bullish
• Price closes below the last Bullish SC → Bias: Strong Bearish
• Strong Bullish bias + Bearish CISD (without HTF sweep) → Bias: Bullish
• Strong Bearish bias + Bullish CISD (without HTF sweep) → Bias: Bearish
• Bearish price violates SC high, but Bullish SC is untouched → Bias: Bullish
• Bullish price violates SC low, but Bearish SC is untouched → Bias: Bearish
• If neither side generates SC → Bias: No Bias
The logic is built on the idea that a price overcoming resistance is stronger, and encountering resistance is weaker. This model is based on the well-known “Daily Bias” structure, but with personal refinements.
________________________________________
What’s on the Screen?
• Classic HTF zones (boxes)
• Potential MTF CISD levels
• Confirmed MTF lines
• Sweep zones when HTF sweeps occur
• Result table showing current bias status
________________________________________
Usage:
• Select HTF and MTF timeframes aligned with your trading timeframe.
• Adjust color and position settings as needed.
• Enter up to seven pairs to track via the menu.
• Use the checkbox next to each pair to enable/disable them.
• If “Ignore these assets” is checked, all pairs will be disabled, and only the currently open chart pair will be tracked.
________________________________________
Alerts:
You can choose alerts for Bullish, Bearish, Strong Bullish, or Strong Bearish conditions.
There are two types of alert sources:
1. From the indicator’s internal list
2. From TradingView’s watchlist
Visual example:
________________________________________
How I Use It:
• For spot trades, I use HTF: Weekly and MTF: H4 and look for Bullish or Strong Bullish pairs.
• For scalping, I follow bias from HTF: Daily and MTF: H1.
Example: If the indicator shows a Bearish HTF Bias, I switch to HTF: 30m and MTF: 3m and enter trades once bearish conditions are met (timeframe alignment).
________________________________________
Important Notes:
• The indicator defines CISD levels only at HTF high and low levels.
• If your chart is on a higher timeframe than your selected HTF/MTF, no data will appear.
Example: If HTF = H1 and MTF = 5m, opening a chart on H4 will result in a blank screen.
• The drawn CISD level on screen is the MTF CISD level.
• Not every alert should be traded. Always confirm with personal experience and visual validation.
• Receiving multiple Strong Bullish/Bearish alerts is intentional. (Trick 😊)
• Please share your feedback and suggestions!
________________________________________
And Most Importantly:
Don't leave street animals without water and food!
Happy trading!
Trend Analysis

Dark Pool Block Trades - Institutional Volume📊 Dark Pool Block Trades - Institutional Volume
Visualize where institutional money positions before major price moves occur. This indicator reveals hidden dark pool block trades that often precede significant price movements - because when smart money deploys millions and billions in strategic accumulation or distribution, retail traders need to see where it's happening.
🎯 WHY DARK POOL DATA MATTERS:
Institutions don't move large capital randomly. Dark pool block trades represent strategic positioning by sophisticated money managers with superior research and conviction. These trades create hidden support/resistance levels that often predict future price action.
The key principle: Follow institutional flow, don't fight it. When institutions get involved, they create high-probability trading opportunities.
💰 HOW INSTITUTIONS INFLUENCE PRICE:
- Large block trades establish hidden accumulation/distribution zones
- Smart money builds positions BEFORE retail awareness increases
- Institutional activity creates "footprints" at key technical levels
- These trades often signal conviction plays ahead of major moves
- Institutions typically add to winning positions throughout trends
🔍 WHAT THIS INDICATOR SHOWS:
- Visual overlay of dark pool block trades directly on price charts
- Track institutional positioning across major stocks and ETFs
- Identify accumulation/distribution zones before they become obvious to retail
- Spot high-conviction institutional trades in real-time visualization
- Customizable block trade size filters and timeframe selection
- Historical institutional activity up to 5 years or custom ranges
💡 THE TRADING ADVANTAGE:
Instead of guessing price direction, see where institutions are already positioning. When large block trades appear in dark pools, you're witnessing strategic institutional commitment that frequently leads to significant price movements.
⚡ HOW IT WORKS:
This Pine Script displays institutional dark pool transactions as visual markers on your charts. The script comes with sample data for immediate use. For expanded ticker coverage and real-time updates, external data services are available.
🎯 IDEAL FOR:
- Swing traders following institutional footprints
- Traders seeking setups backed by smart money conviction
- Position traders looking for accumulation zones
- Anyone wanting to align with institutional flow rather than fight it
🔄 SAMPLE DATA INCLUDED:
Pre-loaded with institutional activity data across popular tickers, updated daily to demonstrate how dark pool activity correlates with future price movements.
The script initially covers these tickers going back 6 months showing the top 10 trades by volume over 400,000 shares: AAPL, AMD, AMZN, ARKK, ARKW, BAC, BITO, COIN, COST, DIA, ETHA, GLD, GOOGL, HD, HYG, IBB, IWM, JNJ, JPM, LQD, MA, META, MSFT, NVDA, PG, QQQ, RIOT, SLV, SMCI, SMH, SOXX, SPY, TLT, TSLA, UNH, USO, V, VEA, VNQ, VOO, VTI, VWO, WMT, XLE, XLF, XLK, XLU, XLV, XLY

Smooth Cloud + RSI Liquidity Spectrum + Zig Zag Volume ProfileSmooth Cloud + RSI Liquidity Spectrum + Zig Zag++ Volume Profile" Indicator
| Advanced Trend & Liquidity Analysis.
---
📌 Key Features & Enhancements (Zig Zag++)
This advanced indicator combines **trend-following moving averages, RSI momentum with liquidity factors, and an improved Zig Zag++ algorithm with volume profiling** for precise swing detection.
🔹 Zig Zag++ Upgrades:
✅ **Dynamic Reversal Detection** – Adapts to volatility using percentage-based pivots.
✅ **Volume-Weighted Swing Points** – Highlights high-liquidity turning points.
✅ **Multi-Timeframe Confirmation** – Uses historical pivots for stronger signals.
✅ **Volume Profile Clustering** – Reveals key support/resistance zones based on traded volume.
---
📊 Indicator Components Breakdown
1️⃣ Smooth Cloud (Trend Filter)
- **Fast MA (20-period) & Slow MA (50-period)** – Configurable as EMA, SMA, or WMA.
- **Cloud Coloring** – Green when fast MA > slow MA (bullish), red otherwise (bearish).
- **Purpose**: Acts as a trend filter—only take trades in the direction of the cloud.
2️⃣ RSI Liquidity Spectrum (Momentum + Volume)
- **RSI (14-period default)** – Standard momentum oscillator.
- **Liquidity-Adjusted Momentum** = `(RSI + ROC(RSI,3)) * (Volume / SMA(Volume, RSI Length))`
- **Purpose**: Identifies overbought/oversold conditions with volume confirmation (high volume = stronger signal).
3️⃣ Zig Zag++ (Swing Detection & Volume Profiling)
📈 Zig Zag Logic:**
- **Percentage-Based Reversals** (default: 5%) – Only plots swings exceeding this threshold.
- **Pivot Tracking** – Stores price & bar index of each swing point in arrays.
- **Dynamic Line Drawing** – Connects swing points with yellow trendlines.
📊 Volume Profile at Swings:
- **Lookback Period** (200 bars default) – Analyzes volume distribution between Zig Zag turns.
- **10-Price Bin Clustering** – Splits the price range into 10 levels and calculates traded volume at each.
- **Transparency Scaling** – Higher volume zones appear darker (stronger support/resistance).
---
🎯 Step-by-Step Trading Strategies
📈 Strategy 1: Trend-Following with RSI Liquidity Confirmation**
1. **Enter Long** when:
- Smooth Cloud is **green** (fast MA > slow MA).
- RSI Liquidity Momentum crosses above **30** (bullish momentum + volume).
- Price pulls back to the **Volume Profile high-volume zone** (demand area).
2. **Enter Short** when:
- Smooth Cloud is **red** (fast MA < slow MA).
- RSI Liquidity Momentum crosses below **70** (bearish momentum + volume).
- Price rallies into the **Volume Profile high-volume zone** (supply area).
3. **Exit** when:
- Zig Zag++ detects a new reversal (5% move against position).
- RSI Liquidity Momentum crosses back mid-level (50).
---
📉 Strategy 2: Swing Trading with Zig Zag++ Pivots**
1. **Buy at Swing Lows** when:
- Zig Zag++ prints a **higher low** (bullish structure).
- Volume Profile shows **strong absorption** (high volume at the low).
- RSI Liquidity Momentum is rising from oversold (<30).
2. **Sell at Swing Highs** when:
- Zig Zag++ prints a **lower high** (bearish structure).
- Volume Profile shows **distribution** (high volume at the top).
- RSI Liquidity Momentum is falling from overbought (>70).
3. **Stop Loss**:
- Below the recent Zig Zag low (for longs).
- Above the recent Zig Zag high (for shorts).
---
📌 Additional Enhancements (Pro Tips)**
- **Combine with Higher Timeframe (HTF) Cloud** – Use a 4H/1D cloud to filter trades.
- **Divergence Detection** – Hidden bullish/bearish divergences between Zig Zag & RSI Liquidity.
- **Volume Spike Confirmation** – Only trade if volume exceeds SMA(volume, 20) at reversal points.
---
🚀 Conclusion
This **all-in-one indicator** provides:
✔ **Trend direction** (Smooth Cloud)
✔ **Momentum + Liquidity strength** (RSI Spectrum)
✔ **Precise swing points** (Zig Zag++)
✔ **Volume-based S/R zones** (Profile Clustering)
Best used on **15M-4H timeframes** for swing/day trading. Adjust parameters based on asset volatility.

Profitable Pullback Strategy Mark804📝 Strategy Description: Pullback Trading Strategy v2.0 by Mark804
Overview
This strategy is a refined, trend-following pullback system designed to identify high-probability entry points within an established trend. Based on **EMA stacking**, it captures short-term retracements (pullbacks) in the direction of the larger trend. It has been fully updated to **Pine Script v5** with dynamic inputs, clear visualization, backtesting functionality, and risk management via stop loss and take profit.
---
🔧 How It Works
1. **Trend Detection**
The strategy first identifies a trend using a combination of four EMAs:
* **Fast EMA**
* **Signal EMA**
* **Medium EMA**
* **Slow EMA** (optional filter)
A valid trend is defined by **EMA stacking**:
* **Uptrend**: Fast > Signal > Medium (> Slow, if enabled)
* **Downtrend**: Fast < Signal < Medium (< Slow, if enabled)
This ensures the strategy trades **only in the direction of the dominant trend**, avoiding countertrend setups.
---
2. **Pullback Entry Conditions**
The strategy looks for pullbacks (retracements) within the confirmed trend:
*Buy Setup (Long Pullback)**:
* In an uptrend
* Price **closes below** the Signal EMA on the previous bar
* Then **closes back above** the Signal EMA on the current bar
* **Sell Setup (Short Pullback)**:
* In a downtrend
* Price **closes above** the Signal EMA on the previous bar
* Then **closes back below** the Signal EMA on the current bar
These conditions aim to enter on price dips or rallies that offer better entries while staying aligned with trend momentum.
---
3. **Entry & Exit Logic**
When a pullback signal is detected:
* A **market order** is placed in the trend direction
* A **take profit** and **stop loss** is applied immediately based on percentage inputs
Example:
* Take Profit: 2% above entry (for long)
* Stop Loss: 1% below entry (for long)
This creates a favorable **risk-to-reward ratio** and clear exit strategy.
---
4. **Customizable Inputs**
All key parameters can be tuned via the script’s settings panel:
* `maSrc`: Source for EMAs (default: `close`)
* `fastLen`, `signalLen`, `mediumLen`, `slLen`: EMA lengths
* `slEnabled`: Toggle to include the slow EMA as a trend filter
* `takeProfitPct`, `stopLossPct`: % values for TP and SL
* `showRibbon`: Toggle visibility of EMA lines (the "ribbon")
This flexibility allows optimization for different timeframes, assets, or market conditions.
---
5. **Visuals & Alerts**
* **EMA Ribbon**: Optionally plots all 4 EMAs in distinct colors
* **Alerts**: Configurable alerts for both Buy and Sell pullback signals
* **Strategy Tester**: Fully compatible with TradingView’s backtester to review performance
---
✅ Key Features
* Pine Script **v5** compatible
* Simple yet powerful **trend-pullback strategy**
* Built-in **risk management** (TP/SL)
* Highly **customizable** and easy to optimize
* Works on **any timeframe or market** (stocks, crypto, forex, etc.)
* Optional **EMA Ribbon** and slow filter for visual context
---
📊 Strategy Use Cases
* Intraday trading
* Swing trading
* Trend continuation setups
* Building automated systems in TradingView
* Manual trade confirmation for other systems
---
⚙️ Example Settings
| Parameter | Value |
| ----------------- | --------- |
| Fast EMA Length | 8 |
| Signal EMA Length | 13 |
| Medium EMA Length | 21 |
| Slow EMA Length | 55 |
| Take Profit (%) | 2.0 |
| Stop Loss (%) | 1.0 |
| Use Slow EMA | ✅ Enabled |
---
📌 Important Notes
* This is a **trend-following strategy**. Best results occur in trending markets.
* In sideways or choppy markets, false signals may occur. Consider using higher timeframes or combining with volume filters.
* You can expand this strategy further by integrating:
* Multi-timeframe trend confirmation
* Additional filters (e.g. RSI, MACD)
* Trailing stop loss for dynamic exits
* Visual overlays (e.g. pivot points, fractals) for added context

Moby Tick Prints - version 1.0.0Prints are aggregated by date and price. If there are multiple trades on the same day at the same price, they are added and represented in the Shares column

PulseWave Strategy Markking77PulseWave Strategy (Markking77) — Description & Indicator Roadmap
PulseWave Strategy (Markking77) is a sleek, straightforward trading system that fuses three powerful market indicators — VWAP, MACD, and RSI — into one harmonious tool. Designed for traders who want clear, actionable signals, this strategy captures trend direction, momentum shifts, and market strength to help you spot optimal entry and exit points.
Step 1: VWAP — The Market Trend Compass (Color: Blue)
What it does:
The Volume Weighted Average Price (VWAP) is the average price a security has traded at throughout the day, weighted by volume. It acts as a dynamic benchmark that many institutional traders rely on.
Why it matters:
Price above the VWAP (blue line) signals bullish momentum — buyers dominate.
Price below the VWAP signals bearish momentum — sellers in control.
PulseWave use:
VWAP sets the trend foundation — we trade in the direction the price sits relative to VWAP.
Step 2: MACD — Momentum Confirmation (Colors: Orange & Blue)
What it does:
MACD tracks momentum by comparing short-term and long-term moving averages, using the MACD line and a signal line to indicate shifts.
Why it matters:
When the MACD line (orange) crosses above the Signal line (blue), it signals rising momentum — a bullish cue.
When the MACD line crosses below the signal line, it signals weakening momentum — bearish cue.
PulseWave use:
MACD confirms momentum that aligns with the VWAP trend before entering trades.
Step 3: RSI — The Strength Filter (Color: Purple)
What it does:
The Relative Strength Index (RSI) measures how fast prices are changing to indicate overbought or oversold conditions.
Why it matters:
RSI above 70 = overbought (possible reversal or pause).
RSI below 30 = oversold (potential bounce).
PulseWave use:
RSI filters out trades taken at extreme price levels, avoiding entries that are too stretched.
Color-Coded Roadmap Summary:
Step Indicator Role Buy Signal Sell Signal Color
1 VWAP Trend Direction Price > VWAP (bullish) Price < VWAP (bearish) Blue
2 MACD Momentum Confirmation MACD line crosses above Signal line MACD line crosses below Signal line Orange & Blue
3 RSI Entry Filter RSI < 70 (not overbought) RSI > 30 (not oversold) Purple
How PulseWave Strategy Works:
Buy when price sits above VWAP, MACD line crosses above the Signal line, and RSI is below 70.
Sell (exit) when price drops below VWAP, MACD line crosses below the Signal line, and RSI is above 30.
This layered approach ensures you only trade when trend, momentum, and strength align — reducing false signals and improving your edge.
Why Use PulseWave Strategy?
Clear & Simple: No guesswork — clear color-coded signals guide your decisions.
Robust: Combines trend, momentum, and strength in one system.
Versatile: Fits day trading and swing trading styles alike.
Visual: Easily interpreted signals with minimal clutter.
Hurst Exponent Adaptive Filter (HEAF) [PhenLabs]📊 PhenLabs - Hurst Exponent Adaptive Filter (HEAF)
Version: PineScript™ v6
📌 Description
The Hurst Exponent Adaptive Filter (HEAF) is an advanced Pine Script indicator designed to dynamically adjust moving average calculations based on real time market regimes detected through the Hurst Exponent. The intention behind the creation of this indicator was not a buy/sell indicator but rather a tool to help sharpen traders ability to distinguish regimes in the market mathematically rather than guessing. By analyzing price persistence, it identifies whether the market is trending, mean-reverting, or exhibiting random walk behavior, automatically adapting the MA length to provide more responsive alerts in volatile conditions and smoother outputs in stable ones. This helps traders avoid false signals in choppy markets and capitalize on strong trends, making it ideal for adaptive trading strategies across various timeframes and assets.
Unlike traditional moving averages, HEAF incorporates fractal dimension analysis via the Hurst Exponent to create a self-tuning filter that evolves with market conditions. Traders benefit from visual cues like color coded regimes, adaptive bands for volatility channels, and an information panel that suggests appropriate strategies, enhancing decision making without constant manual adjustments by the user.
🚀 Points of Innovation
Dynamic MA length adjustment using Hurst Exponent for regime-aware filtering, reducing lag in trends and noise in ranges.
Integrated market regime classification (trending, mean-reverting, random) with visual and alert-based notifications.
Customizable color themes and adaptive bands that incorporate ATR for volatility-adjusted channels.
Built-in information panel providing real-time strategy recommendations based on detected regimes.
Power sensitivity parameter to fine-tune adaptation aggressiveness, allowing personalization for different trading styles.
Support for multiple MA types (EMA, SMA, WMA) within an adaptive framework.
🔧 Core Components
Hurst Exponent Calculation: Computes the fractal dimension of price series over a user-defined lookback to detect market persistence or anti-persistence.
Adaptive Length Mechanism: Maps Hurst values to MA lengths between minimum and maximum bounds, using a power function for sensitivity control.
Moving Average Engine: Applies the chosen MA type (EMA, SMA, or WMA) to the adaptive length for the core filter line.
Adaptive Bands: Creates upper and lower channels using ATR multiplied by a band factor, scaled to the current adaptive length.
Regime Detection: Classifies market state with thresholds (e.g., >0.55 for trending) and triggers alerts on regime changes.
Visualization System: Includes gradient fills, regime-colored MA lines, and an info panel for at-a-glance insights.
🔥 Key Features
Regime-Adaptive Filtering: Automatically shortens MA in mean-reverting markets for quick responses and lengthens it in trends for smoother signals, helping traders stay aligned with market dynamics.
Custom Alerts: Notifies on regime shifts and band breakouts, enabling timely strategy adjustments like switching to trend-following in bullish regimes.
Visual Enhancements: Color-coded MA lines, gradient band fills, and an optional info panel that displays market state and trading tips, improving chart readability.
Flexible Settings: Adjustable lookback, min/max lengths, sensitivity power, MA type, and themes to suit various assets and timeframes.
Band Breakout Signals: Highlights potential overbought/oversold conditions via ATR-based channels, useful for entry/exit timing.
🎨 Visualization
Main Adaptive MA Line: Plotted with regime-based colors (e.g., green for trending) to visually indicate market state and filter position relative to price.
Adaptive Bands: Upper and lower lines with gradient fills between them, showing volatility channels that widen in random regimes and tighten in trends.
Price vs. MA Fills: Color-coded areas between price and MA (e.g., bullish green above MA in trending modes) for quick trend strength assessment.
Information Panel: Top-right table displaying current regime (e.g., "Trending Market") and strategy suggestions like "Follow trends" or "Trade ranges."
📖 Usage Guidelines
Core Settings
Hurst Lookback Period
Default: 100
Range: 20-500
Description: Sets the period for Hurst Exponent calculation; longer values provide more stable regime detection but may lag, while shorter ones are more responsive to recent changes.
Minimum MA Length
Default: 10
Range: 5-50
Description: Defines the shortest possible adaptive MA length, ideal for fast responses in mean-reverting conditions.
Maximum MA Length
Default: 200
Range: 50-500
Description: Sets the longest adaptive MA length for smoothing in strong trends; adjust based on asset volatility.
Sensitivity Power
Default: 2.0
Range: 1.0-5.0
Description: Controls how aggressively the length adapts to Hurst changes; higher values make it more sensitive to regime shifts.
MA Type
Default: EMA
Options: EMA, SMA, WMA
Description: Chooses the moving average calculation method; EMA is more responsive, while SMA/WMA offer different weighting.
🖼️ Visual Settings
Show Adaptive Bands
Default: True
Description: Toggles visibility of upper/lower bands for volatility channels.
Band Multiplier
Default: 1.5
Range: 0.5-3.0
Description: Scales band width using ATR; higher values create wider channels for conservative signals.
Show Information Panel
Default: True
Description: Displays regime info and strategy tips in a top-right panel.
MA Line Width
Default: 2
Range: 1-5
Description: Adjusts thickness of the main MA line for better visibility.
Color Theme
Default: Blue
Options: Blue, Classic, Dark Purple, Vibrant
Description: Selects color scheme for MA, bands, and fills to match user preferences.
🚨 Alert Settings
Enable Alerts
Default: True
Description: Activates notifications for regime changes and band breakouts.
✅ Best Use Cases
Trend-Following Strategies: In detected trending regimes, use the adaptive MA as a trailing stop or entry filter for momentum trades.
Range Trading: During mean-reverting periods, monitor band breakouts for buying dips or selling rallies within channels.
Risk Management in Random Markets: Reduce exposure when random walk is detected, using tight stops suggested in the info panel.
Multi-Timeframe Analysis: Apply on higher timeframes for regime confirmation, then drill down to lower ones for entries.
Volatility-Based Entries: Use upper/lower band crossovers as signals in adaptive channels for overbought/oversold trades.
⚠️ Limitations
Lagging in Transitions: Regime detection may delay during rapid market shifts, requiring confirmation from other tools.
Not a Standalone System: Best used in conjunction with other indicators; random regimes can lead to whipsaws if traded aggressively.
Parameter Sensitivity: Optimal settings vary by asset and timeframe, necessitating backtesting.
💡 What Makes This Unique
Hurst-Driven Adaptation: Unlike static MAs, it uses fractal analysis to self-tune, providing regime-specific filtering that's rare in standard indicators.
Integrated Strategy Guidance: The info panel offers actionable tips tied to regimes, bridging analysis and execution.
Multi-Regime Visualization: Combines adaptive bands, colored fills, and alerts in one tool for comprehensive market state awareness.
🔬 How It Works
Hurst Exponent Computation:
Calculates log returns over the lookback period to derive the rescaled range (R/S) ratio.
Normalizes to a 0-1 value, where >0.55 indicates trending, <0.45 mean-reverting, and in-between random.
Length Adaptation:
Maps normalized Hurst to an MA length via a power function, clamping between min and max.
Applies the selected MA type to close prices using this dynamic length.
Visualization and Signals:
Plots the MA with regime colors, adds ATR-based bands, and fills areas for trend strength.
Triggers alerts on regime changes or band crosses, with the info panel suggesting strategies like momentum riding in trends.
💡 Note:
For optimal results, backtest settings on your preferred assets and combine with volume or momentum indicators. Remember, no indicator guarantees profits—use with proper risk management. Access premium features and support at PhenLabs.

ZenAlgo - ADXThis open-source indicator builds upon the official Average Directional Index (ADX) implementation by TradingView. It preserves the core logic of the original ADX while introducing additional visualization features, configurability, and analytical overlays to assist with directional strength analysis.
Core Calculation
The script computes the ADX, +DI, and -DI based on smoothed directional movement and true range over a user-defined length. The smoothing is performed using Wilder’s method, as in the original implementation.
True Range is calculated from the current high, low, and previous close.
Directional Movement components (+DM, -DM) are derived by comparing the change in highs and lows between consecutive bars.
These values are then smoothed, and the +DI and -DI are expressed as percentages of the smoothed True Range.
The difference between +DI and -DI is normalized to derive DX, which is further smoothed to yield the ADX value.
The indicator includes a selectable signal line (SMA or EMA) applied to the ADX for crossover-based visualization.
Visualization Enhancements
Several plots and conditions have been added to improve interpretability:
Color-coded histograms and lines visualize DI relative to a configurable threshold (default: 25). Colors follow the ZenAlgo color scheme.
Dynamic opacity and gradient coloring are used for both ADX and DI components, allowing users to distinguish weak/moderate/strong directional trends visually.
Mirrored ADX is internally calculated for certain overlays but not directly plotted.
The script also provides small circles and diamonds to highlight:
Crossovers between ADX and its signal line.
DI crossing above or below the 25 threshold.
Rising ADX confirmed by rising DI values, with point size reflecting ADX strength.
Divergence Detection
The indicator includes optional detection of fractal-based divergences on the DI curve:
Regular and hidden bullish and bearish divergences are identified based on relative fractal highs/lows in both price and DI.
Detected divergences are optionally labeled with 'R' (Regular) or 'H' (Hidden), and color-coded accordingly.
Fractal points are defined using 5-bar patterns to ensure consistency and reduce false positives.
ADX/DI Table
When enabled, a floating table displays live values and summaries:
ADX value , trend direction (rising/falling), and qualitative strength.
DI composite , trend direction, and relative strength.
Contextual power dynamics , describing whether bulls or bears are gaining or losing strength.
The background colors of the table reflect current trend strength and direction.
Interpretation Guidelines
ADX indicates the strength of a trend, regardless of its direction. Values below 20 are often considered weak, while those above 40 suggest strong trending conditions.
+DI and -DI represent bullish and bearish directional movements, respectively. Crossovers between them are used to infer trend direction.
When ADX is rising and either +DI or -DI is dominant and increasing, the trend is likely strengthening.
Divergences between DI and price may suggest potential reversals but should be interpreted cautiously and not in isolation.
The threshold line (default 25) provides a basic filter for ignoring low-strength conditions. This can be adjusted depending on the market or timeframe.
Added Value over Existing Indicators
Fully color-graded ADX and DI display for better visual clarity.
Optional signal MA over ADX with crossover markers.
Rich contextual labeling for both divergence and threshold events.
Power dynamics commentary and live table help users contextualize current momentum.
Customizable options for smoothing type, divergence display, table position, and visual offsets.
These additions aim to improve situational awareness without altering the fundamental meaning of ADX/DI values.
Limitations and Disclaimers
As with any ADX-based tool, this indicator does not indicate market direction alone —it measures strength, not trend bias.
Divergence detection relies on fractal patterns and may lag or produce false positives in sideways markets.
Signal MA crossovers and DI threshold breaks are not entry signals , but contextual markers that may assist with timing or filtering other systems.
The table text and labels are for visual assistance and do not replace proper technical analysis or market context.

Multi-Timeframe SFP + SMTImportant: Please Read First
This indicator is not a "one size fits all" solution. It is a professional and complex tool that requires you to learn how to use it, in addition to backtesting different settings to discover what works best for your specific trading style and the assets you trade. The default settings provided are my personal preferences for trading higher-timeframe setups, but you are encouraged to experiment and find your own optimal configuration.
Please note that while this initial version is solid, it may still contain small errors or bugs. I will be actively working on improving the indicator over time. Also, be aware that the script is not written for maximum efficiency and may be resource-intensive, but this should not pose a problem for most users.
The source code for this indicator is open. If you truly want to understand precisely how all the logic works, you can copy and paste the code into an AI assistant like Gemini or ChatGPT and ask it to explain any part of the script to you.
Author's Preferred Settings (Guideline)
As a starting point, here are the settings I personally use for my trading:
SFP Timeframe: 4-Hour (Strength: 5-5)
Max Lookback: 35 Bars
Raid Expiration: 1 Bar
SFP Lines Limit: 1
SMT Timeframe 1: 30-Minute (Strength: 2-2) with 3-Minute LTF Detection.
SMT Timeframe 2: 15-Minute (Strength: 3-3) with 3-Minute LTF Detection.
SMT Timeframe 3: 1-Hour (Strength: 1-1) with 3-Minute LTF Detection.
SMT Timeframe 4: 15-Minute (Strength: 1-1) with 3-Minute LTF Detection.
Multi-Timeframe SMT: An Overview
This indicator is a powerful tool designed to identify high-probability trading setups by combining two key institutional concepts: Swing Failure Patterns (SFP) on a higher timeframe and Smart Money Technique (SMT) divergences on a lower timeframe. A key feature is the ability to configure and run up to four independent SMT analyses simultaneously, allowing you to monitor for divergences across multiple timeframes (e.g., 15m, 1H, 4H) from a single indicator.
Its primary purpose is to generate automated signals through TradingView's alert system. By setting up alerts, the script runs server-side, monitoring the market for you. When a setup presents itself, it will send a push notification to your device, allowing you to personally evaluate the trade without being tied to your screen.
The Strategy: HTF Liquidity Sweeps into LTF SMT
The core strategy is built on a classic institutional trading model:
Wait for a liquidity sweep on a significant high timeframe (e.g., 4-hour, Daily).
Once liquidity is taken, look for a confirmation of a shift in market structure on a lower timeframe.
This indicator uses an SMT divergence as that confirmation signal, indicating that smart money may be stepping in to reverse the price.
How It Works: The Two-Step Process
The indicator's logic follows a precise two-step process to generate a signal:
Step 1: The Swing Failure Pattern (SFP)
First, the indicator identifies a high-timeframe liquidity sweep. This is configured in the "Swing Failure Pattern (SFP) Timeframe" settings.
It looks for a candle that wicks above a previous high (or below a previous low) but then closes back within the range of that pivot. This action is known as a "raid" or a "swing failure," suggesting the move failed to find genuine momentum.
Step 2: The SMT Divergence
The moment a valid SFP is confirmed, the indicator's multiple SMT engines activate.
Each engine begins monitoring the specific SMT timeframe you have configured (e.g., "SMT Timeframe 1," "SMT Timeframe 2," etc.) for a Smart Money Technique (SMT) divergence.
An SMT divergence occurs when two closely correlated assets fail to move in sync. For example, after a raid on a high, Asset A makes a new high, but Asset B fails to do so. This disagreement suggests weakness and a potential reversal.
When the script finds this divergence, it plots the SMT line and triggers an alert.
The Power of Alerts
The true strength of this indicator lies in its alert capabilities. You can create alerts for both unconfirmed and confirmed SMTs.
Enable Alerts LTF Detection: These alerts trigger when an unconfirmed, potential SMT is spotted on the lower "LTF Detection" timeframe. While not yet confirmed, these early alerts can notify you of a potential move before it fully happens, allowing you to be ahead of the curve and find the best possible trade entries.
Enable Alerts Confirmed SMT: These alerts trigger only when a permanent, confirmed SMT line is plotted on your chosen SMT timeframe. These signals are more reliable but occur later than the early detection alerts.
Key Concepts Explained
What is Pivot Strength?
Pivot Strength determines how significant a high or low needs to be to qualify as a valid structural point. A setting of 5-5, for example, means that for a candle's high to be considered a valid pivot high, its high must be higher than the highs of the 5 candles to its left and the 5 candles to its right.
Higher Strength (e.g., 5-5, 8-8): Creates fewer, but more significant, pivots. This is ideal for identifying major structural highs and lows on higher timeframes.
Lower Strength (e.g., 2-2, 3-3): Creates more pivots, making it suitable for identifying the smaller shifts in momentum on lower timeframes.
Raid Expiration & Validity
An SFP signal is not valid forever. The "Raid Expiration" setting determines how many SFP timeframe bars can pass after a raid before that signal is considered "stale" and can no longer be used to validate an SMT. This ensures your SMT divergences are always in response to recent liquidity sweeps.
Why You Must Be on the Right Chart Timeframe to See SMT Lines
Pine Script™ has a fundamental rule: an indicator running on a chart can only "see" the bars of that chart's timeframe or higher.
When the SMT logic is set to the 15-minute timeframe, it calculates its pivots based on 15-minute data. To accurately plot lines connecting these pivots, you must be on a 15-minute chart or lower (e.g., 5-minute, 1-minute).
If you are on a higher timeframe chart, like the 1-hour, the 15-minute bars do not exist on that chart, so the indicator has no bars to draw the lines on.
This is precisely why the alert system is so powerful. You can set your alert to run on the 15-minute timeframe, and TradingView's servers will monitor that timeframe for you, sending a notification regardless of what chart you are currently viewing.

Ayman Entry Signal – Ultimate PRO (Scalping Gold Settings)1. Overview
This indicator is a professional gold scalping tool built for TradingView using Pine Script v6.
It combines multiple price action and technical filters to generate high-probability Buy/Sell signals with built-in trade management features (TP1, TP2, SL, Break Even, Partial Close, Stats tracking).
It is optimized for XAUUSD but can be applied to other assets with proper setting adjustments.
2. Key Features
Multi-Condition Trade Signals – EMA trend, Break of Structure, Order Blocks, FVG, Liquidity Sweeps, Pin Bars, Higher Timeframe confirmation, Trend Cloud, SMA Cross, and ADX.
Full Trade Management – Auto-calculates lot size, SL, TP1, TP2, Break Even, Partial Close.
Dynamic Chart Drawing – Entry lines, SL/TP lines, trade boxes, and real-time PnL.
Statistics Panel – Tracks wins, losses, breakeven trades, and total PnL over selected dates.
Customizable Filters – All filters can be turned ON/OFF to match your strategy.
3. Main Inputs & Settings
Account Settings
Capital ($) – Total trading capital.
Risk Percentage (%) – Risk per trade.
TP to SL Ratio – Risk-to-reward ratio.
Value Per Point ($) – Value per pip/point for lot size calculation.
SL Buffer – Extra points added to SL to avoid stop hunts.
Take Profit Settings
TP1 % of Full Target – Fraction of TP1 compared to TP2.
Move SL to Entry after TP1? – Activates Break Even after TP1.
Break Even Buffer – Extra points when moving SL to BE.
Take Partial Close at TP1 – Option to close half at TP1.
Signal Filters
ATR Period – For SL/TP calculation buffer.
EMA Trend – Uses EMA 9/21 crossover for trend.
Break of Structure (BoS) – Requires structure break confirmation.
Order Block (OB) – Validates trades within OB zones.
Fair Value Gap (FVG) – Confirms trades inside FVGs.
Liquidity Sweep – Checks if liquidity zones are swept.
Pin Bar Confirmation – Uses candlestick patterns for extra confirmation.
Pin Bar Body Ratio – Controls strictness of Pin Bar filter.
Higher Timeframe Filters (HTF)
HTF EMA Confirmation – Confirms lower timeframe trades with higher timeframe trend.
HTF BoS – Confirms with higher timeframe structure break.
HTF Timeframe – Selects higher timeframe.
Advanced Filters
SuperTrend Filter – Confirms trades based on SuperTrend.
ADX Filter – Filters out low volatility periods.
SMA Cross Filter – Uses SMA 8/9 cross as filter.
Trend Cloud Filter – Uses EMA 50/200 as a cloud trend filter.
4. How It Works
Buy Signal Conditions
EMA 9 > EMA 21 (trend bullish)
Optional filters (BoS, OB, FVG, Liquidity Sweep, Pin Bar, HTF confirmations, ADX, SMA Cross, Trend Cloud) must pass if enabled.
When all active filters pass → Buy signal triggers.
Sell Signal Conditions
EMA 9 < EMA 21 (trend bearish)
Same filtering process but for bearish conditions.
When all active filters pass → Sell signal triggers.
5. Trade Execution & Management
When a signal triggers:
Lot size is auto-calculated based on risk % and SL distance.
SL is placed beyond recent swing high/low + ATR buffer.
TP1 and TP2 are calculated from the SL using the reward-to-risk ratio.
Break Even: If enabled, SL moves to entry price after TP1 is hit.
Partial Close: If enabled, half of the position closes at TP1.
Trade Exit: Full exit at TP2, SL hit, or partial close at TP1.
6. Chart Display
Entry Line – Shows entry price.
SL Line – Red dashed line at stop loss level.
TP1 Line – Lime dashed line for TP1.
TP2 Line – Green dashed line for TP2.
PnL Labels – Displays real-time profit/loss in $.
Trade Box – Visual area showing trade range.
Pin Bar Shapes – Optional, marks Pin Bars.
7. Statistics Panel
Stats Header – Shows “Stats”.
Total Trades
Wins
Losses
Breakeven Trades
Total PnL
Can be reset or filtered by date.
8. How to Use
Load the Indicator in TradingView.
Select Gold (XAUUSD) on your preferred scalping timeframe (1m, 5m, 15m).
Adjust settings:
Use default gold scalping settings for quick start.
Enable/disable filters according to your style.
Wait for a Buy/Sell alert.
Confirm visually that all desired conditions align.
Place trade with calculated lot size, SL, and TP levels shown on chart.
Let trade run – the indicator manages Break Even & Partial Close if enabled.
9. Recommended Timeframes
Scalping: 1m, 5m, 15m
Day Trading: 15m, 30m, 1H
Swing: 4H, Daily (adjust settings accordingly)

ZigZag Volume Profile [ChartPrime]⯁ OVERVIEW
ZigZag Volume Profile combines swing structure with volume analytics by plotting a ZigZag of major price swings and overlaying a detailed volume profile around each swing. At the end of each swing, it highlights the Point of Control (POC) — the price level with the highest traded volume — and extends it forward to identify key areas of potential support or resistance.
⯁ KEY FEATURES
ZigZag Swing Detection:
Automatically detects swing highs and lows based on a user-defined length, creating clean visual segments of market structure.
These segments act as boundaries for volume profile calculations.
swingHigh = ta.highest(swingLength)
swingLow = ta.lowest(swingLength)
ZigZag Channel Visualization:
The ZigZag structure is connected with sloped lines, forming a visual “channel” of the price movement.
The ZigZag can optionally, scaled by ATR.
Volume Profile Around Each Swing:
For every completed swing (high to low or low to high), the indicator constructs a full volume profile using user-defined bin counts.
It scans volume across price levels in the swing and plots histogram-style bins using a gradient color to indicate volume magnitude.
Dynamic Bin Width and Slope Adjustment:
Bins are distributed across a vertical ATR-based range, and their width is adjusted based on the percentage of total swing volume.
The volume fill direction is adapted to the swing’s slope for visually aligned plotting.
POC Detection and Extension:
The highest volume bin in each swing is identified as the Point of Control (POC).
This level is plotted with a thicker line and extended horizontally into the future as a key reaction level.
Automatic POC Expiry on Price Interaction:
POC lines are continuously extended unless breached by price.
When price crosses the POC level, the extension is terminated — signaling that the level may have been absorbed.
Clean Volume Bin Visualization:
Bin colors range from green (low volume) to blue (higher volume), with the POC always marked in red by default for easy identification.
Volume percentages are optionally labeled at each bin level.
Flexible Swing Profile Parameters:
Users can control:
Number of volume bins
Bin width
Channel width (ATR factor)
Visibility of the swing channel or POC lines
Efficient Memory Handling:
Old POC lines and volume profiles are automatically removed from memory after a threshold to keep charts clean and performant.
⯁ USAGE
Use ZigZag swings to define market structure visually.
Analyze volume profile around each swing to understand where most trading activity occurred.
Use POC extensions as dynamic support/resistance zones for entries, stops, or take-profits.
Watch for price interaction with extended POC lines — breaks may suggest absorbed liquidity or breakout potential.
Use the ATR-based channel width to adapt profiles based on market volatility.
⯁ CONCLUSION
ZigZag Volume Profile offers a powerful fusion of structure and volume. By plotting detailed volume profiles over each price swing and extending the POC as actionable S/R levels, this tool provides deep insight into market participation zones — giving traders a tactical edge in both ranging and trending environments.

Hilega-Milega by NK Sir (DalRoti)he "Hilega-Milega" indicator is a visual tool to:
Show RSI strength around the 50 level.
Highlight momentum visually with color fills.
Plot fast and slow moving averages of RSI (EMA 3 and WMA 21), giving insight into:
Short-term momentum vs. long-term strength
Potential reversals or trend continuation zones


Supertrend// This Pine Script® code is subject to the terms of the Mozilla Public License 2.0 at mozilla.org
// © KULDEEP157
//@version=6
indicator('Supertrend', overlay = true, format = format.price, precision = 2)
Periods = input(title = 'ATR Period', defval = 12)
src = input(hl2, title = 'Source')
Multiplier = input.float(title = 'ATR Multiplier', step = 0.1, defval = 3.0)
Sensitivity = input.float(title = 'Sensitivity', step = 0.1, defval = 1.0, minval = 0.1)
changeATR = input(title = 'Change ATR Calculation Method?', defval = true)
showsignals = input(title = 'Show Buy/Sell Signals?', defval = true)
highlighting = input(title = 'Highlighter On/Off?', defval = true)
// Function to calculate Supertrend
supertrend(periods, multiplier, sensitivity, source) =>
atr2 = ta.sma(ta.tr, periods)
atr = changeATR ? ta.atr(periods) : atr2
up = source - multiplier * atr * sensitivity
up1 = nz(up , up)
up := close > up1 ? math.max(up, up1) : up
dn = source + multiplier * atr * sensitivity
dn1 = nz(dn , dn)
dn := close < dn1 ? math.min(dn, dn1) : dn
trend = 1
trend := nz(trend , trend)
trend := trend == -1 and close > dn1 ? 1 : trend == 1 and close < up1 ? -1 : trend
// Current timeframe calculation
= supertrend(Periods, Multiplier, Sensitivity, src)
// Define timeframes and initialize trend array
var array timeframes = array.from('1', '3', '5', '15', '30', '60', '240', 'D', 'W')
var array trends = array.new_int(array.size(timeframes))
// Get trend for each timeframe (using individual security calls)
= request.security(syminfo.tickerid, '1', supertrend(Periods, Multiplier, Sensitivity, src))
= request.security(syminfo.tickerid, '3', supertrend(Periods, Multiplier, Sensitivity, src))
= request.security(syminfo.tickerid, '5', supertrend(Periods, Multiplier, Sensitivity, src))
= request.security(syminfo.tickerid, '15', supertrend(Periods, Multiplier, Sensitivity, src))
= request.security(syminfo.tickerid, '30', supertrend(Periods, Multiplier, Sensitivity, src))
= request.security(syminfo.tickerid, '60', supertrend(Periods, Multiplier, Sensitivity, src))
= request.security(syminfo.tickerid, '240', supertrend(Periods, Multiplier, Sensitivity, src))
= request.security(syminfo.tickerid, 'D', supertrend(Periods, Multiplier, Sensitivity, src))
= request.security(syminfo.tickerid, 'W', supertrend(Periods, Multiplier, Sensitivity, src))
// Store trends in array
if barstate.islast
array.set(trends, 0, trend1m)
array.set(trends, 1, trend3m)
array.set(trends, 2, trend5m)
array.set(trends, 3, trend15m)
array.set(trends, 4, trend30m)
array.set(trends, 5, trend1h)
array.set(trends, 6, trend4h)
array.set(trends, 7, trendD)
array.set(trends, 8, trendW)
// Plot signals
buySignal = trend == 1 and trend == -1
plotshape(buySignal and showsignals ? up : na, title = 'Buy', text = 'Buy', location = location.belowbar, style = shape.labelup, size = size.tiny, color = color.new(color.green, 0), textcolor = color.new(color.white, 0))
sellSignal = trend == -1 and trend == 1
plotshape(sellSignal and showsignals ? dn : na, title = 'Sell', text = 'Sell', location = location.abovebar, style = shape.labeldown, size = size.tiny, color = color.new(color.red, 0), textcolor = color.new(color.white, 0))
// Create trend table
var table trendTable = table.new(position.bottom_right, array.size(timeframes) + 1, 2, border_width = 1)
// Fill table headers and data
if barstate.islast
table.cell(trendTable, 0, 0, 'Timeframe', bgcolor = color.gray, text_color = color.white)
table.cell(trendTable, 0, 1, 'Trend', bgcolor = color.gray, text_color = color.white)
for i = 0 to array.size(timeframes) - 1 by 1
timeframeLabel = array.get(timeframes, i)
currentTrend = array.get(trends, i)
// Format timeframe label
displayTimeframe = timeframeLabel == '1' ? '1m' : timeframeLabel == '3' ? '3m' : timeframeLabel == '5' ? '5m' : timeframeLabel == '15' ? '15m' : timeframeLabel == '30' ? '30m' : timeframeLabel == '60' ? '1h' : timeframeLabel == '240' ? '4h' : timeframeLabel == 'D' ? 'Daily' : 'Weekly'
// Set cell values and colors
table.cell(trendTable, i + 1, 0, displayTimeframe)
table.cell(trendTable, i + 1, 1, currentTrend == 1 ? '↑ Bullish' : '↓ Bearish', bgcolor = currentTrend == 1 ? color.new(color.green, 70) : color.new(color.red, 70))
// Highlighting
bgcolor(highlighting ? trend == 1 ? color.new(color.green, 90) : trend == -1 ? color.new(color.red, 90) : na : na)
// Alerts
alertcondition(buySignal, title = 'SuperTrend Buy', message = 'SuperTrend Buy!')
alertcondition(sellSignal, title = 'SuperTrend Sell', message = 'SuperTrend Sell!')
changeCond = trend != trend
alertcondition(changeCond, title = 'SuperTrend Direction Change', message = 'SuperTrend has changed direction!')

MTF Dashboard 9 Timeframes + Signals# MTF Dashboard Pro - Multi-Timeframe Confluence Analysis System
## WHAT THIS SCRIPT DOES
This script creates a comprehensive dashboard that simultaneously analyzes market conditions across 9 different timeframes (1m, 5m, 15m, 30m, 1H, 4H, Daily, Weekly, Monthly) using a proprietary confluence scoring methodology. Unlike simple multi-timeframe displays that show individual indicators separately, this script combines trend analysis, momentum, volatility signals, and volume analysis into unified confluence scores for each timeframe.
## WHY THIS COMBINATION IS ORIGINAL AND USEFUL
**The Problem Solved:** Most traders manually check multiple timeframes and struggle to quickly assess overall market bias when different timeframes show conflicting signals. Existing MTF scripts typically display individual indicators without synthesizing them into actionable intelligence.
**The Solution:** This script implements a mathematical confluence algorithm that:
- Weights each indicator's signal strength (trend direction, RSI momentum, MACD volatility, volume analysis)
- Calculates normalized scores across all active timeframes
- Determines overall market bias with statistical confidence levels
- Provides instant visual feedback through color-coded symbols and star ratings
**Unique Features:**
1. **Confluence Scoring Algorithm**: Mathematically combines multiple indicator signals into a single confidence rating per timeframe
2. **Market Bias Engine**: Automatically calculates overall directional bias with percentage strength across all selected timeframes
3. **Dynamic Display System**: Real-time updates with customizable layouts, color schemes, and selective timeframe activation
4. **Statistical Analysis**: Provides bullish/bearish vote counts and overall confluence percentages
## HOW THE SCRIPT WORKS TECHNICALLY
### Core Calculation Methodology:
**1. Trend Analysis (EMA-based):**
- Fast EMA (default: 9) vs Slow EMA (default: 21) crossover analysis
- Returns values: +1 (bullish), -1 (bearish), 0 (neutral)
**2. Momentum Analysis (RSI-based):**
- RSI levels: >70 (strong bullish +2), >50 (bullish +1), <30 (strong bearish -2), <50 (bearish -1)
- Provides overbought/oversold context for trend confirmation
**3. Volatility Analysis (MACD-based):**
- MACD line vs Signal line positioning
- Histogram strength comparison with previous bar
- Combined score considering both direction and momentum strength
**4. Volume Analysis:**
- Current volume vs 20-period moving average
- Thresholds: >150% MA (strong +2), >100% MA (bullish +1), <50% MA (weak -2)
**5. Confluence Calculation:**
```
Confluence Score = (Trend + RSI + MACD + Volume) / 4.0
```
**6. Market Bias Determination:**
- Counts bullish vs bearish signals across all active timeframes
- Calculates bias strength percentage: |Bullish Count - Bearish Count| / Total Active TFs * 100
- Determines overall market direction: BULLISH, BEARISH, or NEUTRAL
### Multi-Timeframe Implementation:
Uses `request.security()` calls to fetch data from each timeframe, ensuring all calculations are performed on the respective timeframe's data rather than current chart timeframe, providing accurate multi-timeframe analysis.
## HOW TO USE THIS SCRIPT
### Initial Setup:
1. **Timeframe Selection**: Enable/disable specific timeframes in "Timeframe Selection" group based on your trading style
2. **Indicator Configuration**: Adjust EMA periods (Fast: 9, Slow: 21), RSI length (14), and MACD settings (12/26/9) to match your analysis preferences
3. **Display Options**: Choose table position, text size, and color scheme for optimal visibility
### Reading the Dashboard:
**Symbol Interpretation:**
- ⬆⬆ = Strong bullish signal (score ≥ 2)
- ⬆ = Bullish signal (score > 0)
- ➡ = Neutral signal (score = 0)
- ⬇ = Bearish signal (score < 0)
- ⬇⬇ = Strong bearish signal (score ≤ -2)
**Confluence Stars:**
- ★★★★★ = Very high confidence (score > 0.75)
- ★★★★☆ = High confidence (score > 0.5)
- ★★★☆☆ = Medium confidence (score > 0.25)
- ★★☆☆☆ = Low confidence (score > 0)
- ★☆☆☆☆ = Very low confidence (score > -0.25)
**Market Bias Section:**
- Shows overall market direction across all active timeframes
- Strength percentage indicates conviction level
- Overall confluence score represents average agreement across timeframes
### Trading Applications:
**Entry Signals:**
- Look for high confluence (4-5 stars) across multiple timeframes in same direction
- Higher timeframe alignment provides stronger signal validation
- Use confluence percentage >75% for high-probability setups
**Risk Management:**
- Lower timeframe conflicts may indicate choppy conditions
- Neutral bias suggests ranging market - adjust position sizing
- Strong bias with high confluence supports larger position sizes
**Timeframe Harmony:**
- Short-term trades: Focus on 1m-1H alignment
- Swing trades: Emphasize 1H-Daily alignment
- Position trades: Prioritize Daily-Monthly confluence
## SCRIPT SETTINGS EXPLANATION
### Dashboard Settings:
- **Table Position**: Choose optimal location (Top Right recommended for most layouts)
- **Text Size**: Adjust based on screen resolution and preferences
- **Color Scheme**: Professional (default), Classic, Vibrant, or Dark themes
- **Background Color/Transparency**: Customize table appearance
### Timeframe Selection:
All timeframes optional - activate based on trading timeframe preference:
- **Lower Timeframes (1m-30m)**: Scalping and day trading
- **Medium Timeframes (1H-4H)**: Swing trading
- **Higher Timeframes (D-M)**: Position trading and long-term bias
### Indicator Parameters:
- **Fast EMA (Default: 9)**: Shorter period for trend sensitivity
- **Slow EMA (Default: 21)**: Longer period for trend confirmation
- **RSI Length (Default: 14)**: Standard momentum calculation period
- **MACD Settings (12/26/9)**: Standard MACD configuration for volatility analysis
### Alert Configuration:
- **Strong Signals**: Alerts when confluence >75% with clear directional bias
- **High Confluence**: Alerts when multiple timeframes strongly agree
- All alerts use `alert.freq_once_per_bar` to prevent spam
## VISUAL FEATURES
### Chart Elements:
- **Background Coloring**: Subtle background tint reflects overall market bias
- **Signal Labels**: Strong buy/sell labels appear on chart during high-confluence signals
- **Clean Presentation**: Dashboard overlays chart without interfering with price action
### Color Coding:
- **Green/Bullish**: Various green shades for positive signals
- **Red/Bearish**: Various red shades for negative signals
- **Gray/Neutral**: Neutral color for conflicting or weak signals
- **Transparency**: Configurable transparency maintains chart readability
## IMPORTANT USAGE NOTES
**Realistic Expectations:**
- This tool provides analysis framework, not trading signals
- Always combine with proper risk management
- Past performance does not guarantee future results
- Market conditions can change rapidly - use appropriate position sizing
**Best Practices:**
- Verify signals with additional analysis methods
- Consider fundamental factors affecting the instrument
- Use appropriate timeframes for your trading style
- Regular parameter optimization may be beneficial for different market conditions
**Limitations:**
- Effectiveness may vary across different instruments and market conditions
- Confluence scoring is mathematical model - not predictive guarantee
- Requires understanding of underlying indicators for optimal use
This script serves as a comprehensive analysis tool for traders who need quick, organized access to multi-timeframe market information with statistical confidence levels.

Stochastic MACDStochastic MACD Indicator: Quick Guide
This Pine Script indicator, "Stochastic MACD" (SMACD), blends MACD and Stochastic Oscillator principles to help you spot momentum shifts and potential reversals.
What it Shows:
SMACD Line: Tracks momentum.
Signal Line: Averages the SMACD line, creating crossovers.
Histogram: Visualizes momentum strength, changing color with direction.
Overbought/Oversold Levels: (Default 10 and -10) Help identify stretched market conditions. Adjustable in settings.
Visual Signals (Triangles):
Red Down Arrow (Overbought Signal): Appears when both SMACD and Signal lines are above the Overbought level (default 10) AND SMACD crosses the Signal line upwards. This suggests strong overbought conditions and a potential reversal down.
Green Up Arrow (Oversold Signal): Appears when both SMACD and Signal lines are below the Oversold level (default -10) AND SMACD crosses the Signal line upwards. This suggests potential buying opportunities from oversold conditions and a possible reversal up.
How to Use It:
Confirm Trends: Use the histogram and line directions.
Spot Reversals: Look for the red and green triangles for quick alerts.
Combine: Always use with other analysis like price action or support/resistance.
Important: This is an analytical tool, not financial advice. Trading involves risk.

Hann Window FIR Filter Ribbon [BigBeluga]🔵 OVERVIEW
The Hann Window FIR Filter Ribbon is a trend-following visualization tool based on a family of FIR filters using the Hann window function. It plots a smooth and dynamic ribbon formed by six Hann filters of progressively increasing length. Gradient coloring and filled bands reveal trend direction and compression/expansion behavior. When short-term trend shifts occur (via filter crossover), it automatically anchors visual support/resistance zones at the nearest swing highs or lows.
🔵 CONCEPTS
Hann FIR Filter: A finite impulse response filter that uses a Hann (cosine-based) window for weighting past price values, resulting in a non-lag, ultra-smooth output.
hannFilter(length)=>
var float hann = na // Final filter output
float filt = 0
float coef = 0
for i = 1 to length
weight = 1 - math.cos(2 * math.pi * i / (length + 1))
filt += price * weight
coef += weight
hann := coef != 0 ? filt / coef : na
Ribbon Stack: The indicator plots 6 Hann FIR filters with increasing lengths, creating a smooth "ribbon" that adapts to price shifts and visually encodes volatility.
Gradient Coloring: Line colors and fill opacity between layers are dynamically adjusted based on the distance between the filters, showing momentum expansion or contraction.
Dynamic Swing Zones: When the shortest filter crosses its nearest neighbor, a swing high/low is located, and a triangle-style level is anchored and projected to the right.
Self-Extending Levels: These dynamic levels persist and extend until invalidated or replaced by a new opposite trend break.
🔵 FEATURES
Plots 6 Hann FIR filters with increasing lengths (controlled by Ribbon Size input).
Automatically colors each filter and the fill between them with smooth gradient transitions.
Detects trend shifts via filter crossover and anchors visual resistance (red) or support (green) zones.
Support/resistance zones are triangle-style bands built around recent swing highs/lows.
Levels auto-extend right and adapt in real time until invalidated by price action.
Ribbon responds smoothly to price and shows contraction or expansion behavior clearly.
No lag in crossover detection thanks to FIR architecture.
Adjustable sensitivity via Length and Ribbon Size inputs.
🔵 HOW TO USE
Use the ribbon gradient as a visual trend strength and smooth direction cue.
Watch for crossover of shortest filters as early trend change signals.
Monitor support/resistance zones as potential high-probability reaction points.
Combine with other tools like momentum or volume to confirm trend breaks.
Adjust ribbon thickness and length to suit your trading timeframe and volatility preference.
🔵 CONCLUSION
Hann Window FIR Filter Ribbon blends digital signal processing with trading logic to deliver a visually refined, non-lagging trend tool. The adaptive ribbon offers insight into momentum compression and release, while swing-based levels give structure to potential reversals. Ideal for traders who seek smooth trend detection with intelligent, auto-adaptive zone plotting.

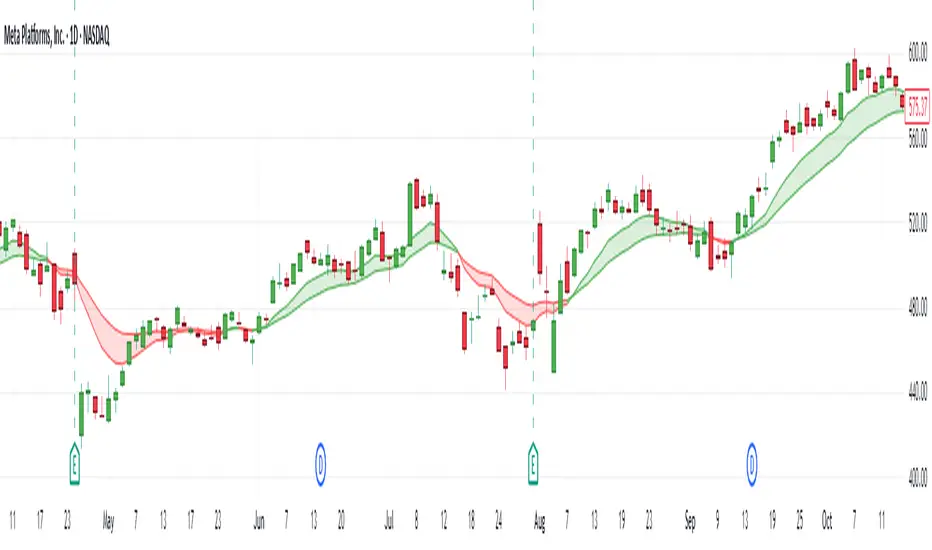
Daily EMA Cloud on Smaller TimeframesSee the daily cloud on any time frame... Colors and Exponential Moving Average (EMA) are adjustable settings.
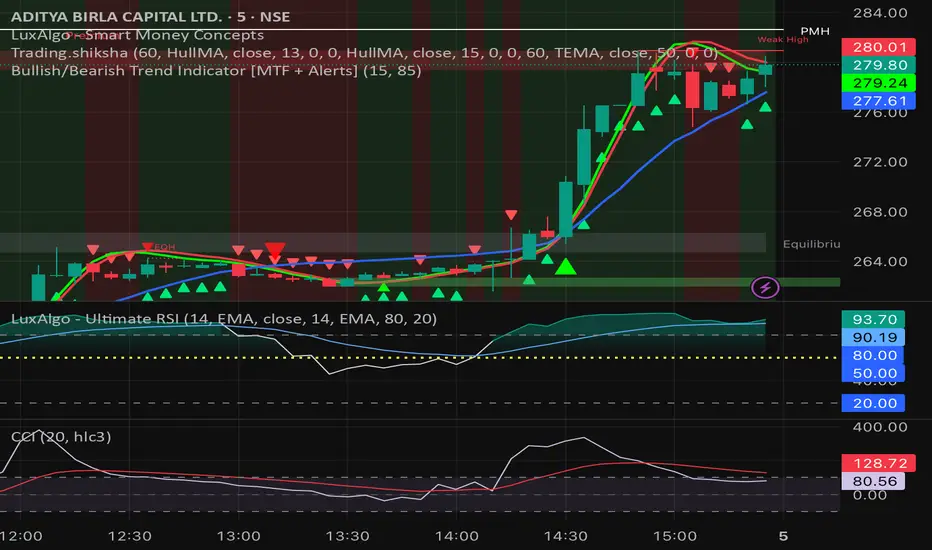
Bullish/Bearish Trend Indicator [MTF + Alerts] by Dow theory Summary of Logic:
✅ Bullish Trend:
Setup Bar: High > Previous High AND Low ≥ Previous Low
Confirmation Bar: High > Highest High of last 3 candles, Low ≥ Setup Bar Low
Trend Continues Until: Latest candle breaks 2nd last candle’s low → then trend becomes Bearish
🔻 Bearish Trend:
Setup Bar: Low < Previous Low AND High ≤ Previous High
Confirmation Bar: Low < Lowest Low of last 3 candles, High ≤ Setup Bar High
Trend Continues Until: Latest candle breaks 2nd last candle’s high → then trend becomes Bullish
BTC CME Futures Gaps (BTCGapHunt_CME)BTC CME Futures Gaps Indicator
Overview
This indicator visualises price gaps between the daily close and open of Bitcoin CME futures (CME:BTC1!). These gaps are often revisited ("filled") by market price action and may serve as technical targets.
Thanks
... to Maven and the Blockchain Masons (x.com/Masons_DAO) to push me on this topic.
What Is a CME Gap?
CME Bitcoin Futures do not trade 24/7. Gaps form when the market reopens at a different price than where it last closed.
Gaps are often used as support/resistance or liquidity targets.
This indicator tracks, visualises, and alerts on these gaps.
Key Features
Automatic gap detection using daily open/close on CME:BTC1!
Dynamic gap size threshold based on ATR (Average True Range)
Highlight unfilled gaps and track partial fills visually
Alerts for gap formation and fill events
Parameter overlay showing real-time settings
Supported and Overrideable Parameters
ATR Length: Defines the lookback period for ATR calculation (default: 14)
Gap Size Multiplier: Multiplies the ATR to set the dynamic gap threshold (default: 1.0)
Proximity Threshold: Price distance from gap edge to consider it filled (default: 100 USD)
Max Gaps Tracked: Maximum number of concurrent gaps shown (default: 50)
Alerts Enabled: Toggle alerts for gap formation and gap fill events
How the Gap Size Is Calculated
Minimum Gap Size = ATR(14) * Gap Size Multiplier
ATR Length and Gap Size Multiplier are configurable.
Gap threshold adjusts dynamically with market volatility.
Visual Guide
Red Box: Fully unfilled gap
Lemon Yellow Box: Partially filled gap
Right Margin Boxes: Snapshot of unfilled gaps for quick access
Top-Right Panel: Current ATR, Gap Size, Thresholds, etc.
Alerts
Gap Formed: A new gap is detected.
Gap Filled: The gap is either partially or fully filled.
Recommended Timeframes
1H, 4H, 1D (best resolution)
Designed for BTC spot/perpetual charts (e.g., BTCUSD, BTCUSDT)
How To Use
Add the script to your BTC chart.
Monitor red/yellow boxes for unfilled gaps.
Check config panel for current threshold and settings.
Enable alerts via TradingView for real-time updates.
Notes
Up to 50 gaps are tracked (adjustable).
Data source: CME futures via request.security.
All visuals and alerts are time-synced with your chart.
Disclaimer
This script is for educational purposes only. Trade at your own risk.

Ichimoku CloudStandard Ichimoku Cloud Implementation
The official Ichimoku Cloud indicator on TradingView applies an offset value of 1 to several lines, which deviates from Hosoda's original Ichimoku theory. This script rectifies that discrepancy, providing a more accurate representation of the Ichimoku Cloud.

Ungli// paste.txt - Remove table and triangles, keep background highlighting, add higher timeframe MACD condition
//@version=5
indicator("Ungli", shorttitle="Ungli", overlay=true)
// Input parameters
rsi_length = input.int(14, title="RSI Length", minval=1)
adx_length = input.int(14, title="ADX Length", minval=1)
rsi_upper = input.int(60, title="RSI Upper Threshold", minval=50, maxval=100)
rsi_lower = input.int(40, title="RSI Lower Threshold", minval=0, maxval=50)
adx_threshold = input.int(60, title="ADX Threshold", minval=1)
bullish_transparency = input.int(60, title="Bullish BG Transparency", minval=0, maxval=95)
bearish_transparency = input.int(60, title="Bearish BG Transparency", minval=0, maxval=95)
show_green = input.bool(true, title="Show Bullish Highlights")
show_red = input.bool(true, title="Show Bearish Highlights")
// MACD parameters
macd_fast = input.int(12, title="MACD Fast Length", minval=1)
macd_slow = input.int(26, title="MACD Slow Length", minval=1)
macd_signal = input.int(9, title="MACD Signal Length", minval=1)
// Higher timeframe MACD condition
check_tide = input.bool(true, title="Check Tide in Direction of Wave", tooltip="Confirms signals with higher timeframe MACD direction")
// Calculate RSI
rsi = ta.rsi(close, rsi_length)
// Calculate ADX
= ta.dmi(adx_length, adx_length)
// Calculate MACD
= ta.macd(close, macd_fast, macd_slow, macd_signal)
// Higher timeframe logic
get_higher_timeframe() =>
current_tf = timeframe.period
if current_tf == "1" or current_tf == "3" or current_tf == "5"
"15"
else if current_tf == "15" or current_tf == "30"
"60"
else if current_tf == "60" or current_tf == "120" or current_tf == "180" or current_tf == "240"
"1D"
else if current_tf == "1D"
"1W"
else if current_tf == "1W"
"1M"
else
"1D" // Default fallback
// Get higher timeframe MACD
higher_tf = get_higher_timeframe()
= request.security(syminfo.tickerid, higher_tf, ta.macd(close, macd_fast, macd_slow, macd_signal))
// Higher timeframe MACD direction
htf_macd_rising = htf_macd_line > htf_macd_line
htf_macd_falling = htf_macd_line < htf_macd_line
// Check conditions
rsi_oversold = rsi < rsi_lower // RSI < 40
rsi_overbought = rsi > rsi_upper // RSI > 60
adx_condition = adx < adx_threshold and adx > adx // ADX ticking up and less than threshold
// MACD filter conditions
macd_uptick = macd_line > macd_line // MACD line rising
macd_downtick = macd_line < macd_line // MACD line falling
// Higher timeframe confirmation (when enabled)
htf_confirms_down = not check_tide or htf_macd_falling
htf_confirms_up = not check_tide or htf_macd_rising
// Combined conditions for signals (now includes higher timeframe MACD filter when enabled)
oversold_signal = rsi_oversold and adx_condition and macd_downtick and htf_confirms_down
overbought_signal = rsi_overbought and adx_condition and macd_uptick and htf_confirms_up
// Dynamic transparency calculation: ADX=10 is 100% color, ADX=threshold is 1% color
get_adx_gradient_transparency(user_transparency) =>
// Clamp ADX between 10 and threshold for gradient calculation
adx_clamped = math.max(10, math.min(adx, adx_threshold))
adx_range = adx_threshold - 10 // e.g., 21 - 10 = 11
adx_position = (adx_clamped - 10) / adx_range // 0 to 1 (0 at ADX=10, 1 at ADX=threshold)
// Base transparency from ADX: 0% at ADX=10, 99% at ADX=threshold
base_transparency = int(adx_position * 99)
// Apply user transparency as overarching control
final_transparency = math.min(95, base_transparency + user_transparency)
final_transparency
// =============================================================================
// MAIN CHART COLUMN HIGHLIGHTING
// =============================================================================
// Highlight background on main price chart with separate ADX gradients for each signal type
bullish_dynamic_transparency = get_adx_gradient_transparency(bullish_transparency)
bearish_dynamic_transparency = get_adx_gradient_transparency(bearish_transparency)
oversold_color = color.new(color.red, bearish_dynamic_transparency)
overbought_color = color.new(color.green, bullish_dynamic_transparency)
// Apply highlights based on user display preferences
show_oversold = oversold_signal and show_red
show_overbought = overbought_signal and show_green
bgcolor(show_oversold ? oversold_color : show_overbought ? overbought_color : na, title="Signal Highlight")
// =============================================================================
// ALERTS
// =============================================================================
alertcondition(show_oversold, title="Oversold Signal", message="RSI + ADX + MACD Oversold Signal!")
alertcondition(show_overbought, title="Overbought Signal", message="RSI + ADX + MACD Overbought Signal!")
alertcondition(show_oversold or show_overbought, title="Any Signal", message="RSI + ADX + MACD Signal Triggered!")

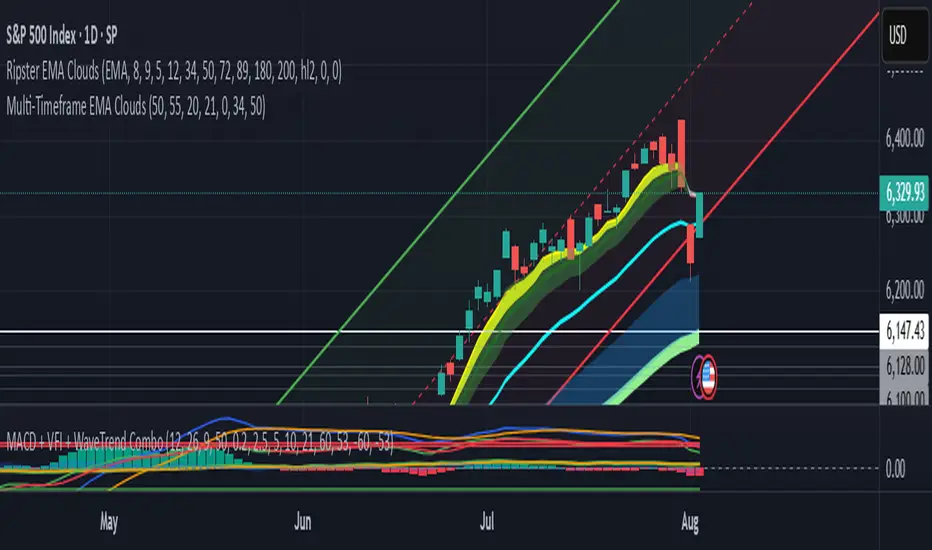
Divergence TridentA Combination of MACD + VFI + WaveTrend
Tradingview hates me and is making me explain this in greater detail so maybe this is enough????