% / ATR Buy, Target, Stop + Overlay & P/L% / ATR Buy, Target, Stop + Overlay & P/L
This tool combines volatility‑based and fixed‑percentage trade planning into a single, on‑chart overlay—with built‑in profit‑and‑loss estimates. Toggle between ATR or percentage modes, plot your Buy, Target and Stop levels, and see the dollar gain or loss for a specified position size—all in one interactive table and chart display.
NOTE: To activate plotted lines, price labels, P/L rows and table values, enter a Buy Price greater than zero.
What It Does
Mode Toggle: Choose between “ATR” (volatility‑based) or “%” (fixed‑percentage) calculations.
Buy Price Input: Manually enter your entry price.
ATR Mode:
Target = Buy + (ATR × Target Multiplier)
Stop = Buy − (ATR × Stop Multiplier)
Percentage Mode:
Target = Buy × (1 + Target % / 100)
Stop = Buy × (1 – Stop % / 100)
P/L Estimates: Specify a dollar amount to “invest” at your Buy price, and the script calculates:
Gain ($): Profit if Target is hit
Loss ($): Cost if Stop is hit
Visual Overlay: Draws horizontal lines for Buy, Target and Stop, with optional price labels on the chart scale.
Interactive Table: Displays Buy, Target, Stop, ATR/timeframe info (in ATR mode), percentages (in % mode), and P/L rows.
Customization Options
Line Settings:
Choose color, style (solid/dashed/dotted), and width for Buy, Target, Stop lines.
Extend lines rightward only or in both directions.
Table Settings:
Position the table (top/bottom × left/right).
Toggle individual rows: Buy Price; Target (multiplier or %); Stop (multiplier or %); Target ATR %; Stop ATR %; ATR Time Frame; ATR Value; Gain ($); Loss ($).
Customize text colors for each row and background transparency.
General Inputs:
ATR length and optional ATR timeframe override (e.g. use daily ATR on an intraday chart).
Target/Stop multipliers or percentages.
Dollar Amount for P/L calculations.
How to Use It for Trading
Plan Your Entry: Enter your intended Buy Price and position size (dollar amount).
Select Mode: Toggle between ATR or % mode depending on whether you prefer volatility‑based or fixed offsets.
Assess R:R and P/L: Instantly see your Target, Stop levels, and potential profit or loss in dollars.
Visual Reference: Lines and price labels update in real time as you tweak inputs—ideal for live trading, backtesting or trade journaling.
Ideal For
Traders who want both volatility‑based and percentage‑based exit options in one tool
Those who need on‑chart P/L estimates based on position size
Swing and intraday traders focused on objective, rule‑based trade management
Anyone who uses ATR for adaptive stops/targets or fixed percentages for simpler exits
Trend Analysis
Market Structure🏗️ Market Structure Indicator for TradingView (Pine Script v6)
Overview:
The Market Structure indicator is a robust tool for identifying swing highs and swing lows across multiple structural levels:
🟤 Short-Term Swings
🟠 Intermediate-Term Swings
🟢 Long-Term Swings
It helps traders visually interpret market structure by detecting confirmed pivot points and promoting them through a hierarchical system. This provides a clear picture of trend direction, breakouts, and reversals.
⚙️ Features and Functionality:
✅ Multi-level Swing Detection:
The indicator promotes confirmed swing points from short-term to intermediate and long-term levels using a structured algorithm.
✅ Full Customization:
Toggle visibility of each swing level independently.
Choose custom colors for short, intermediate, and long-term swings.
✅ Transparent and Commented Logic:
The code contains well-structured functions for identifying and confirming swing highs and lows.
Label arrays are used for precise control over swing detection and display.
✅ Detailed and Open Source Code:
Every function is thoroughly explained with inline comments.
Designed to be easy to understand, modify, and extend — perfect for learning or integrating into more advanced systems.
📜 Open and Documented Source Code
The script is entirely open-source, written in Pine Script v6, and includes full documentation inside the code itself. Key sections include:
🔧 Input settings and visual configuration
🧠 Swing detection and confirmation methods
🔁 Promotion logic between structure levels
📈 Real-time label drawing on each bar
Everything is fully accessible and explained — no obfuscation, no hidden logic.

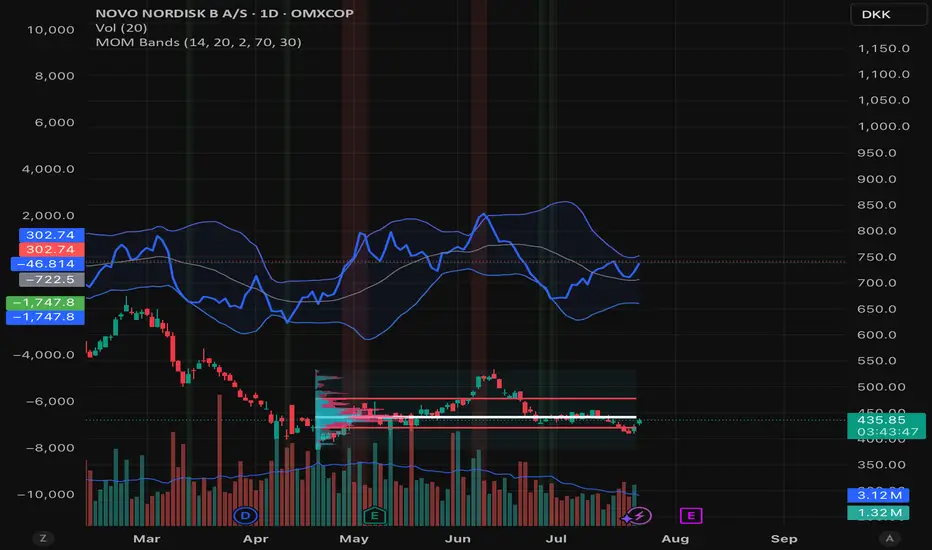
Momentum BandsMomentum Bands indicator-->technical tool that measures the rate of price change and surrounds this momentum with adaptive bands to highlight overbought and oversold zones. Unlike Bollinger Bands, which track price, these bands track momentum itself, offering a unique view of market strength and exhaustion points. At its core, it features a blue momentum line that calculates the rate of change over a set period, an upper red band marking dynamic resistance created by adding standard deviations to the momentum average, a lower green band marking dynamic support by subtracting standard deviations, and a gray middle line representing the average of momentum as a central anchor. When the momentum line touches or moves beyond the upper red band, it often signals that the market may be overbought and a pullback or reversal could follow; traders might lock in profits or watch for short setups. Conversely, when it drops below the lower green band, it can suggest an oversold market primed for a bounce, prompting traders to look for buying opportunities. If momentum remains between the bands, it typically indicates balanced conditions where waiting for stronger signals at the extremes is wise. The indicator can be used in contrarian strategies—buying near the lower band and selling near the upper—or in trend-following setups by waiting for momentum to return toward the centerline before entering trades. For stronger confirmation, traders often combine it with volume spikes, support and resistance analysis, or other trend tools, and it’s useful to check multiple timeframes to spot consistent patterns. Recommended settings vary: short-term traders might use a 7–10 period momentum with 14-period bands; medium-term traders might keep the default 14-period momentum and 20-period bands; while long-term analysis might use 21-period momentum and 50-period bands. Visually, background colors help spot extremes: red for strong overbought, green for strong oversold, and no color for normal markets, alongside reference lines at 70, 30, and 0 to guide traditional overbought, oversold, and neutral zones. Typical bullish signals include momentum rebounding from the lower band, crossing back above the middle after being oversold, or showing divergence where price makes new lows but momentum doesn’t. Bearish signals might appear when momentum hits the upper band and weakens, drops below the middle after being overbought, or price makes new highs while momentum fails to follow. The indicator tends to work best in mean-reverting or sideways markets rather than strong trends, where overbought and oversold conditions tend to repeat.
EMA/MA Unified with Pivot S/RTitle: Moving Average Combined with Pivot Point Support and Resistance Strategy
Description: This indicator combines two powerful trading concepts: 1. Moving Average Crossover; 2. Pivot Point Support and Resistance. It provides traders with a versatile tool.
Features:
Moving Average Crossover: Use moving average groups to identify trend trends. Contains multiple EMAs and one SMA to highlight short-term, medium-term and long-term market trends.
Detection of Golden Cross and Dead Cross: to predict market trends.
Support and Resistance: Dynamically identify key support and resistance levels based on pivot points. Configurable lookback period for left and right pivot points to suit different trading styles and time frames. Fast right pivot point option captures recent market volatility and optimizes support and resistance areas.
Customization:
Traders can adjust the length of the moving average according to their trading strategy. The support and resistance display can be toggled to get a clearer chart as needed.
Trend Analysis:
When EMA240S crosses EMA1440, a weak golden cross (X symbol) is drawn, suggesting that the main trend may turn to a bullish trend; when EMA720 crosses EMA1440, a strong golden cross (upward triangle) is drawn, suggesting that the main trend is likely to turn to a bullish trend.
When EMA240S crosses EMA1440, a weak death cross (X symbol) is drawn, suggesting that the main trend may turn to a bearish trend; when EMA720 crosses EMA1440, a strong death cross (downward triangle) is drawn, suggesting that the main trend is likely to turn to a bearish trend.
Visualization:
Moving averages are displayed in different color to depict the strength and direction of the trend.
Support and resistance levels are drawn in different color, enhancing the visual appeal and readability of key price levels.
This comprehensive indicator is designed for traders who seek to combine the accuracy of support and resistance analysis with the trend-following ability of moving average crossovers, providing a powerful basis for making informed trading decisions.
——————————————————————————————————————————————————————————
标题:
移动平均线结合轴枢点支阻位策略
描述:
该指标融合了两个强大的交易概念:1. 移动平均线交叉;2. 轴枢点支撑压力位。为交易者提供了一个多功能工具。
特点:
移动平均线交叉: 利用均线组识别趋势走势。包含多条EMA和一条SMA,以突出显示短期、中期和长期的市场趋势。
检测金叉和死叉:以预示市场趋势。
支撑位和阻力位: 基于枢轴点动态识别关键支撑位和阻力位。 可配置左右枢轴点的回溯期,以适应不同的交易风格和时间框架。 快速右轴点选项可捕捉近期市场波动并优化支撑位和阻力位区域。
自定义:
交易者可以根据自己的交易策略调整移动平均线的长度。 支撑位和阻力位显示可以切换,以便根据需要获得更清晰的图表。
趋势研判:
当EMA240S上穿EMA1440时,绘制弱金叉(X符号),暗示主趋势可能转为多头趋势;当EMA720上穿EMA1440时,绘制强金叉(向上三角),暗示主趋势大概率转为多头。
当EMA240S下穿EMA1440时,绘制弱死叉(X符号),暗示主趋势可能转为空头趋势;当EMA720下穿EMA1440时,绘制强死叉(向下三角),暗示主趋势大概率转为空头。
可视化:
移动平均线以不同的颜色显示,以描绘趋势的强度和方向。
支撑位和阻力位以不同的颜色绘制,增强了关键价格水平的视觉吸引力和可读性。
这款综合指标专为寻求将支撑位和阻力位分析的精准性与移动平均线交叉的趋势跟踪能力相结合的交易者而设计,为做出明智的交易决策提供了一个强大的判断依据。

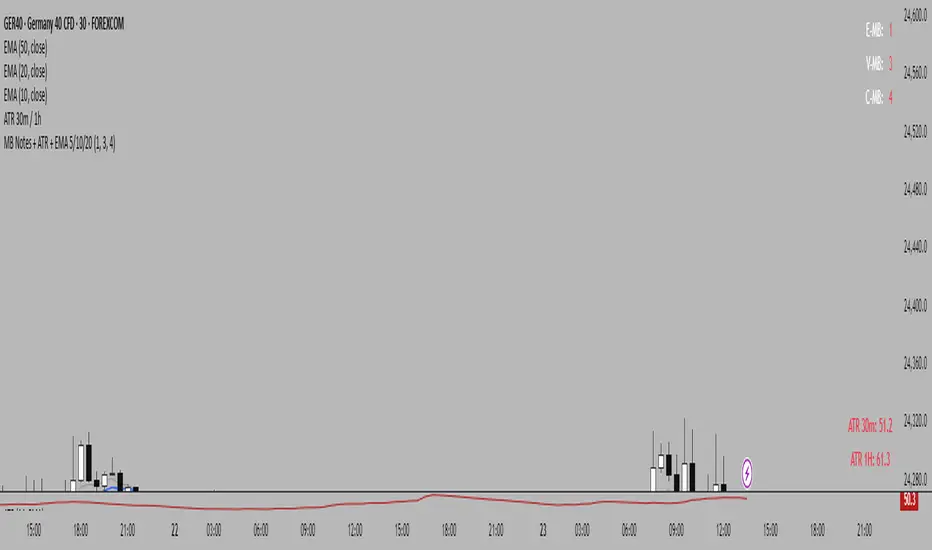
MB Notes + ATR + EMA 5/10/20This custom indicator combines essential trading tools in a single overlay:
✅ MB Notes Panel (Top-Right):
A static display for manual input values labeled E-MB, V-MB, and C-MB. Ideal for tracking personal bias, setups, or trade context directly on the chart. Inputs are fully editable.
✅ ATR Table (Bottom-Right):
Automatically displays 14-period Average True Range on the 30-minute and 1-hour timeframes. Helps assess short-term volatility and manage stop-loss or position sizing more effectively.
✅ EMA Overlay:
Plots Exponential Moving Averages for periods 5, 10, and 20. These dynamic support/resistance levels help traders identify short-term trend direction and momentum shifts.
📌 Designed for intraday and swing traders who want a clean, customizable, and multi-purpose utility indicator.
1H LONG Setup CheckerThis TradingView script identifies high-probability long setups on the 1-hour chart by evaluating five key technical conditions: price above the 200 MA, a higher low structure, RSI above 50 and rising, a bullish MACD crossover, and a breakout above recent resistance. When at least four of these are met, it signals a potential long opportunity with a visual label and background highlight. This tool is useful for traders seeking objective, rule-based entries in trending markets like SOL/USDC and PEPE/USDC.

EMA BUY/SELLEMA
Buy/sell using ema cross over for making trading simple.
you even have the option to change the EMAs when needed

EMA Buy/SellBuy /Sell using EMA Crossover.
this gives early signal foy both buying and selling and one can use this to take the trades

Normalized Price Line with Adjustable Slope‑EMAThis anchored, normalized chart lets you see true percentage moves and swing pivots at a glance—removing guesswork about entry and exit levels. The noise‑filtered, slope‑colored EMAs then highlight only meaningful trend shifts, so you act on real momentum rather than every price twitch.
By anchoring price to a single starting bar, the indicator turns absolute price into a scale‑free “performance” line, where a value of 1.25 means price is up 25% since the anchor, and 0.80 means it’s down 20%. Overlaying that with a midpoint “shelf” line shows key swing levels where price has historically bounced or broken through. When your normalized price crosses above or below this reclaim level, you get an immediate read on whether a swing recovery or breakdown is occurring.
Layered on top are dynamically colored EMAs: a custom “Slope EMA” that changes color based on its recent slope, and classic 83‑ and 200‑period EMAs on the normalized series. The Slope EMA filters out noise by only turning your chosen up, down, or flat colors when its acceleration truly shifts. Meanwhile, crossovers of the faster 83‑EMA over the slower 200‑EMA give you traditional trend‑following confirmation. Together, these elements blend relative performance, structural support, and trend strength into one view—helping you spot higher‑probability entries and stay aligned with market momentum.
Intended for advanced users because user options are nuanced. For example, this indicator plots relative performance rather than raw price, you’ll want to toggle between linear and logarithmic scales (via the “Log” button on the y‑axis) and use the “Anchor” button to lock in your starting reference. That way, every move is shown in the same “language” of percentage moves, ensuring you’re comparing apples to apples across timeframes.

Trent_Finder V3EMA Inputs
It uses 6 EMAs with customizable lengths (defaults: 30, 35, 40, 45, 50, 60).
Trend Conditions
Bullish Trend: All EMAs are strictly ordered from smallest to largest, meaning short-term prices are leading long-term prices upward.
Bearish Trend: All EMAs are ordered from largest to smallest, meaning short-term prices are falling below long-term ones.
Neutral: EMAs are mixed and do not meet the above criteria.
Trend Tracking
The script remembers the current trend and only flips when a full trend reversal condition is confirmed.
Signals
A Buy Signal appears when a bearish or neutral trend changes to bullish.
A Sell Signal appears when a bullish or neutral trend flips to bearish.
Visual Aids
All 6 EMAs are plotted on the chart.
Green Lines = Bullish trend
Red Lines = Bearish trend
Gray Lines = No trend (neutral)
Buy/Sell markers appear at turning points.

Binance Spot vs Perpetual Price index by BIGTAKER📌 Overview
This indicator calculates the premium (%) between Binance Perpetual Futures and Spot prices in real time and visualizes it as a column-style chart.
It automatically detects numeric prefixes in futures symbols—such as `1000PEPE`, `1MFLUX`, etc.—and applies the appropriate scaling factor to ensure accurate 1:1 price comparisons with corresponding spot pairs, without requiring manual configuration.
Rather than simply showing raw price differences, this tool highlights potential imbalances in supply and demand, helping to identify phases of market overheating or panic selling.
🔧 Component Breakdown
1. ✅ Auto Symbol Mapping & Prefix Scaling
Automatically identifies and processes common numeric prefixes (`1000`, `1M`, etc.) used in Binance perpetual futures symbols.
Example:
`1000PEPEUSDT.P` → Spot symbol: `PEPEUSDT`, Scaling factor: `1000`
This ensures precise alignment between futures and spot prices by adjusting the scale appropriately.
2. 📈 Premium Calculation Logic
Formula:
(Scaled Futures Price − Spot Price) / Spot Price × 100
Interpretation:
* Positive (+) → Futures are priced higher than spot: indicates possible long-side euphoria
* Negative (−) → Futures are priced lower than spot: indicates possible panic selling or oversold conditions
* Zero → Equilibrium between futures and spot pricing
3. 🎨 Visualization Style
* Rendered as column plots (bar chart) on each candle
* Color-coded based on premium polarity:
* 🟩 Positive premium: Light green (`#52ff7d`)
* 🟥 Negative premium: Light red (`#f56464`)
* ⬜ Neutral / NA: Gray
* A dashed horizontal line at 0% is included to indicate the neutral zone for quick visual reference
💡 Strategic Use Cases
| Market Behavior | Strategy / Interpretation |
| ----------------------------------------- | ------------------------------------------------------------------------ |
| 📈 Premium surging | Strong futures demand → Overheated longs (short setup) |
| 📉 Premium dropping | Aggressive selling in futures → Oversold signal (long setup) |
| 🔄 Near-zero premium | Balanced market → Wait and observe or reassess |
| 🧩 Combined with funding rate or OI delta | Enables multi-factor confirmation for short-term or mid-term signals |
🧠 Technical Advantages
* Fully automated scaling for prefixes like `1000`, `1M`, etc.
* Built-in error handling for inactive or missing symbols (`ignore_invalid_symbol=true`)
* Broad compatibility with Binance USDT Spot & Perpetual Futures markets
🔍 Target Use Cases & Examples
Compatible symbols:
`1000PEPEUSDT.P`, `DOGEUSDT.P`, `1MFLUXUSDT.P`, `ETHUSDT.P`, and most other Binance USDT-margined perpetual futures
Works seamlessly with:
* Binance Spot Market
* Binance Perpetual Futures Market

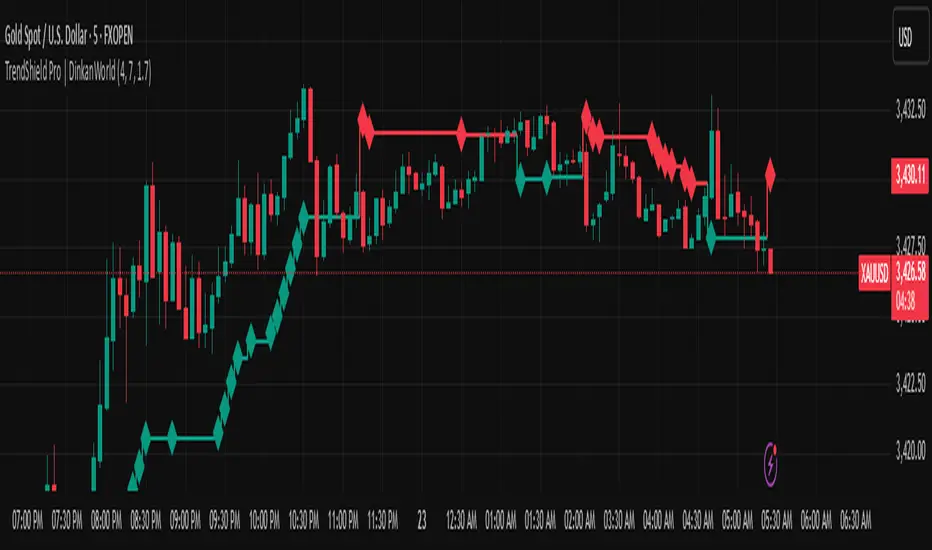
TrendShield Pro | DinkanWorldTrendShield Pro is a powerful price action tool that combines momentum-based trend detection with an ATR-powered trailing stop system. Built using EMA and ATR logic, this indicator helps traders identify real trends, manage dynamic stop-loss levels, and react faster to momentum shifts — all with visual clarity.
🔍 Key Features:
✅ Momentum + Price Action Based Trend Detection
✅ Dynamic ATR Trailing Stop Line
✅ Real-Time Reversal Arrows and Diamond Alerts
✅ Optimized CandleTrack color theme (Green = Demand, Red = Supply)
✅ Fully customizable inputs
🧠 Why Use It?
Capture trends early with momentum-driven logic
Use trailing stops for exit strategy or re-entry zones
Stay on the right side of the market with visual confirmation
⚙️ Inputs:
EMA Period (for directional bias)
ATR Period (for volatility-based trailing stops)
Factor (stop distance control)
⚠️ Disclaimer:
This indicator is for educational and informational purposes only and should not be considered financial advice. Trading involves risk, and past performance does not guarantee future results. Always do your own research and consult with a licensed financial advisor before making any trading decisions. The creator of this script is not responsible for any financial losses incurred through the use of this tool.
CandleTrack Pro | Pure Price Action Trend Detection CandleTrack Pro | Pure Price Action Trend Detection with Smart Candle Coloring
📝 Description:
CandleTrack Pro is a clean, lightweight trend-detection tool that uses only candle structure and ATR-based logic to determine market direction — no indicators, no overlays, just pure price action.
🔍 Features:
✅ Smart Candle-Based Trend Detection
Uses dynamic ATR thresholds to identify trend shifts with precision.
✅ Doji Protection Logic
Automatically filters indecision candles to avoid whipsaws and false signals.
✅ Dynamic Bull/Bear Color Coding
Bullish candles are colored green, bearish candles are colored red — see the trend instantly.
✅ No Noise, No Lag
No moving averages, no smoothing — just real-time decision-making power based on price itself.
📈 Ideal For:
Price action purists
Scalpers and intraday traders
Swing traders looking for clear visual bias
─────────────────────────────────────────────────────────────
Disclaimer:
This indicator is provided for educational and informational purposes only and should not be considered as financial or investment advice. The tool is designed to assist with technical analysis, but it does not guarantee any specific results or outcomes. All trading and investment decisions are made at your own risk. Past performance is not indicative of future results. Always do your own research and consult with a qualified financial advisor before making any trading decisions. The author accepts no liability for any losses or damages resulting from the use of this script. By using this indicator, you acknowledge and accept these terms.
───────────────────────────────────────────────────

Persistent 1H S/R Zones with Labels (No Overlap) + 50 EMAit helps find recant support and resistance zones with swing points

Persistent Daily & 4H S/R Zones with Labels + 50 EMAit helps find swing high and lows support and ressistsance

NY Liquidity Reversal - Debug Mode70 percent 1 rate strategy, no red folder news, trades from only 730 to noon, 20 EMA plus voluntarily breakout, 1 and one entry per direction per session per asset

DAO - Directional ATR OscillatorDAO - Directional ATR Oscillator. it combines trenddirection and strength by simply splitting the Average True Range in both directions over an oscilators zeroline with two MAs to make it easier to spot the overall trenddirection together with momentum and strength but it also works great for spotting divergences and possible trendreversals early. have fun with this everything indicator !

Order-Flow Market StructureOrder-Flow Market Structure by The_Forex_Steward
A precision tool for visualizing internal shifts, swing structure, BOS events, Fibonacci levels, and multi-timeframe alerts.
What It Does
The Order-Flow Market Structure indicator intelligently tracks and visualizes price structure using higher timeframe candles. It automatically detects:
• Internal bullish and bearish structure shifts
• Swing highs and lows (HH, HL, LH, LL)
• Break of Structure (BoS) confirmations
• Fibonacci retracement levels from recent swing moves
• Real-time alerts across LTF, MTF, and HTF modes
It’s a complete tool for traders who follow Smart Money Concepts, ICT, or institutional price action strategies.
How It Works
• You select a Higher Timeframe (HTF) to set the structural context
• Internal shifts are identified using HTF candle closes
• The indicator scans for swing highs/lows after each internal shift
• Breaks of previous swing points confirm BoS and plot horizontal lines
• Zigzag lines visually connect structural points (swings and BoS)
• Fibonacci levels are drawn between the latest swings
• Alerts can be configured for structure shifts, BoS events, and fib level breaks
How to Use It
Set your preferred HTF (e.g., 1H while trading on 5-minute)
Enable Fibonacci levels to visualize retracement zones
Watch for:
• Bullish internal shifts → HL to HH
• Bearish internal shifts → LH to LL
• BOS → Breakout confirmation
Enable alerts to catch structural events in real-time
Adjust the "Safe History Offset" if working with long lookbacks or volatile assets
Who It's For
• Traders using Smart Money, ICT, or market structure-based systems
• Scalpers, day traders, and swing traders
• Anyone needing precise structural insight across multiple timeframes
Features
• BoS detection with custom line styles and width
• HH, HL, LH, LL label plotting
• Optional Fibonacci retracement zones
• Custom alerts for swing shifts and fib level breaks
• LTF, MTF, and HTF alert modes
Stay aligned with structure, trade with precision, and get alerted to key shifts in real time.

RSI, CCI, ADX Panel (Custom TF for Each)RSI, CCI, and ADX Combined – Multi-Timeframe, Fully Customizable Panel Indicator for TradingView
Overview
This Pine Script indicator integrates the Relative Strength Index (RSI), Commodity Channel Index (CCI), and Average Directional Index (ADX) into a single, clean panel for effortless technical analysis. Each indicator operates independently, with customizable length, smoothing, and time frame for maximum flexibility. Traders can now monitor momentum, trend strength, and overbought/oversold conditions across different time frames—all in one place.
Key Features
Independent Controls: Set length, smoothing (ADX), and time frame individually for each indicator via the settings panel.
Multi-Timeframe Support: Each oscillator (RSI, CCI, ADX) can be calculated on its own time frame, enabling nuanced inter-timeframe analysis.
Customizable Visualization: Adjust line color and thickness for each indicator to match your chart style.
Clean, Non-Overlay Display: All three indicators are plotted in a dedicated panel beneath the price chart, reducing clutter.
Reference Levels: Includes standard reference lines for oversold/overbought (RSI, CCI) and trend threshold (ADX) for quick visual cues.
Usage Ideas
Swing Trading: Compare short- and long-term momentum using different time frames for RSI, CCI, and ADX.
Trend Confirmation: Use ADX to filter RSI and CCI signals—only trade overbought/oversold conditions during strong trends.
Divergence Hunting: Spot divergences between time frames for early reversal signals.
Scalping: Set RSI and CCI to lower time frames for entry, while monitoring higher timeframe ADX for trend context.
How to Install
Paste the script into the Pine Editor on TradingView.
Add to chart. Adjust settings as desired.
Save as a template for quick reuse on any chart—all your custom settings will be preserved.
Customization
Edit lengths and time frames in the indicator’s settings dialog.
Toggle reference lines on/off as needed.
Fine-tune line appearance (color, thickness) for clarity.
Note:
This indicator does not provide automated buy/sell signals. It is a customizable analytical tool for manual or semi-automated trading. Use in combination with other technical or fundamental analysis for best results.
Combine Momentum, Trend, and Volatility—Seamlessly and Visually—With One Indicator.

Enhanced Order Block Zones v6I created this indicator to identify orders blocks and label them on timeframes of 15 minutes and lower. This only identifies fairly recent orders blocks based off the performance of the markets. Always remember orders blocks are more accurate at higher timeframes. However, this can be utilized to see more real time orders blocks as they form.

Trend StrengthTrend Strength Dashboard (11-Point System)
Description:
This indicator is a visually enhanced dashboard that evaluates 11 key technical signals to assess bullish momentum for stocks and ETFs. Each condition is displayed in a easy reading table for quick interpretation and visual appeal.
Signals include:
Higher highs and higher lows
Price above EMA21 and SMA200
SMA50 > SMA200
Positive slope on SMA50 and SMA200
RSI trending upward
Ideal for traders who want a clean, at-a-glance summary of market strength without scanning multiple charts or indicators.

Percentage Buy, Target, Stop + OverlayPercentage Buy, Target, Stop + Overlay
This tool helps traders plan entries and exits using fixed percentage offsets instead of volatility. It plots Buy, Target, and Stop levels on the chart based on a user‑defined entry price and simple percentage multipliers—giving a clear, objective framework for risk/reward.
NOTE: To activate the lines and table, enter a Buy Price greater than zero.
What It Does
Buy Price Input: Manually enter your intended entry price (e.g. planned or executed trade).
Percentage‑Based Target and Stop:
Target Price = Buy × (1 + Target % / 100)
Stop Price = Buy × (1 – Stop % / 100)
Visual Overlay: Draws horizontal lines at Buy, Target, and Stop levels on your chart.
Interactive Table: Displays Buy, Target, Stop and their percentages in a customizable on‑chart table.
Customization Options
Line Settings
Choose color, style (solid/dashed/dotted), and width for each line.
Extend lines to the right only or both directions.
Table Settings
Position table (top/bottom × left/right).
Toggle rows for Buy, Target, Stop, and percentage values.
Adjust text colors and background transparency.
How to Use It for Trading
Plan Your Trade: Enter your entry price.
Set Exits: Specify target and stop percentages to instantly see risk/reward zones.
Visual Reference: Lines update in real time as you adjust inputs—ideal for live monitoring or backtesting.
Straightforward Risk Management: Fixed percentages offer a simple alternative when ATR or volatility‑based levels aren’t preferred.
Ideal For
Traders who prefer fixed percentage targets/stops
Quick risk/reward visualization
Beginners seeking a clear, rule‑based exit framework
Any trader wanting an alternative to volatility‑based sizing
