Fibonacci Sequence Moving Average [BackQuant]Fibonacci Sequence Moving Average with Adaptive Oscillator
1. Overview
The Fibonacci Sequence Moving Average indicator is a two‑part trading framework that combines a custom moving average built from the famous Fibonacci number set with a fully featured oscillator, normalisation engine and divergence suite. The moving average half delivers an adaptive trend line that respects natural market rhythms, while the oscillator half translates that trend information into a bounded momentum stream that is easy to read, easy to compare across assets and rich in confluence signals. Everything from weighting logic to colour palettes can be customised, so the tool comfortably fits scalpers zooming into one‑minute candles as well as position traders running multi‑month trend following campaigns.
2. Core Calculation
Fibonacci periods – The default length array is 5, 8, 13, 21, 34. A single multiplier input lets you scale the whole family up or down without breaking the golden‑ratio spacing. For example a multiplier of 3 yields 15, 24, 39, 63, 102.
Component averages – Each period is passed through Simple Moving Average logic to produce five baseline curves (ma1 through ma5).
Weighting methods – You decide how those five values are blended:
• Equal weighting treats every curve the same.
• Linear weighting applies factors 1‑to‑5 so the slowest curve counts five times as much as the fastest.
• Exponential weighting doubles each step for a fast‑reacting yet still smooth line.
• Fibonacci weighting multiplies each curve by its own period value, honouring the spirit of ratio mathematics.
Smoothing engine – The blended average is then smoothed a second time with your choice of SMA, EMA, DEMA, TEMA, RMA, WMA or HMA. A short smoothing length keeps the result lively, while longer lengths create institution‑grade glide paths that act like dynamic support and resistance.
3. Oscillator Construction
Once the smoothed Fib MA is in place, the script generates a raw oscillator value in one of three flavours:
• Distance – Percentage distance between price and the average. Great for mean‑reversion.
• Momentum – Percentage change of the average itself. Ideal for trend acceleration studies.
• Relative – Distance divided by Average True Range for volatility‑aware scaling.
That raw series is pushed through a look‑back normaliser that rescales every reading into a fixed −100 to +100 window. The normalisation window defaults to 100 bars but can be tightened for fast markets or expanded to capture long regimes.
4. Visual Layer
The oscillator line is gradient‑coloured from deep red through sky blue into bright green, so you can spot subtle momentum shifts with peripheral vision alone. There are four horizontal guide lines: Extreme Bear at −50, Bear Threshold at −20, Bull Threshold at +20 and Extreme Bull at +50. Soft fills above and below the thresholds reinforce the zones without cluttering the chart.
The smoothed Fib MA can be plotted directly on price for immediate trend context, and each of the five component averages can be revealed for educational or research purposes. Optional bar‑painting mirrors oscillator polarity, tinting candles green when momentum is bullish and red when momentum is bearish.
5. Divergence Detection
The script automatically looks for four classes of divergences between price pivots and oscillator pivots:
Regular Bullish, signalling a possible bottom when price prints a lower low but the oscillator prints a higher low.
Hidden Bullish, often a trend‑continuation cue when price makes a higher low while the oscillator slips to a lower low.
Regular Bearish, marking potential tops when price carves a higher high yet the oscillator steps down.
Hidden Bearish, hinting at ongoing downside when price posts a lower high while the oscillator pushes to a higher high.
Each event is tagged with an ℝ or ℍ label at the oscillator pivot, colour‑coded for clarity. Look‑back distances for left and right pivots are fully adjustable so you can fine‑tune sensitivity.
6. Alerts
Five ready‑to‑use alert conditions are included:
• Bullish when the oscillator crosses above +20.
• Bearish when it crosses below −20.
• Extreme Bullish when it pops above +50.
• Extreme Bearish when it dives below −50.
• Zero Cross for momentum inflection.
Attach any of these to TradingView notifications and stay updated without staring at charts.
7. Practical Applications
Swing trading trend filter – Plot the smoothed Fib MA on daily candles and only trade in its direction. Enter on oscillator retracements to the 0 line.
Intraday reversal scouting – On short‑term charts let Distance mode highlight overshoots beyond ±40, then fade those moves back to mean.
Volatility breakout timing – Use Relative mode during earnings season or crypto news cycles to spot momentum surges that adjust for changing ATR.
Divergence confirmation – Layer the oscillator beneath price structure to validate double bottoms, double tops and head‑and‑shoulders patterns.
8. Input Summary
• Source, Fibonacci multiplier, weighting method, smoothing length and type
• Oscillator calculation mode and normalisation look‑back
• Divergence look‑back settings and signal length
• Show or hide options for every visual element
• Full colour and line width customisation
9. Best Practices
Avoid using tiny multipliers on illiquid assets where the shortest Fibonacci window may drop under three bars. In strong trends reduce divergence sensitivity or you may see false counter‑trend flags. For portfolio scanning set oscillator to Momentum mode, hide thresholds and colour bars only, which turns the indicator into a heat‑map that quickly highlights leaders and laggards.
10. Final Notes
The Fibonacci Sequence Moving Average indicator seeks to fuse the mathematical elegance of the golden ratio with modern signal‑processing techniques. It is not a standalone trading system, rather a multi‑purpose information layer that shines when combined with market structure, volume analysis and disciplined risk management. Always test parameters on historical data, be mindful of slippage and remember that past performance is never a guarantee of future results. Trade wisely and enjoy the harmony of Fibonacci mathematics in your technical toolkit.
Trend Analysis

FVG 9:31–10:00 AM ETFVG 9:31–10:00 AM ET - Script Description
What This Script Does
This indicator finds **Fair Value Gaps (FVGs)** that form during the first 29 minutes of the U.S. stock market (9:31 AM to 10:00 AM Eastern Time). A Fair Value Gap is a price imbalance where there's a gap between candles that often becomes an important support or resistance level.
Key Features:
- **Time Window**: Only looks for FVGs between 9:31-10:00 AM ET (most important opening period)
- **One Per Day**: Finds only the first FVG that forms in this time window each day
- **Visual Display**: Draws a purple box around the gap with a clear "FVG" label
- **Price Tracking**: Monitors when price comes back to test the gap level
- **Alert System**: Sends notifications when price returns to the FVG zone
How FVGs Are Detected:
- **Bullish FVG**: When there's a gap up (low of middle candle is above high of 3rd candle back)
- **Bearish FVG**: When there's a gap down (high of middle candle is below low of 3rd candle back)
The 9:31-10:00 AM window is chosen because this is when institutions and algorithms create their biggest price moves right after market open, making these gaps very reliable.
Customization Options
User Settings
Extend FVG Box (Bars)
- **What it does**: Makes the purple box longer to the right
- **Default**: 0 (box ends right after the gap forms)
- **Options**: Any number from 0 to 100+
- **When to use**:
- Keep at 0 for clean historical view
- Set to 10-20 to track the gap during the current session
- Set higher for longer reference
Code Settings (Can Be Changed)
Time Window
- **Start**: 9:31 AM Eastern Time
- **End**: 10:00 AM Eastern Time
- **Can modify**: Change the hour/minute numbers in the code
Visual Style
- **Color**: Purple with see-through background
- **Label**: Shows "FVG" text in white
- **Can modify**: Change colors and transparency in the code
How to Use:
Setup
Chart Settings
1. Use 1-minute, 5-minute, or 15-minute charts (works best on these timeframes)
2. Apply to liquid markets like ES, NQ, major stocks, or forex pairs
3. Set the "Extend FVG Box" to your preference (start with 0 or 10)
What You'll See
- A purple box appears when an FVG forms during 9:31-10:00 AM
- Box shows the exact price levels of the gap
- "FVG" label appears on the box
- Only one FVG per day will be marked
Trading Strategies
Basic FVG Trading
1. **Wait for Formation**: Let the purple box appear during 9:31-10:00 AM
2. **Watch Price Movement**: See if price moves away from the gap
3. **Enter on Retest**: When price comes back to the purple box area, consider entering
4. **Trade Direction**:
- Bullish FVG = look for long opportunities when price retests
- Bearish FVG = look for short opportunities when price retests
Entry Methods
- **Bounce Play**: Enter when price touches the FVG box and bounces away
- **Break Play**: Enter if price strongly breaks through the FVG box
- **Rejection Play**: Enter opposite direction if price gets rejected at the FVG
Risk Management
Stop Losses
- Place stops just outside the FVG box (a few ticks beyond the gap)
- If trading a bounce, stop goes on opposite side of the gap
- If trading a break, stop goes back inside the gap
Position Sizing
- Start small until you understand how FVGs work in your market
- Bigger gaps = smaller position size (more risk)
- Smaller gaps = can use larger position size
Profit Targets
- Take profits at obvious levels like round numbers, previous highs/lows
- Consider taking half profits at 1:1 risk/reward ratio
- Let some position run if the move is strong
Best Practices
When It Works Best
- High-volume stocks and futures (ES, NQ work great)
- Normal market days without major news during the 9:31-10:00 window
- When there's clear institutional activity in the opening period
When to Be Careful
- Low-volume stocks or markets
- Major economic news releases during the time window
- Market holidays when volume is low
- Very choppy or sideways days
Alert Usage
- The script will alert you when price comes back to test the FVG
- Don't trade the alert blindly - always check the current market situation
- Use the alert as a heads-up to start watching the setup more closely
Tips for Success
- The earlier the FVG forms in the 9:31-10:00 window, often the more significant it is
- FVGs that form with high volume are usually more reliable
- Always consider the overall market direction - don't fight the main trend
- Practice on paper first to understand how FVGs behave in your chosen market
🔗 Works Best With:
✅ Liquidity Levels — Smart Swing Lows: Spot key structural lows that can fuel stop hunts and reversals.
✅ ICT Turtle Soup — Liquidity Reversal: Add a classic reversal pattern to your toolkit to catch fakeouts cleanly.
✅ ICT SMC Liquidity Grabs and OBs- Liquidity Grabs, Order Block Zones, and Fibonacci OTE Levels, allowing traders to identify institutional entry models with clean, rule-based visual signals.
This script is most valuable for day traders who want to catch institutional moves right after market open, but it can also help swing traders identify important intraday levels.
✅ ICT Macro Zones (Grey Box Version)- It tracks real-time highs and lows for each Silver Bullet session.
✅ Weekly Opening Gap (cryptonnnite)

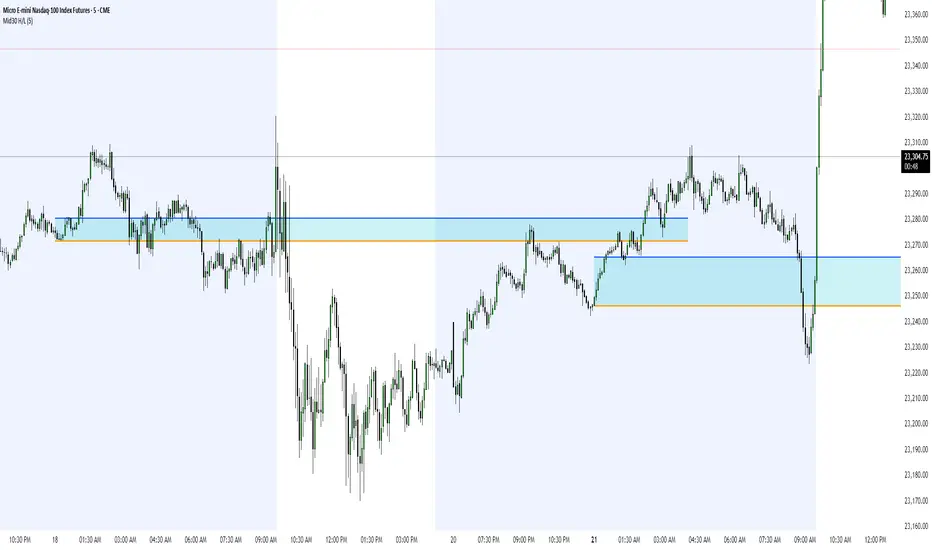
Midnight 30min High/LowMidnight 30min High/Low — Overnight Liquidity Range Tracker
Capture the Overnight Session: A Strategic Level Identification Tool from Professional Trading Methodology
This indicator captures the high and low prices during the critical 30-minute midnight session (12:00-12:30 AM EST) and projects these levels forward as key support and resistance zones. These overnight ranges often contain significant liquidity and serve as crucial reference points for intraday price action, representing areas where institutional activity may have established important levels.
🔍 What This Script Does:
Identifies Critical Overnight Session Levels
- Automatically detects the 12:00-12:30 AM EST session window
- Captures the highest and lowest prices during this 30-minute period
- Projects these levels forward for multiple trading days
Creates Dynamic Support/Resistance Zones
- Extends midnight high/low levels as horizontal lines with customizable projection periods
- Fills the area between high and low to create a visual trading range
- Updates automatically each trading day with new overnight levels
Provides Clear Visual Reference Points
- Optional session start markers (●) highlight when the midnight session begins
- Color-coded lines distinguish between high and low levels
- Transparent fill area creates an easy-to-identify trading zone
Real-Time Level Tracking
- Updates levels in real-time during the active midnight session
- Maintains historical levels for reference and backtesting
- Compatible with data window for precise level values
⚙️ Customization Options:
Extend Days (1-30):** Control how many days forward the levels are projected (default: 5 days)
High Line Color:** Customize the midnight high line color (default: blue)
Low Line Color:** Customize the midnight low line color (default: orange)
Fill Color:** Adjust the transparency and color of the range area (default: light aqua, 80% transparency)
Show Session Markers:** Toggle yellow session start indicators on/off (default: enabled)
💡 How to Use:
Deploy on lower timeframes (1m-15m) for precise level identification and reaction monitoring**
Watch for key price interactions:
- Rejection at midnight high levels (potential resistance)
- Bounce from midnight low levels (potential support)
- Range-bound trading between the high and low levels
Combine with liquidity concepts:
- Monitor for stop hunts above/below these levels
- Look for false breakouts that snap back into the range
- Use as confluence with other ICT concepts like FVGs and Order Blocks
Strategic Applications:
- Range trading between midnight levels
- Breakout confirmation when price closes decisively outside the range
- Support/resistance validation for entry and exit planning
🔗 Combine With These Tools for Complete Market Structure Analysis:
✅ First FVG — Opening Range Fair Value Gap Detector.
✅ ICT Turtle Soup (Liquidity Reversal)— Spot stop hunts and false breakout scenarios.
✅ ICT Macro Zones (Grey Box Version)- It tracks real-time highs and lows for each Silver Bullet session.
✅ ICT SMC Liquidity Grabs and OBs- Liquidity Grabs, Order Block Zones, and Fibonacci OTE Levels, allowing traders to identify institutional entry models with clean, rule-based visual signals.
Together, these tools create a comprehensive Smart Money Concepts (SMC) framework — helping traders identify, anticipate, and capitalize on institutional-level price movements with precision and confidence during critical overnight sessions. Also, dont forget to not over-trade.
Midnight 30min High/LowMidnight 30min High/Low — Overnight Liquidity Range Tracker
Capture the Overnight Session: A Strategic Level Identification Tool from Professional Trading Methodology
This indicator captures the high and low prices during the critical 30-minute midnight session (12:00-12:30 AM EST) and projects these levels forward as key support and resistance zones. These overnight ranges often contain significant liquidity and serve as crucial reference points for intraday price action, representing areas where institutional activity may have established important levels.
🔍 What This Script Does:
Identifies Critical Overnight Session Levels
- Automatically detects the 12:00-12:30 AM EST session window
- Captures the highest and lowest prices during this 30-minute period
- Projects these levels forward for multiple trading days
Creates Dynamic Support/Resistance Zones
- Extends midnight high/low levels as horizontal lines with customizable projection periods
- Fills the area between high and low to create a visual trading range
- Updates automatically each trading day with new overnight levels
Provides Clear Visual Reference Points
- Optional session start markers (●) highlight when the midnight session begins
- Color-coded lines distinguish between high and low levels
- Transparent fill area creates an easy-to-identify trading zone
Real-Time Level Tracking
- Updates levels in real-time during the active midnight session
- Maintains historical levels for reference and backtesting
- Compatible with data window for precise level values
⚙️ Customization Options:
Extend Days (1-30):** Control how many days forward the levels are projected (default: 5 days)
High Line Color:** Customize the midnight high line color (default: blue)
Low Line Color:** Customize the midnight low line color (default: orange)
Fill Color:** Adjust the transparency and color of the range area (default: light aqua, 80% transparency)
Show Session Markers:** Toggle yellow session start indicators on/off (default: enabled)
💡 How to Use:
Deploy on lower timeframes (1m-15m) for precise level identification and reaction monitoring**
Watch for key price interactions:
- Rejection at midnight high levels (potential resistance)
- Bounce from midnight low levels (potential support)
- Range-bound trading between the high and low levels
Combine with liquidity concepts:
- Monitor for stop hunts above/below these levels
- Look for false breakouts that snap back into the range
- Use as confluence with other ICT concepts like FVGs and Order Blocks
Strategic Applications:
- Range trading between midnight levels
- Breakout confirmation when price closes decisively outside the range
- Support/resistance validation for entry and exit planning
🔗 Combine With These Tools for Complete Market Structure Analysis:
✅ First FVG — Opening Range Fair Value Gap Detector.
✅ ICT Turtle Soup (Liquidity Reversal)— Spot stop hunts and false breakout scenarios
✅ ICT Macro Zones (Grey Box Version)- It tracks real-time highs and lows for each Silver Bullet session
✅ ICT SMC Liquidity Grabs and OBs- Liquidity Grabs, Order Block Zones, and Fibonacci OTE Levels, allowing traders to identify institutional entry models with clean, rule-based visual signals.
Together, these tools create a comprehensive Smart Money Concepts (SMC) framework — helping traders identify, anticipate, and capitalize on institutional-level price movements with precision and confidence during critical overnight sessions.

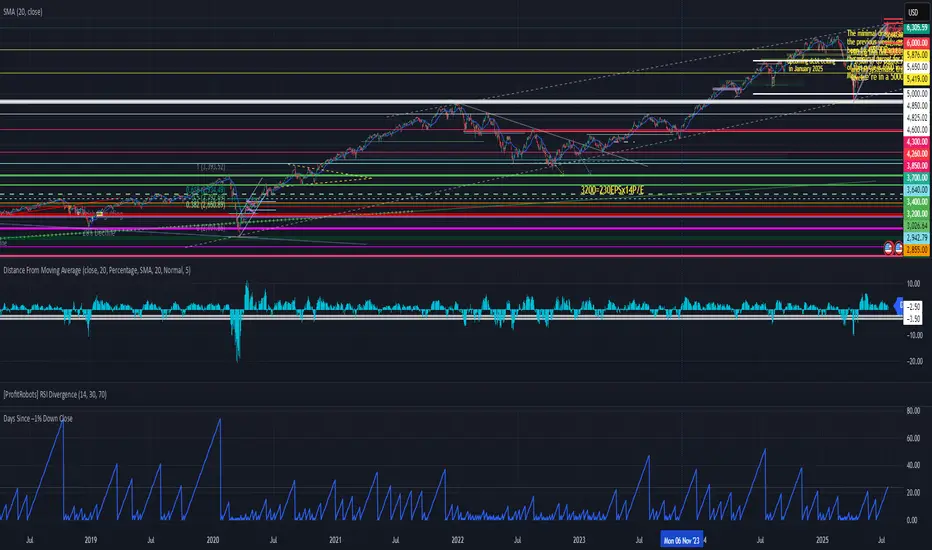
Days Since –1% Down Close“Days since last down 1% close” indicator
This is a useful tool for investors and analysts to gauge market momentum, volatility, and potential risk:
1. Measuring Market Stability and Momentum
2. Identifying Potential Overbought Conditions
3. Volatility Assessment
4. Contextualizing Seasonal or External Factors
5. Risk Management and Timing
Actionable Insight: Combine this with real-time data (e.g., VIX levels or economic releases like tomorrow’s potential market-moving news)
In summary, the "Days since last down 1% close" indicator helps investors monitor market health, spot overextension, and manage risk by providing a historical benchmark for volatility.
Gravity Trend Line with ±10% Bands🌌 Law of Gravity in Stock Trading — by Hu Liyang (胡立阳)—often called the “Godfather of Asian Stock Markets”
✦ Conceptual Origin
The “Law of Gravity” was developed by Mr. Hu Liyang, drawing an analogy between the gravitational pull in physics and the relationship between stock prices and moving averages. It is a medium-term mean reversion theory that helps traders identify rebound opportunities when prices deviate too far from their trend lines.
📈 Indicator Summary: Gravity Trend Line with ±10% Bands
🔧 How It's Calculated:
Gravity Trend Line = Average of SMA(30) and SMA(70)
Represents the fair value zone or center of gravity for price over a medium-term period.
Upper Band = Gravity Line + 10%
Lower Band = Gravity Line - 10%
A shaded zone shows the space between the upper and lower bands — your "gravity channel."
🧭How to Use It for Swing Trading (1H and 4H Charts)
1. Trend Bias Filter
If price is consistently above the Gravity Line, the trend bias is bullish.
If price is below the Gravity Line, the bias is bearish.
Use this to align your trades with the prevailing direction on 4H (macro view) and fine-tune entries on 1H.
2.Trade Entry Zones
Long Setup (buy):
Look for price near or just below the lower band (oversold zone).
Combine with bullish candles or reversal indicators (e.g., MACD bullish crossover, RSI < 30 turning up).
Confirmation: price reclaims the lower band or moves toward gravity line.
Short Setup (sell):
Look for price near or just above the upper band (overbought zone).
Combine with bearish confirmation (e.g., MACD bearish crossover, RSI > 70 turning down).
Confirmation: price starts rejecting from upper band toward gravity line.
3. Take Profit / Exit Zones
Partial TP: At the Gravity Line (mean reversion level).
Final TP: At opposite band (if price has strong momentum).
Alternatively, exit on crossback below gravity line after a long, or above it after a short.
4. Avoiding Traps
Avoid entering trades in the middle of the band (around the Gravity Line) unless there's strong breakout confirmation.
Use 4H for trend context, and 1H for entry precision.
Avoid trading against the broader gravity slope:
If gravity line is clearly sloping up, favor longs.
If sloping down, favor shorts.
📘 Example Strategy Workflow:
Timeframe:
Use 4H for directional bias
Use 1H for entries and exits
Example Long Setup (1H Chart):
Price dips below lower band while 4H trend is up.
Bullish candle forms or RSI/MACD confirms momentum shift.
Entry: price closes back above the lower band.
TP1: near gravity line.
TP2: near upper band.
Or, exit when gain hits +8% to +15%, depending on risk appetite.
📌 Final Notes:
This is a mean-reversion + trend confirmation tool — best used with additional confluence (candlestick patterns, volume, divergence).
It works well in ranging to gently trending markets — not ideal for sharp breakouts unless combined with breakout filters.
This indicator is for educational and reference purposes only.
It is not intended to be a recommendation or signal to buy or sell any security.
Use at your own discretion. Always perform your own due diligence before trading.

LANZ Strategy 6.0 [Backtest]🔷 LANZ Strategy 6.0 — Precision Backtesting Based on 09:00 NY Candle, Dynamic SL/TP, and Lot Size per Trade
LANZ Strategy 6.0 is the simulation version of the original LANZ 6.0 indicator. It executes a single LIMIT BUY order per day based on the 09:00 a.m. New York candle, using dynamic Stop Loss and Take Profit levels derived from the candle range. Position sizing is calculated automatically using capital, risk percentage, and pip value — allowing accurate trade simulation and performance tracking.
📌 This is a strategy script — It simulates real trades using strategy.entry() and strategy.exit() with full money management for risk-based backtesting.
🧠 Core Logic & Trade Conditions
🔹 BUY Signal Trigger:
At 09:00 a.m. NY (New York time), if:
The current candle is bullish (close > open)
→ A BUY order is placed at the candle’s close price (EP)
Only one signal is evaluated per day.
⚙️ Stop Loss / Take Profit Logic
SL can be:
Wick low (0%)
Or dynamically calculated using a % of the full candle range
TP is calculated using the user-defined Risk/Reward ratio (e.g., 1:4)
The TP and SL levels are passed to strategy.exit() for each trade simulation.
💰 Risk Management & Lot Size Calculation
Before placing the trade:
The system calculates pip distance from EP to SL
Computes the lot size based on:
Account capital
Risk % per trade
Pip value (auto or manual)
This ensures every trade uses consistent, scalable risk regardless of instrument.
🕒 Manual Close at 3:00 p.m. NY
If the trade is still open by 15:00 NY time, it will be closed using strategy.close().
The final result is the actual % gain/loss based on how far price moved relative to SL.
📊 Backtest Accuracy
One trade per day
LIMIT order at the candle close
SL and TP pre-defined at execution
No repainting
Session-restricted (only runs on 1H timeframe)
✅ Ideal For:
Traders who want to backtest a clean and simple daily entry system
Strategy developers seeking reproducible, high-conviction trades
Users who prefer non-repainting, session-based simulations
👨💻 Credits:
💡 Developed by: LANZ
🧠 Logic & Money Management Engine: LANZ
📈 Designed for: 1H charts
🧪 Purpose: Accurate simulation of LANZ 6.0's NY Candle Entry system

LANZ Strategy 6.0🔷 LANZ Strategy 6.0 — One-Shot NY Candle Logic with Dynamic SL/TP, Multi-Account Lot Sizing and Visual Confirmation System
LANZ Strategy 6.0 is a high-precision, visually driven indicator that executes a single operation per day based on the 09:00 a.m. New York candle. Built for simplicity and accuracy, it calculates dynamic Stop Loss and Take Profit levels using the candle range, and adapts position sizing per account with pip-accurate risk control. All actions are visualized in real-time for full clarity.
📌 This is an indicator, not a strategy — It does not place trades automatically, but provides exact entry setups, SL/TP levels, risk-based lot size guidance, and optional alerts.
🧠 Core Logic & Features
🚀 Entry Signal (BUY Only)
A BUY setup is triggered only once per day, when:
The current candle is the 09:00–10:00 a.m. NY session candle
The candle is bullish (close > open)
This single candle is used to define the trade levels for the day, and the signal is only evaluated once. If bullish, a visual "BUY" label appears with SL/TP/EP levels calculated from the candle body or full range.
⚙️ Stop Loss and Take Profit
You can configure:
SL as a percentage of the candle’s range (from wick to wick), or use the wick extreme
RR ratio (e.g., 1:4) to dynamically calculate the TP based on SL
Each level is drawn as a line:
EP (Entry Price) at the candle’s close
SL below the low (or % of range)
TP above the entry at the selected RR
💰 Risk-Based Lot Size Calculation per Account
Manage up to 5 independent accounts simultaneously. Each account can have:
Its own capital
Its own risk percentage per trade
Lot size is calculated automatically for each based on:
Defined SL in pips
The pip value (auto-detected for Forex or manually defined for indices/gold)
📋 All lot sizes are displayed in a dedicated info panel, with their corresponding risk-adjusted values per account.
🖼️ Trade Visualization Panel
When a trade is active, a clean table is displayed in the top-right corner showing:
TP / SL / EP levels
Distance in pips for SL and TP
Lot size per account
Line visuals (style, color, thickness) are fully customizable.
🧪 Outcome Tracking (Real-Time Labels)
For each trade:
If SL is hit → a label shows “–1.00%” at the SL level
If TP is hit → a label shows “+X.XX%” at the TP level
If still open at 3:00 p.m. NY, the trade closes manually and the actual result (in %) is calculated and labeled on chart
🔔 Alerts You Can Trust
You'll get an alert when:
A BUY entry is confirmed
SL or TP is hit
Manual close is triggered at 15:00 NY
All alerts include the symbol, price, and result for immediate action or tracking.
🧭 Execution Flow Summary
Every day:
At 09:00 a.m. NY → Evaluate candle
If bullish:
Set EP, SL, TP
Calculate lot sizes
Plot lines + labels
Display dashboard panel
Monitor SL/TP hits
At 15:00 NY → Force close if needed
💡 Ideal For:
Traders who want a clean, single-shot entry system per day
Index or gold traders who operate with strict SL/TP logic
Anyone managing multiple accounts or fixed-capital models
Visual learners and disciplined execution fans
👨💻 Credits:
💡 Developed by: LANZ
🧠 Execution Model & Logic Design: LANZ
📅 Designed for: 1H timeframe, high-conviction NY-based entries
📈 Purpose: Clean decision-making, precision risk control, visual certainty

ADX + Supertrend Persistent Entry Logicbuy condition should match below condition below
ADX DI plus should above of DI minuse
Supertrend should be bullish
ADX should be above 25
Price should not have order block resistance
Exit from buy when supertrend change trend
Sell condition should match below condition below
ADX DI plus should below of DI minuse
Supertrend should be bearish
ADX should be above 25
Price should not have order block support
Exit from Sell when supertrend change trend

OBV Oscillator with Divergence CirclesCredit to original code from the 'PPO Divergence alerts' by Scarf and OBV Oscillator by LazyBear is used as the input.
Replication of Lunndi 'OBV Divergence Alerts (BETA)' script with additional divergence logic implemented.
OBV-based divergence logic adapted from RSI divergence logic added in addition to existing divergence logic.
Modify length and smoothing to suit your trading style. Open source free for use.

CRS by TQCRS by TradeQUO
Comparative Relative Strength Indicator
What it does
Computes the percentage difference in performance between your current chart symbol (e.g. GC1!) and a chosen benchmark (e.g. ES1!, DXY, NQ1!).
Smooths that “CRS” line with a configurable moving average (SMA, EMA, WMA) — default length is 63 bars.
Key Plots
CRS (%) (aqua) — how your symbol has held up relative to the benchmark since the chart loaded.
CRS MA (%) (fuchsia) — smoothed trend of that relative strength.
How to Interpret
Trend-Following
Long when CRS crosses above its MA and is above 0 → your symbol is outperforming.
Short (or reverse) when CRS crosses below its MA and is below 0 → underperformance.
Regime Filter
CRS > 0 → Risk-On environment for your symbol vs. benchmark.
CRS < 0 → Risk-Off relative to the benchmark.
Divergence Signals
Bearish Divergence: Price makes a higher high, but CRS makes a lower high → potential sell-off incoming.
Bullish Divergence: Price makes a lower low, but CRS makes a higher low → look for rebound opportunity.
Pairs Trading
Outperformance: Long your symbol + Short benchmark when CRS > MA.
Underperformance: Short your symbol + Long benchmark when CRS < MA.
Why it matters
Reveals relative market leadership early, not just absolute price moves.
Helps you allocate risk dynamically, spot rotations and catch reversals before they show in price alone.

Fractal Flow BandsFractal Flow Bands
A high-precision trend-following system combining HalfTrend logic with ALMA smoothing — built for clarity, speed, and smart alerts.
🔷 What is Fractal Flow Bands?
Fractal Flow Bands merges the best of both worlds:
HalfTrend for accurate trend detection
ALMA (Arnaud Legoux Moving Average) for smooth, low-lag confirmation
This unique synergy delivers clean, non-repainting Buy/Sell signals, filtering out market noise and keeping your chart crystal clear.
🔍 How It Works
Blue HalfTrend Line + Green ALMA Crossover → BUY
Red HalfTrend Line + Red ALMA Crossover → SELL
You get only ONE alert per trend change, eliminating spammy notifications. Perfect for swing traders, scalpers, and trend followers alike.
⚙️ Core Features
✅ Dual Confirmation Engine
ALMA must confirm HalfTrend — no single-line tricks here.
✅ One Alert per Trend Shift
Clean signals, no noise, no repeats.
✅ Visual Clarity
Color-coded trends. No channels, ribbons, or clutter.
✅ Customizable Settings
Tune HalfTrend amplitude and ALMA smoothness to your strategy.
🎯 Best For
Swing traders wanting confirmation before entries
Scalpers needing fast, accurate signal flow
Anyone who hates messy charts but loves sharp decisions
🛠 Settings Explained
Setting Description
HT Amplitude Controls HalfTrend sensitivity
ALMA Length / Offset / Sigma Adjusts the smoothness of ALMA
Source Choose price source (Close, Open, etc.)
Display Toggles Enable/disable arrows and ribbons
Colors Fully customizable trend color schemes
✅ Built-in Alerts — So you never miss a signal again.
⚡ Lag-free performance — Works on multiple timeframes.
📈 Real strategy-ready code — Not just another repainting overlay.

Strategy Chameleon [theUltimator5]Have you ever looked at an indicator and wondered to yourself "Is this indicator actually profitable?" Well now you can test it out for yourself with the Strategy Chameleon!
Strategy Chameleon is a versatile, signal-agnostic trading strategy designed to adapt to any external indicator or trading system. Like a chameleon changes colors to match its environment, this strategy adapts to match any buy/sell signals you provide, making it the ultimate backtesting and automation tool for traders who want to test multiple strategies without rewriting code.
🎯 Key Features
1) Connects ANY external indicator's buy/sell signals
Works with RSI, MACD, moving averages, custom indicators, or any Pine Script output
Simply connect your indicator's signal output to the strategy inputs
2) Multiple Stop Loss Types:
Percentage-based stops
ATR (Average True Range) dynamic stops
Fixed point stops
3) Advanced Trailing Stop System:
Percentage trailing
ATR-based trailing
Fixed point trailing
4) Flexible Take Profit Options:
Risk:Reward ratio targeting
Percentage-based profits
ATR-based profits
Fixed point profits
5) Trading Direction Control
Long Only - Bull market strategies
Short Only - Bear market strategies
Both - Full market strategies
6) Time-Based Filtering
Optional trading session restrictions
Customize active trading hours
Perfect for day trading strategies
📈 How It Works
Signal Detection: The strategy monitors your connected buy/sell signals
Entry Logic: Executes trades when signals trigger during valid time periods
Risk Management: Automatically applies your chosen stop loss and take profit levels
Trailing System: Dynamically adjusts stops to lock in profits
Performance Tracking: Real-time statistics table showing win rate and performance
⚙️ Setup Instructions
0) Add indicator you want to test, then add the Strategy to your chart
Connect Your Signals:
imgur.com
Go to strategy settings → Signal Sources
1) Set "Buy Signal Source" to your indicator's buy output
2) Set "Sell Signal Source" to your indicator's sell output
3) Choose table position - This simply changes the table location on the screen
4) Set trading direction preference - Buy only? Sell only? Both directions?
imgur.com
5) Set your preferred stop loss type and level
You can set the stop loss to be either percentage based or ATR and fully configurable.
6) Enable trailing stops if desired
imgur.com
7) Configure take profit settings
8) Toggle time filter to only consider specific time windows or trading sessions.
🚀 Use Cases
Test various indicators to determine feasibility and/or profitability.
Compare different signal sources quickly
Validate trading ideas with consistent risk management
Portfolio Management
Apply uniform risk management across different strategies
Standardize stop loss and take profit rules
Monitor performance consistently
Automation Ready
Built-in alert conditions for automated trading
Compatible with trading bots and webhooks
Easy integration with external systems
⚠️ Important Notes
This strategy requires external signals to function
Default settings use 10% of equity per trade
Pyramiding is disabled (one position at a time)
Strategy calculates on bar close, not every tick
🔗 Integration Examples
Works perfectly with:
RSI strategies (connect RSI > 70 for sells, RSI < 30 for buys)
Moving average crossovers
MACD signal line crosses
Bollinger Band strategies
Custom oscillators and indicators
Multi-timeframe strategies
📋 Default Settings
Position Size: 10% of equity
Stop Loss: 2% percentage-based
Trailing Stop: 1.5% percentage-based (enabled)
Take Profit: Disabled (optional)
Trade Direction: Both long and short
Time Filter: Disabled

Weighted Multi-Mode Oscillator [BackQuant]Weighted Multi‑Mode Oscillator
1. What Is It?
The Weighted Multi‑Mode Oscillator (WMMO) is a next‑generation momentum tool that turns a dynamically‑weighted moving average into a 0‑100 bounded oscillator.
It lets you decide how each bar is weighted (by volume, volatility, momentum or a hybrid blend) and how the result is normalised (Percentile, Z‑Score or Min‑Max).
The outcome is a self‑adapting gauge that delivers crystal‑clear overbought / oversold zones, divergence clues and regime shifts on any market or timeframe.
2. How It Works
• Dynamic Weight Engine
▪ Volume – emphasises bars with exceptional participation.
▪ Volatility – inverse ATR weighting filters noisy spikes.
▪ Momentum – amplifies strong directional ROC bursts.
▪ Hybrid – equal‑weight blend of the three dimensions.
• Multi‑Mode Smoothing
Choose from 8 MA types (EMA, DEMA, HMA, LINREG, TEMA, RMA, SMA, WMA) plus a secondary smoothing factor to fine‑tune lag vs. responsiveness.
• Normalization Suite
▪ Percentile – rank vs. recent history (context aware).
▪ Z‑Score – standard deviations from mean (statistical extremes).
▪ Min‑Max – scale between rolling high/low (trend friendly).
3. Reading the Oscillator
Zone Default Level Interpretation
Bull > 80 Acceleration; momentum buyers in control
Neutral 20 – 80 Consolidation / no edge
Bear < 20 Exhaustion; sellers dominate
Gradient line/area automatically shades from bright green (strong bull) to deep red (strong bear).
Optional bar‑painting colours price bars the same way for rapid chart scanning.
4. Typical Use‑Cases
Trend Confirmation – Set Weight = Hybrid, Smoothing = EMA. Enter pullbacks only when WMMO > 50 and rising.
Mean Reversion – Weight = Volatility, reduce upper / lower bands to 70 / 30 and fade extremes.
Volume Pulse – Intraday futures: Weight = Volume to catch participation surges before breakout candles.
Divergence Spotting – Compare price highs/lows to WMMO peaks for early reversal clues.
5. Inputs & Styling
Calculation: Source, MA Length, MA Type, Smoothing
Weighting: Volume period & factor, Volatility length, Momentum period
Normalisation: Method, Look‑back, Upper / Lower thresholds
Display: Gradient fills, Threshold lines, Bar‑colouring toggle, Line width & colours
All thresholds, colours and fills are fully customisable inside the settings panel.
6. Built‑In Alerts
WMMO Long – oscillator crosses up through upper threshold.
WMMO Short – oscillator crosses down through lower threshold.
Attach them once and receive push / e‑mail notifications the moment momentum flips.
7. Best Practices
Percentile mode is self‑adaptive and works well across assets; Z‑Score excels in ranges; Min‑Max shines in persistent trends.
Very short MA lengths (< 10) may produce jitter; compensate with higher “Smoothing” or longer look‑backs.
Pair WMMO with structure‑based tools (S/R, trend lines) for higher‑probability trade confluence.
Disclaimer
This script is provided for educational purposes only. It is not financial advice. Always back‑test thoroughly and manage risk before trading live capital.

Delorean EMAs NSYNC Bye, Bye, Bye# Delorean EMA Trend Alerts - Multi-Timeframe Edition
A Pine Script indicator for TradingView that tracks exponential moving averages (EMAs) across multiple timeframes and generates alerts only when both 1-hour and 4-hour charts agree on the trend direction. As NSYNC says, if the timeframes don't agree, your money will go "Bye, Bye, Bye!"
## Features
- Displays 5 EMAs (5, 13, 50, 200, 800 periods)
- **Multi-Timeframe Analysis**: Checks both 1H and 4H charts simultaneously
- **Trend Agreement Required**: Only signals when BOTH timeframes show the same trend
- Detects bullish trends: 50 EMA > 200 EMA > 800 EMA (on both 1H and 4H)
- Detects bearish trends: 50 EMA < 200 EMA < 800 EMA (on both 1H and 4H)
- **NSYNC Warning**: Orange warning when timeframes disagree
- Visual trend signals with up/down arrows (only when timeframes agree)
- Background coloring: Green (bullish), Red (bearish), Orange (no sync)
- **Status Table**: Shows trend status for each timeframe
- Customizable alert conditions
- Multiple alert types: Bullish, Bearish, NSYNC Warning, Alignment

Real-Time FTFC Dashboard (Styled)Full Time Frame Continuity. Real time change with the data presented. Can be used on all stocks to analyze if the stocks timeframe finished green or red.

Micro Trend Start Signal (Up & Down)Micro Trend Start Signal is a lightweight trend-following indicator , complimenting the binary mac d . Trend trading made simple

Micro Lion Trend Start Signal Micro Trend Start Signal is a lightweight trend-following indicator using EMA crossovers and RSI filters to catch early trend shifts. It shows clear Buy and Sell labels when momentum aligns with direction. Ideal for scalping or intraday trading. Clean, responsive, and designed for fast market entries.

Clarix Trend Filter Purpose
This indicator helps traders quickly identify strong bullish or bearish market conditions by combining a moving average and directional strength.
How It Works
SMMA (200): Smooths price to detect overall trend direction.
ADX (14): Measures trend strength, filtering out weak/noisy moves.
+DI / -DI: Directional movement indicators help confirm the dominant side.
Trend Logic
Bullish Trend: Price is above SMMA, ADX > threshold, and +DI > -DI
Bearish Trend: Price is below SMMA, ADX > threshold, and -DI > +DI
Otherwise, the trend is considered weak or unclear.
Features
Background shading for trend clarity
Optional buy/sell arrows based on trend confirmation
Configurable SMMA length and ADX threshold
Designed for 1-minute timeframes, but can be adjusted
Tips
Best used as a trend filter with your existing entry/exit strategy
Avoid trading signals when ADX is low (flat or ranging conditions)
Works well when combined with volume or momentum indicators

Twin Tower TP Levels – Hopi Method (from Demystifying ICT 2)📐 Twin Tower TP Levels – Hopi Method (from “Demystifying ICT 2”)
Description:
This indicator visualizes the Twin Tower TP Levels, a concept inspired by the work of the anonymous trader "Hopi", presented in the book "Demystifying ICT 2 (2025 Edition)".
It calculates a set of key take-profit levels based on:
A fixed reference price (typically VWAP at 16:00 EST)
The average daily range (ADR)
A symmetrical unit structure (ADR ÷ 100), projecting levels both above and below the fixed price.
The levels are calculated and labeled at ±7, ±13, ±20, ±30, ±37, ±43, and ±50 units from the Fix Price — providing traders with a balanced range of price action targets and reaction zones.
Key features:
Customizable Fix Price and ADR input
Automatically computes and plots 7 target levels above and below
Color-coded labels for easy reference (green for above, red for below)
Designed for precision take-profit targeting, as conceptualized in the “Twin Tower” method.
Disclaimer:
This script is a fan-made implementation for educational purposes and references concepts discussed in the book "Demystifying ICT 2 (2025 Edition)", attributed to the pseudonymous trader "Hopi".
All rights to the original intellectual property remain with the author.

Multi Pivot Point & Central Pivot Range - Nadeem Al-QahwiThis indicator combines four advanced trading modules into one flexible and easy-to-use script:
Traditional Pivot Points:
Calculates classic support and resistance levels (PP, R1–R5, S1–S5) based on previous session data. Ideal for identifying key turning points and mapping out the daily, weekly, or monthly structure.
Camarilla Levels:
Provides six upper and lower pivot levels (H1–H6, L1–L6) derived from volatility and closing price formulas. Especially effective for intraday reversal, mean reversion, and finding overbought/oversold extremes.
Central Pivot Range (CPR):
Plots the median, top, and bottom of the value area each session. CPR width instantly highlights whether the market is likely to trend (narrow CPR) or remain range-bound (wide CPR).
Developing CPR projects the evolving range for the current period—essential for real-time analysis and pre-market planning.
Dynamic Zone Levels (DZL):
Automatically detects and highlights clusters of pivots to reveal high-probability support/resistance zones, filtering out market “noise.”
DZL alerts notify you whenever price breaks or retests these key areas, making it easier to spot momentum trades and avoid false signals.
Key Features:
Multi-timeframe flexibility: Use with daily, weekly, monthly, yearly, or custom timeframes—even rare ones like biyearly and decennial.
Modular design: Activate or hide any system (Traditional, Camarilla, CPR, DZL) as you need.
Bilingual interface: Every setting and label is shown in both English and Arabic.
Full customization: Control visibility, color, style, and placement for every level and label.
Historical depth: Plot up to 5,000 pivot/zones back for deep analysis and backtesting.
Smart alerts: Get instant notifications on true S/R breakouts or retests (from DZL).
How to Use:
Trend Trading:
Watch for a very narrow CPR to identify potential trending days—trade in the breakout direction above/below the CPR.
Range Trading:
When CPR is wide, expect sideways movement. Fade reversals at R1/S1 or within the CPR boundaries.
Breakouts:
Use DZL alerts to capture momentum as price breaks or retests dynamic support/resistance zones.
Multi-Timeframe Confluence:
Combine CPR and pivot levels from multiple timeframes for higher-probability entries and exits.
All calculations and logic are fully open.
