Hassi XAUUSD STRATEGY BOTGold (XAUUSD) 15m trend+momentum based signals with EMA(9/21/200), RSI, custom ADX, ATR-based SL/TP & alerts
Works on XAUUSD 15m.
Entry: EMA9/21 cross + price relative to EMA200 + RSI filter + custom ADX trend strength.
Risk: default SL=1.5×ATR, TP=2×ATR (editable).
Notes: No financial advice. Backtest before live use. Avoid high-impact news whipsaws.
Trend Analysis

Filtro Antirumore Ottimizzato by G.I.N.e TradingNoise Filter – Adaptive Version for Bund & DAX by G.I.N.e Trading
The Noise Filter is a market condition tool designed to help traders avoid false signals by identifying sideways or low-quality trading phases. This version has been specifically optimized to work effectively with both Bund and DAX price action behaviors.
⚙️ How It Works
The indicator analyzes four key components to determine if the market is in a "noise zone" (sideways, low volatility, or weak trend):
Bollinger Band Width – Detects price compression.
ADX – Measures the strength of the trend.
ATR – Captures recent volatility.
HMA Slope – Evaluates directional movement (trend or no trend).
A noise zone is triggered if at least two out of three core conditions are met:
Narrow Bollinger Bands
ADX below threshold
ATR below threshold
And it is confirmed only if there is no clear directional slope in price.
A strong directional slope overrides the noise signal, allowing valid trends with low volatility (common in instruments like the Bund).
🎯 Visual Output
Gray column → Noise zone: avoid signals in this phase (low quality environment).
Yellow column → Operational zone: conditions are more favorable for trend-following systems.
🛠️ Fully Customizable
You can adjust:
Bollinger Band period & width threshold
ADX length & threshold
ATR period & threshold
HMA slope sensitivity
💡 Best For
Filtering false signals in automated or manual trading strategies
Enhancing trend-following accuracy
Adapting behavior to both high-volatility instruments (DAX) and low-volatility instruments (Bund)

Filtro Universale Antirumore by G.I.N.e TradingNoise Filter Indicator by G.I.N.e Trading
The Noise Filter Indicator is designed to detect market conditions where price action is likely to generate false signals due to low volatility or lack of trend. These are typically sideways or congested phases that trend-following systems should avoid.
⚙️ How it works:
The indicator analyzes the current market structure using three components:
Bollinger Band Width
Measures price compression.
Narrow bands indicate a potential sideways phase.
Average Directional Index (ADX)
Measures the strength of the trend.
Low ADX values suggest absence of directional momentum.
Average True Range (ATR)
Measures recent price volatility.
When ATR is below its moving average, the market is likely ranging or losing energy.
A noise zone is identified when at least 2 out of 3 conditions are true:
Low volatility (Bollinger Band Width)
Weak trend (ADX < threshold)
ATR below reference value
🎯 Visual Output:
🟨 Yellow bar: Trend conditions favorable — signals are more reliable.
⬜️ Gray bar: Noise zone — high risk of false signals, avoid trading.

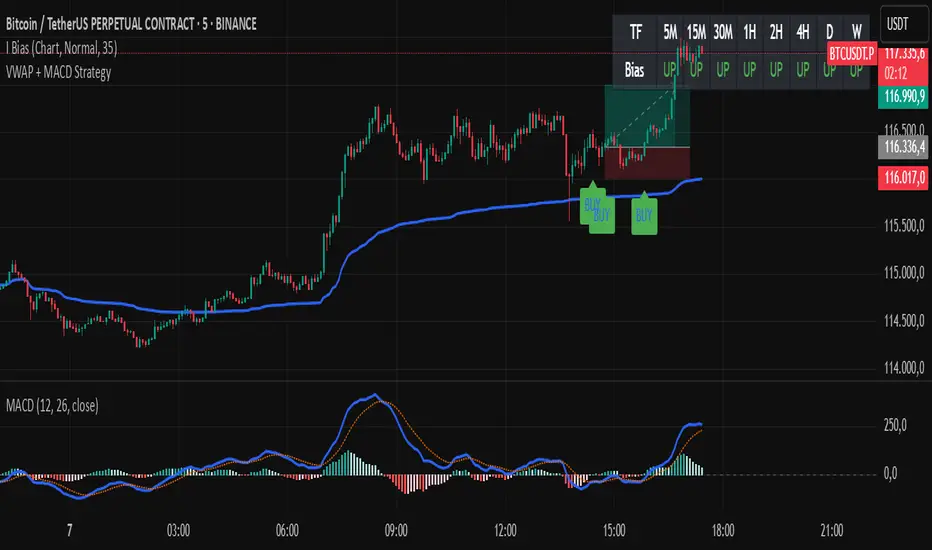
VWAP + MACD Estrategia MilloVWAP + MACD Strategy
This indicator combines the VWAP (Volume Weighted Average Price) with MACD (Moving Average Convergence Divergence) to create buy and sell signals. It helps traders identify potential market entry and exit points based on price action and momentum.
Conditions for Buy:
The price must be above the VWAP.
The MACD line crosses above the signal line (bullish crossover).
The MACD line is below the zero line.
Conditions for Sell:
The price must be below the VWAP.
The MACD line crosses below the signal line (bearish crossover).
The MACD line is above the zero line.
Features:
The VWAP line is plotted to represent the average price, weighted by volume, over a specified period.
Buy signals appear when all conditions are met for an upward price movement.
Sell signals appear when all conditions are met for a downward price movement.
MACD and Signal Line: The MACD helps to confirm momentum, while the signal line indicates possible trend reversals.
Customizable: You can modify the VWAP and MACD parameters to suit different trading strategies.
This strategy is designed for intraday traders and scalpers, aiming to catch quick movements while being aware of market momentum.
Feel free to share this description along with the code! Let me know if you need any adjustments or further explanations.
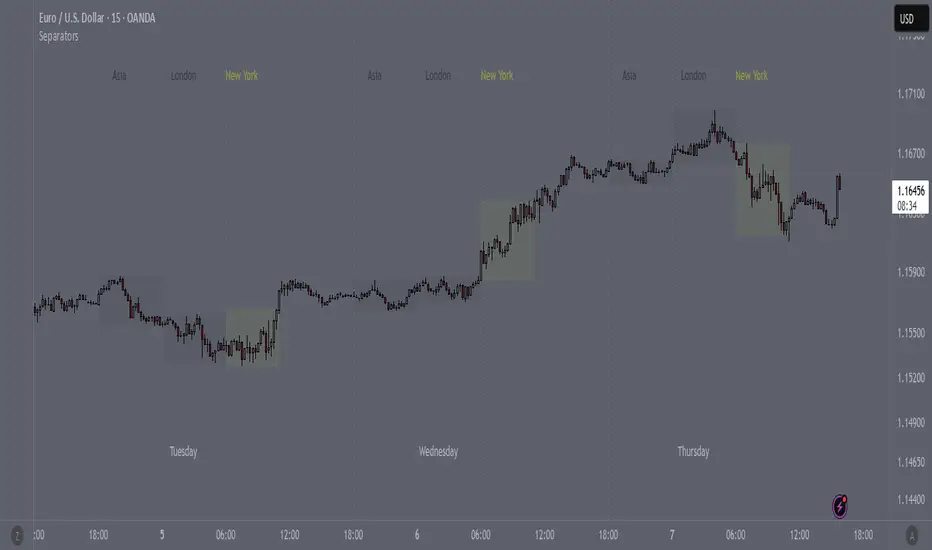
SeparatorsSession - H1 and below Time Frame
Day - H4 and below Time Frame
Month - D Time Frame
Quarter - W Time Frame
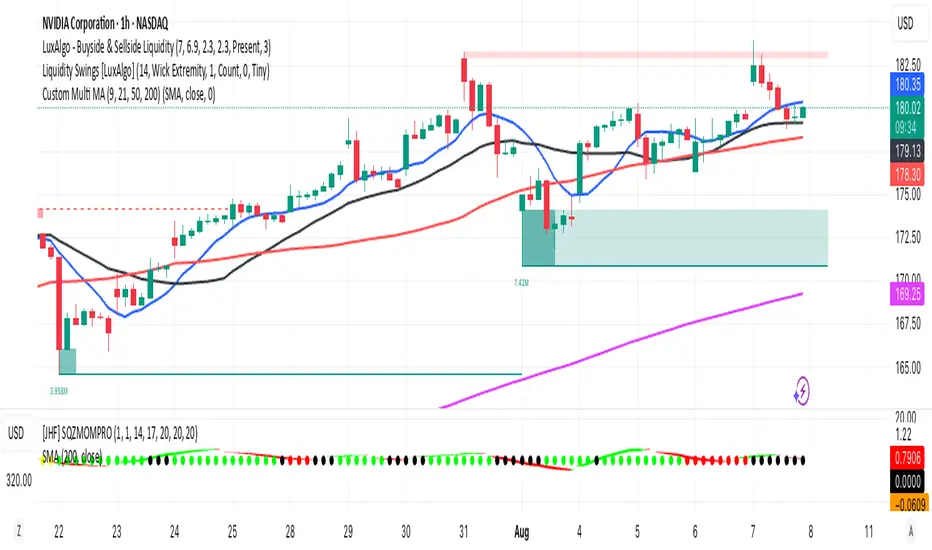
Multi MA (9, 21, 50, 200)This indicator plots four commonly used moving averages — 9, 21, 50, and 200 — with customizable smoothing methods and color-coded lines optimized for visibility on any chart background.
Dynamic 5DMA/EMA with Color for Multiple Products🔹 Dynamic 5DMA/EMA with Slope-Based Coloring (All Timeframes)
This indicator plots a dynamic 5-period moving average that adapts intelligently to your chart's timeframe and product type — giving you a clean, slope-sensitive visual edge across intraday, daily, and weekly views.
✅ Key Features:
📈 Dynamic MA Length Scaling:
On intraday timeframes, the MA adjusts for your selected market session (RTH, ETH, VIX, or Futures), calculating a true 5-day average based on actual session length — not just a flat bar count.
🔄 Automatic Timeframe Detection:
Daily Chart: Uses standard 5DMA or 5EMA.
Weekly Chart: Applies a true 5-week MA.
Intraday Charts: Converts 5 days into bar-length equivalent dynamically.
🎨 Color-Coded Slope Logic:
Green = Rising MA (bullish slope)
Red = Falling MA (bearish slope)
Neutral slope = previous color held for visual continuity
No more guessing — direction is instantly clear.
⚠️ Built-In Slope Flip Alerts:
Set alerts when the slope of the MA turns up or down. Ideal for timing pullback entries or exits across any product.
⚙️ Session Settings for Proper Scaling:
Choose your product's market structure to ensure accurate 5-day conversion on intraday charts:
Stocks - RTH: 390 mins/day
Stocks - ETH: 780 mins/day
VIX: 855 mins/day
Futures: 1440 mins/day
This ensures the MA reflects 5 full trading days, regardless of session irregularities or bar interval.
📌 Why Use This Indicator?
Most MAs misrepresent trend direction on intraday charts because they assume static daily bar counts. This tool corrects that, then adds slope-based coloring to give you a fast, visual read on short-term momentum. Whether you’re swing trading SPY, scalping VIX, or position trading futures, this indicator keeps your view aligned with how institutions see moving averages across timeframes.
🔧 Best For:
VIX & volatility traders
Short-term SPY/SPX traders
Swing traders who value clean setups
Anyone wanting a true 5-day trend anchor on any chart
Parabolic SAR with Early Buy & MA-Based Exit Strategy📝 Strategy Description (Max SEO Impact)
This advanced Parabolic SAR-based trading strategy is designed to capture early trend reversals and exit intelligently using a dynamic moving average filter. It enters long trades when a PSAR reversal occurs, and exits only when the PSAR moves above price and the price falls below the 11-period SMA, helping avoid premature exits during volatile swings.
📌 Features:
• Custom Parabolic SAR calculation for refined trend tracking
• Background highlights during buy zones (SAR below price)
• Exit signals only when trend weakens (PSAR above + price under SMA)
• Red flag plotted on chart at exit bars for clear visual identification
• Works on all timeframes and instruments
Ideal for swing traders, trend followers, and strategy testers looking for smart PSAR-based entries with smoother exits.

Year Dividers with LabelsDraws year start markers due visually show start of a year. Useful when looking at year seasonality and related factors

Antirumore by G.I.N.e TradingCode Functions
Checks 5 conditions:
1. ADX > threshold
2. RSI outside the 45–55 neutral zone
3. Wide price range
4. Candle with a strong body
5. Consistent volume
Displays a colored bar in a lower panel:
🟩 Green = possible long entry

ZenAlgo - ADXThis open-source indicator builds upon the official Average Directional Index (ADX) implementation by TradingView. It preserves the core logic of the original ADX while introducing additional visualization features, configurability, and analytical overlays to assist with directional strength analysis.
Core Calculation
The script computes the ADX, +DI, and -DI based on smoothed directional movement and true range over a user-defined length. The smoothing is performed using Wilder’s method, as in the original implementation.
True Range is calculated from the current high, low, and previous close.
Directional Movement components (+DM, -DM) are derived by comparing the change in highs and lows between consecutive bars.
These values are then smoothed, and the +DI and -DI are expressed as percentages of the smoothed True Range.
The difference between +DI and -DI is normalized to derive DX, which is further smoothed to yield the ADX value.
The indicator includes a selectable signal line (SMA or EMA) applied to the ADX for crossover-based visualization.
Visualization Enhancements
Several plots and conditions have been added to improve interpretability:
Color-coded histograms and lines visualize DI relative to a configurable threshold (default: 25). Colors follow the ZenAlgo color scheme.
Dynamic opacity and gradient coloring are used for both ADX and DI components, allowing users to distinguish weak/moderate/strong directional trends visually.
Mirrored ADX is internally calculated for certain overlays but not directly plotted.
The script also provides small circles and diamonds to highlight:
Crossovers between ADX and its signal line.
DI crossing above or below the 25 threshold.
Rising ADX confirmed by rising DI values, with point size reflecting ADX strength.
Divergence Detection
The indicator includes optional detection of fractal-based divergences on the DI curve:
Regular and hidden bullish and bearish divergences are identified based on relative fractal highs/lows in both price and DI.
Detected divergences are optionally labeled with 'R' (Regular) or 'H' (Hidden), and color-coded accordingly.
Fractal points are defined using 5-bar patterns to ensure consistency and reduce false positives.
ADX/DI Table
When enabled, a floating table displays live values and summaries:
ADX value , trend direction (rising/falling), and qualitative strength.
DI composite , trend direction, and relative strength.
Contextual power dynamics , describing whether bulls or bears are gaining or losing strength.
The background colors of the table reflect current trend strength and direction.
Interpretation Guidelines
ADX indicates the strength of a trend, regardless of its direction. Values below 20 are often considered weak, while those above 40 suggest strong trending conditions.
+DI and -DI represent bullish and bearish directional movements, respectively. Crossovers between them are used to infer trend direction.
When ADX is rising and either +DI or -DI is dominant and increasing, the trend is likely strengthening.
Divergences between DI and price may suggest potential reversals but should be interpreted cautiously and not in isolation.
The threshold line (default 25) provides a basic filter for ignoring low-strength conditions. This can be adjusted depending on the market or timeframe.
Added Value over Existing Indicators
Fully color-graded ADX and DI display for better visual clarity.
Optional signal MA over ADX with crossover markers.
Rich contextual labeling for both divergence and threshold events.
Power dynamics commentary and live table help users contextualize current momentum.
Customizable options for smoothing type, divergence display, table position, and visual offsets.
These additions aim to improve situational awareness without altering the fundamental meaning of ADX/DI values.
Limitations and Disclaimers
As with any ADX-based tool, this indicator does not indicate market direction alone —it measures strength, not trend bias.
Divergence detection relies on fractal patterns and may lag or produce false positives in sideways markets.
Signal MA crossovers and DI threshold breaks are not entry signals , but contextual markers that may assist with timing or filtering other systems.
The table text and labels are for visual assistance and do not replace proper technical analysis or market context.

Hurst Exponent Adaptive Filter (HEAF) [PhenLabs]📊 PhenLabs - Hurst Exponent Adaptive Filter (HEAF)
Version: PineScript™ v6
📌 Description
The Hurst Exponent Adaptive Filter (HEAF) is an advanced Pine Script indicator designed to dynamically adjust moving average calculations based on real time market regimes detected through the Hurst Exponent. The intention behind the creation of this indicator was not a buy/sell indicator but rather a tool to help sharpen traders ability to distinguish regimes in the market mathematically rather than guessing. By analyzing price persistence, it identifies whether the market is trending, mean-reverting, or exhibiting random walk behavior, automatically adapting the MA length to provide more responsive alerts in volatile conditions and smoother outputs in stable ones. This helps traders avoid false signals in choppy markets and capitalize on strong trends, making it ideal for adaptive trading strategies across various timeframes and assets.
Unlike traditional moving averages, HEAF incorporates fractal dimension analysis via the Hurst Exponent to create a self-tuning filter that evolves with market conditions. Traders benefit from visual cues like color coded regimes, adaptive bands for volatility channels, and an information panel that suggests appropriate strategies, enhancing decision making without constant manual adjustments by the user.
🚀 Points of Innovation
Dynamic MA length adjustment using Hurst Exponent for regime-aware filtering, reducing lag in trends and noise in ranges.
Integrated market regime classification (trending, mean-reverting, random) with visual and alert-based notifications.
Customizable color themes and adaptive bands that incorporate ATR for volatility-adjusted channels.
Built-in information panel providing real-time strategy recommendations based on detected regimes.
Power sensitivity parameter to fine-tune adaptation aggressiveness, allowing personalization for different trading styles.
Support for multiple MA types (EMA, SMA, WMA) within an adaptive framework.
🔧 Core Components
Hurst Exponent Calculation: Computes the fractal dimension of price series over a user-defined lookback to detect market persistence or anti-persistence.
Adaptive Length Mechanism: Maps Hurst values to MA lengths between minimum and maximum bounds, using a power function for sensitivity control.
Moving Average Engine: Applies the chosen MA type (EMA, SMA, or WMA) to the adaptive length for the core filter line.
Adaptive Bands: Creates upper and lower channels using ATR multiplied by a band factor, scaled to the current adaptive length.
Regime Detection: Classifies market state with thresholds (e.g., >0.55 for trending) and triggers alerts on regime changes.
Visualization System: Includes gradient fills, regime-colored MA lines, and an info panel for at-a-glance insights.
🔥 Key Features
Regime-Adaptive Filtering: Automatically shortens MA in mean-reverting markets for quick responses and lengthens it in trends for smoother signals, helping traders stay aligned with market dynamics.
Custom Alerts: Notifies on regime shifts and band breakouts, enabling timely strategy adjustments like switching to trend-following in bullish regimes.
Visual Enhancements: Color-coded MA lines, gradient band fills, and an optional info panel that displays market state and trading tips, improving chart readability.
Flexible Settings: Adjustable lookback, min/max lengths, sensitivity power, MA type, and themes to suit various assets and timeframes.
Band Breakout Signals: Highlights potential overbought/oversold conditions via ATR-based channels, useful for entry/exit timing.
🎨 Visualization
Main Adaptive MA Line: Plotted with regime-based colors (e.g., green for trending) to visually indicate market state and filter position relative to price.
Adaptive Bands: Upper and lower lines with gradient fills between them, showing volatility channels that widen in random regimes and tighten in trends.
Price vs. MA Fills: Color-coded areas between price and MA (e.g., bullish green above MA in trending modes) for quick trend strength assessment.
Information Panel: Top-right table displaying current regime (e.g., "Trending Market") and strategy suggestions like "Follow trends" or "Trade ranges."
📖 Usage Guidelines
Core Settings
Hurst Lookback Period
Default: 100
Range: 20-500
Description: Sets the period for Hurst Exponent calculation; longer values provide more stable regime detection but may lag, while shorter ones are more responsive to recent changes.
Minimum MA Length
Default: 10
Range: 5-50
Description: Defines the shortest possible adaptive MA length, ideal for fast responses in mean-reverting conditions.
Maximum MA Length
Default: 200
Range: 50-500
Description: Sets the longest adaptive MA length for smoothing in strong trends; adjust based on asset volatility.
Sensitivity Power
Default: 2.0
Range: 1.0-5.0
Description: Controls how aggressively the length adapts to Hurst changes; higher values make it more sensitive to regime shifts.
MA Type
Default: EMA
Options: EMA, SMA, WMA
Description: Chooses the moving average calculation method; EMA is more responsive, while SMA/WMA offer different weighting.
🖼️ Visual Settings
Show Adaptive Bands
Default: True
Description: Toggles visibility of upper/lower bands for volatility channels.
Band Multiplier
Default: 1.5
Range: 0.5-3.0
Description: Scales band width using ATR; higher values create wider channels for conservative signals.
Show Information Panel
Default: True
Description: Displays regime info and strategy tips in a top-right panel.
MA Line Width
Default: 2
Range: 1-5
Description: Adjusts thickness of the main MA line for better visibility.
Color Theme
Default: Blue
Options: Blue, Classic, Dark Purple, Vibrant
Description: Selects color scheme for MA, bands, and fills to match user preferences.
🚨 Alert Settings
Enable Alerts
Default: True
Description: Activates notifications for regime changes and band breakouts.
✅ Best Use Cases
Trend-Following Strategies: In detected trending regimes, use the adaptive MA as a trailing stop or entry filter for momentum trades.
Range Trading: During mean-reverting periods, monitor band breakouts for buying dips or selling rallies within channels.
Risk Management in Random Markets: Reduce exposure when random walk is detected, using tight stops suggested in the info panel.
Multi-Timeframe Analysis: Apply on higher timeframes for regime confirmation, then drill down to lower ones for entries.
Volatility-Based Entries: Use upper/lower band crossovers as signals in adaptive channels for overbought/oversold trades.
⚠️ Limitations
Lagging in Transitions: Regime detection may delay during rapid market shifts, requiring confirmation from other tools.
Not a Standalone System: Best used in conjunction with other indicators; random regimes can lead to whipsaws if traded aggressively.
Parameter Sensitivity: Optimal settings vary by asset and timeframe, necessitating backtesting.
💡 What Makes This Unique
Hurst-Driven Adaptation: Unlike static MAs, it uses fractal analysis to self-tune, providing regime-specific filtering that's rare in standard indicators.
Integrated Strategy Guidance: The info panel offers actionable tips tied to regimes, bridging analysis and execution.
Multi-Regime Visualization: Combines adaptive bands, colored fills, and alerts in one tool for comprehensive market state awareness.
🔬 How It Works
Hurst Exponent Computation:
Calculates log returns over the lookback period to derive the rescaled range (R/S) ratio.
Normalizes to a 0-1 value, where >0.55 indicates trending, <0.45 mean-reverting, and in-between random.
Length Adaptation:
Maps normalized Hurst to an MA length via a power function, clamping between min and max.
Applies the selected MA type to close prices using this dynamic length.
Visualization and Signals:
Plots the MA with regime colors, adds ATR-based bands, and fills areas for trend strength.
Triggers alerts on regime changes or band crosses, with the info panel suggesting strategies like momentum riding in trends.
💡 Note:
For optimal results, backtest settings on your preferred assets and combine with volume or momentum indicators. Remember, no indicator guarantees profits—use with proper risk management. Access premium features and support at PhenLabs.

Ayman Entry Signal – Ultimate PRO (Scalping Gold Settings)1. Overview
This indicator is a professional gold scalping tool built for TradingView using Pine Script v6.
It combines multiple price action and technical filters to generate high-probability Buy/Sell signals with built-in trade management features (TP1, TP2, SL, Break Even, Partial Close, Stats tracking).
It is optimized for XAUUSD but can be applied to other assets with proper setting adjustments.
2. Key Features
Multi-Condition Trade Signals – EMA trend, Break of Structure, Order Blocks, FVG, Liquidity Sweeps, Pin Bars, Higher Timeframe confirmation, Trend Cloud, SMA Cross, and ADX.
Full Trade Management – Auto-calculates lot size, SL, TP1, TP2, Break Even, Partial Close.
Dynamic Chart Drawing – Entry lines, SL/TP lines, trade boxes, and real-time PnL.
Statistics Panel – Tracks wins, losses, breakeven trades, and total PnL over selected dates.
Customizable Filters – All filters can be turned ON/OFF to match your strategy.
3. Main Inputs & Settings
Account Settings
Capital ($) – Total trading capital.
Risk Percentage (%) – Risk per trade.
TP to SL Ratio – Risk-to-reward ratio.
Value Per Point ($) – Value per pip/point for lot size calculation.
SL Buffer – Extra points added to SL to avoid stop hunts.
Take Profit Settings
TP1 % of Full Target – Fraction of TP1 compared to TP2.
Move SL to Entry after TP1? – Activates Break Even after TP1.
Break Even Buffer – Extra points when moving SL to BE.
Take Partial Close at TP1 – Option to close half at TP1.
Signal Filters
ATR Period – For SL/TP calculation buffer.
EMA Trend – Uses EMA 9/21 crossover for trend.
Break of Structure (BoS) – Requires structure break confirmation.
Order Block (OB) – Validates trades within OB zones.
Fair Value Gap (FVG) – Confirms trades inside FVGs.
Liquidity Sweep – Checks if liquidity zones are swept.
Pin Bar Confirmation – Uses candlestick patterns for extra confirmation.
Pin Bar Body Ratio – Controls strictness of Pin Bar filter.
Higher Timeframe Filters (HTF)
HTF EMA Confirmation – Confirms lower timeframe trades with higher timeframe trend.
HTF BoS – Confirms with higher timeframe structure break.
HTF Timeframe – Selects higher timeframe.
Advanced Filters
SuperTrend Filter – Confirms trades based on SuperTrend.
ADX Filter – Filters out low volatility periods.
SMA Cross Filter – Uses SMA 8/9 cross as filter.
Trend Cloud Filter – Uses EMA 50/200 as a cloud trend filter.
4. How It Works
Buy Signal Conditions
EMA 9 > EMA 21 (trend bullish)
Optional filters (BoS, OB, FVG, Liquidity Sweep, Pin Bar, HTF confirmations, ADX, SMA Cross, Trend Cloud) must pass if enabled.
When all active filters pass → Buy signal triggers.
Sell Signal Conditions
EMA 9 < EMA 21 (trend bearish)
Same filtering process but for bearish conditions.
When all active filters pass → Sell signal triggers.
5. Trade Execution & Management
When a signal triggers:
Lot size is auto-calculated based on risk % and SL distance.
SL is placed beyond recent swing high/low + ATR buffer.
TP1 and TP2 are calculated from the SL using the reward-to-risk ratio.
Break Even: If enabled, SL moves to entry price after TP1 is hit.
Partial Close: If enabled, half of the position closes at TP1.
Trade Exit: Full exit at TP2, SL hit, or partial close at TP1.
6. Chart Display
Entry Line – Shows entry price.
SL Line – Red dashed line at stop loss level.
TP1 Line – Lime dashed line for TP1.
TP2 Line – Green dashed line for TP2.
PnL Labels – Displays real-time profit/loss in $.
Trade Box – Visual area showing trade range.
Pin Bar Shapes – Optional, marks Pin Bars.
7. Statistics Panel
Stats Header – Shows “Stats”.
Total Trades
Wins
Losses
Breakeven Trades
Total PnL
Can be reset or filtered by date.
8. How to Use
Load the Indicator in TradingView.
Select Gold (XAUUSD) on your preferred scalping timeframe (1m, 5m, 15m).
Adjust settings:
Use default gold scalping settings for quick start.
Enable/disable filters according to your style.
Wait for a Buy/Sell alert.
Confirm visually that all desired conditions align.
Place trade with calculated lot size, SL, and TP levels shown on chart.
Let trade run – the indicator manages Break Even & Partial Close if enabled.
9. Recommended Timeframes
Scalping: 1m, 5m, 15m
Day Trading: 15m, 30m, 1H
Swing: 4H, Daily (adjust settings accordingly)

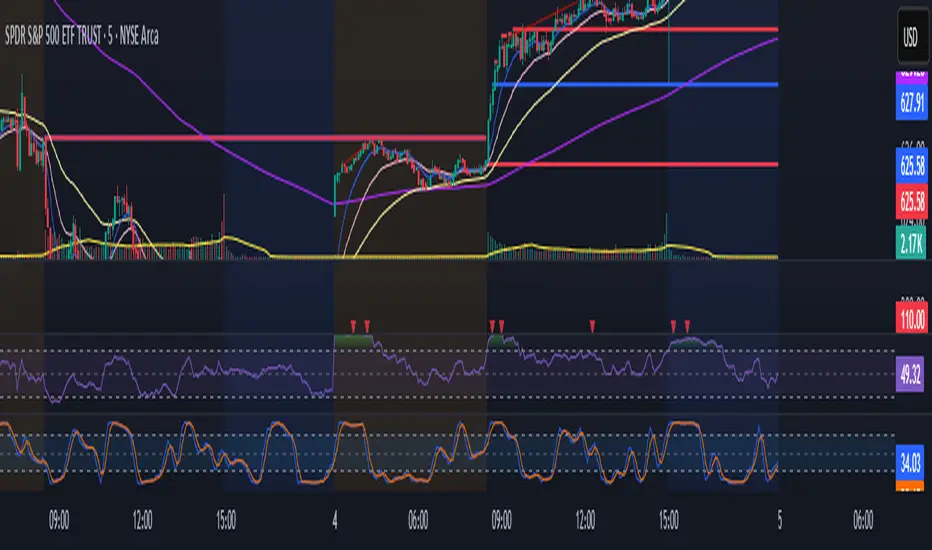
Hilega-Milega by NK Sir (DalRoti)he "Hilega-Milega" indicator is a visual tool to:
Show RSI strength around the 50 level.
Highlight momentum visually with color fills.
Plot fast and slow moving averages of RSI (EMA 3 and WMA 21), giving insight into:
Short-term momentum vs. long-term strength
Potential reversals or trend continuation zones

Dark Pool Block Trades - Institutional Volume📊 Dark Pool Block Trades - Institutional Volume
Visualize where institutional money positions before major price moves occur. This indicator reveals hidden dark pool block trades that often precede significant price movements - because when smart money deploys millions and billions in strategic accumulation or distribution, retail traders need to see where it's happening.
🎯 WHY DARK POOL DATA MATTERS:
Institutions don't move large capital randomly. Dark pool block trades represent strategic positioning by sophisticated money managers with superior research and conviction. These trades create hidden support/resistance levels that often predict future price action.
The key principle: Follow institutional flow, don't fight it. When institutions get involved, they create high-probability trading opportunities.
💰 HOW INSTITUTIONS INFLUENCE PRICE:
- Large block trades establish hidden accumulation/distribution zones
- Smart money builds positions BEFORE retail awareness increases
- Institutional activity creates "footprints" at key technical levels
- These trades often signal conviction plays ahead of major moves
- Institutions typically add to winning positions throughout trends
🔍 WHAT THIS INDICATOR SHOWS:
- Visual overlay of dark pool block trades directly on price charts
- Track institutional positioning across major stocks and ETFs
- Identify accumulation/distribution zones before they become obvious to retail
- Spot high-conviction institutional trades in real-time visualization
- Customizable block trade size filters and timeframe selection
- Historical institutional activity up to 5 years or custom ranges
💡 THE TRADING ADVANTAGE:
Instead of guessing price direction, see where institutions are already positioning. When large block trades appear in dark pools, you're witnessing strategic institutional commitment that frequently leads to significant price movements.
⚡ HOW IT WORKS:
This Pine Script displays institutional dark pool transactions as visual markers on your charts. The script comes with sample data for immediate use. For expanded ticker coverage and real-time updates, external data services are available.
🎯 IDEAL FOR:
- Swing traders following institutional footprints
- Traders seeking setups backed by smart money conviction
- Position traders looking for accumulation zones
- Anyone wanting to align with institutional flow rather than fight it
🔄 SAMPLE DATA INCLUDED:
Pre-loaded with institutional activity data across popular tickers, updated daily to demonstrate how dark pool activity correlates with future price movements.
The script initially covers these tickers going back 6 months showing the top 10 trades by volume over 400,000 shares: AAPL, AMD, AMZN, ARKK, ARKW, BAC, BITO, COIN, COST, DIA, ETHA, GLD, GOOGL, HD, HYG, IBB, IWM, JNJ, JPM, LQD, MA, META, MSFT, NVDA, PG, QQQ, RIOT, SLV, SMCI, SMH, SOXX, SPY, TLT, TSLA, UNH, USO, V, VEA, VNQ, VOO, VTI, VWO, WMT, XLE, XLF, XLK, XLU, XLV, XLY

Profitable Pullback Strategy Mark804📝 Strategy Description: Pullback Trading Strategy v2.0 by Mark804
Overview
This strategy is a refined, trend-following pullback system designed to identify high-probability entry points within an established trend. Based on **EMA stacking**, it captures short-term retracements (pullbacks) in the direction of the larger trend. It has been fully updated to **Pine Script v5** with dynamic inputs, clear visualization, backtesting functionality, and risk management via stop loss and take profit.
---
🔧 How It Works
1. **Trend Detection**
The strategy first identifies a trend using a combination of four EMAs:
* **Fast EMA**
* **Signal EMA**
* **Medium EMA**
* **Slow EMA** (optional filter)
A valid trend is defined by **EMA stacking**:
* **Uptrend**: Fast > Signal > Medium (> Slow, if enabled)
* **Downtrend**: Fast < Signal < Medium (< Slow, if enabled)
This ensures the strategy trades **only in the direction of the dominant trend**, avoiding countertrend setups.
---
2. **Pullback Entry Conditions**
The strategy looks for pullbacks (retracements) within the confirmed trend:
*Buy Setup (Long Pullback)**:
* In an uptrend
* Price **closes below** the Signal EMA on the previous bar
* Then **closes back above** the Signal EMA on the current bar
* **Sell Setup (Short Pullback)**:
* In a downtrend
* Price **closes above** the Signal EMA on the previous bar
* Then **closes back below** the Signal EMA on the current bar
These conditions aim to enter on price dips or rallies that offer better entries while staying aligned with trend momentum.
---
3. **Entry & Exit Logic**
When a pullback signal is detected:
* A **market order** is placed in the trend direction
* A **take profit** and **stop loss** is applied immediately based on percentage inputs
Example:
* Take Profit: 2% above entry (for long)
* Stop Loss: 1% below entry (for long)
This creates a favorable **risk-to-reward ratio** and clear exit strategy.
---
4. **Customizable Inputs**
All key parameters can be tuned via the script’s settings panel:
* `maSrc`: Source for EMAs (default: `close`)
* `fastLen`, `signalLen`, `mediumLen`, `slLen`: EMA lengths
* `slEnabled`: Toggle to include the slow EMA as a trend filter
* `takeProfitPct`, `stopLossPct`: % values for TP and SL
* `showRibbon`: Toggle visibility of EMA lines (the "ribbon")
This flexibility allows optimization for different timeframes, assets, or market conditions.
---
5. **Visuals & Alerts**
* **EMA Ribbon**: Optionally plots all 4 EMAs in distinct colors
* **Alerts**: Configurable alerts for both Buy and Sell pullback signals
* **Strategy Tester**: Fully compatible with TradingView’s backtester to review performance
---
✅ Key Features
* Pine Script **v5** compatible
* Simple yet powerful **trend-pullback strategy**
* Built-in **risk management** (TP/SL)
* Highly **customizable** and easy to optimize
* Works on **any timeframe or market** (stocks, crypto, forex, etc.)
* Optional **EMA Ribbon** and slow filter for visual context
---
📊 Strategy Use Cases
* Intraday trading
* Swing trading
* Trend continuation setups
* Building automated systems in TradingView
* Manual trade confirmation for other systems
---
⚙️ Example Settings
| Parameter | Value |
| ----------------- | --------- |
| Fast EMA Length | 8 |
| Signal EMA Length | 13 |
| Medium EMA Length | 21 |
| Slow EMA Length | 55 |
| Take Profit (%) | 2.0 |
| Stop Loss (%) | 1.0 |
| Use Slow EMA | ✅ Enabled |
---
📌 Important Notes
* This is a **trend-following strategy**. Best results occur in trending markets.
* In sideways or choppy markets, false signals may occur. Consider using higher timeframes or combining with volume filters.
* You can expand this strategy further by integrating:
* Multi-timeframe trend confirmation
* Additional filters (e.g. RSI, MACD)
* Trailing stop loss for dynamic exits
* Visual overlays (e.g. pivot points, fractals) for added context

RS to BTC – EYASU V1RS to BTC – Full Suite
📝 Description:
This script tracks the relative strength of any coin against Bitcoin (RSBTC) in real-time. It is designed for altcoin traders who want to identify which coins are outperforming or underperforming BTC across multiple timeframes.
Features:
📈 RSBTC Line: Real-time plot of the altcoin’s price divided by BTC price
🟦 RSBTC Moving Average: Smooths the RS line to help identify trends
🔵 RSBTC RSI (Hidden by default): Highlights momentum of RS to detect overbought/oversold zones
🚨 Alerts: Set alerts for RSBTC crossing its moving average and RSI levels
Ideal for:
Spotting early altcoin breakouts
Timing entries/exits based on BTC-relative performance
Filtering for strong/weak coins before macro news
📱 Fully mobile compatible. Load it on any USDT chart — it auto-detects BTC and gives RS instantly.
Created by: @Eyasustock
License: Mozilla Public License 2.0
Moby Tick Prints - version 1.0.0Prints are aggregated by date and price. If there are multiple trades on the same day at the same price, they are added and represented in the Shares column

Stochastic MACDStochastic MACD Indicator: Quick Guide
This Pine Script indicator, "Stochastic MACD" (SMACD), blends MACD and Stochastic Oscillator principles to help you spot momentum shifts and potential reversals.
What it Shows:
SMACD Line: Tracks momentum.
Signal Line: Averages the SMACD line, creating crossovers.
Histogram: Visualizes momentum strength, changing color with direction.
Overbought/Oversold Levels: (Default 10 and -10) Help identify stretched market conditions. Adjustable in settings.
Visual Signals (Triangles):
Red Down Arrow (Overbought Signal): Appears when both SMACD and Signal lines are above the Overbought level (default 10) AND SMACD crosses the Signal line upwards. This suggests strong overbought conditions and a potential reversal down.
Green Up Arrow (Oversold Signal): Appears when both SMACD and Signal lines are below the Oversold level (default -10) AND SMACD crosses the Signal line upwards. This suggests potential buying opportunities from oversold conditions and a possible reversal up.
How to Use It:
Confirm Trends: Use the histogram and line directions.
Spot Reversals: Look for the red and green triangles for quick alerts.
Combine: Always use with other analysis like price action or support/resistance.
Important: This is an analytical tool, not financial advice. Trading involves risk.

Smooth Cloud + RSI Liquidity Spectrum + Zig Zag Volume ProfileSmooth Cloud + RSI Liquidity Spectrum + Zig Zag++ Volume Profile" Indicator
| Advanced Trend & Liquidity Analysis.
---
📌 Key Features & Enhancements (Zig Zag++)
This advanced indicator combines **trend-following moving averages, RSI momentum with liquidity factors, and an improved Zig Zag++ algorithm with volume profiling** for precise swing detection.
🔹 Zig Zag++ Upgrades:
✅ **Dynamic Reversal Detection** – Adapts to volatility using percentage-based pivots.
✅ **Volume-Weighted Swing Points** – Highlights high-liquidity turning points.
✅ **Multi-Timeframe Confirmation** – Uses historical pivots for stronger signals.
✅ **Volume Profile Clustering** – Reveals key support/resistance zones based on traded volume.
---
📊 Indicator Components Breakdown
1️⃣ Smooth Cloud (Trend Filter)
- **Fast MA (20-period) & Slow MA (50-period)** – Configurable as EMA, SMA, or WMA.
- **Cloud Coloring** – Green when fast MA > slow MA (bullish), red otherwise (bearish).
- **Purpose**: Acts as a trend filter—only take trades in the direction of the cloud.
2️⃣ RSI Liquidity Spectrum (Momentum + Volume)
- **RSI (14-period default)** – Standard momentum oscillator.
- **Liquidity-Adjusted Momentum** = `(RSI + ROC(RSI,3)) * (Volume / SMA(Volume, RSI Length))`
- **Purpose**: Identifies overbought/oversold conditions with volume confirmation (high volume = stronger signal).
3️⃣ Zig Zag++ (Swing Detection & Volume Profiling)
📈 Zig Zag Logic:**
- **Percentage-Based Reversals** (default: 5%) – Only plots swings exceeding this threshold.
- **Pivot Tracking** – Stores price & bar index of each swing point in arrays.
- **Dynamic Line Drawing** – Connects swing points with yellow trendlines.
📊 Volume Profile at Swings:
- **Lookback Period** (200 bars default) – Analyzes volume distribution between Zig Zag turns.
- **10-Price Bin Clustering** – Splits the price range into 10 levels and calculates traded volume at each.
- **Transparency Scaling** – Higher volume zones appear darker (stronger support/resistance).
---
🎯 Step-by-Step Trading Strategies
📈 Strategy 1: Trend-Following with RSI Liquidity Confirmation**
1. **Enter Long** when:
- Smooth Cloud is **green** (fast MA > slow MA).
- RSI Liquidity Momentum crosses above **30** (bullish momentum + volume).
- Price pulls back to the **Volume Profile high-volume zone** (demand area).
2. **Enter Short** when:
- Smooth Cloud is **red** (fast MA < slow MA).
- RSI Liquidity Momentum crosses below **70** (bearish momentum + volume).
- Price rallies into the **Volume Profile high-volume zone** (supply area).
3. **Exit** when:
- Zig Zag++ detects a new reversal (5% move against position).
- RSI Liquidity Momentum crosses back mid-level (50).
---
📉 Strategy 2: Swing Trading with Zig Zag++ Pivots**
1. **Buy at Swing Lows** when:
- Zig Zag++ prints a **higher low** (bullish structure).
- Volume Profile shows **strong absorption** (high volume at the low).
- RSI Liquidity Momentum is rising from oversold (<30).
2. **Sell at Swing Highs** when:
- Zig Zag++ prints a **lower high** (bearish structure).
- Volume Profile shows **distribution** (high volume at the top).
- RSI Liquidity Momentum is falling from overbought (>70).
3. **Stop Loss**:
- Below the recent Zig Zag low (for longs).
- Above the recent Zig Zag high (for shorts).
---
📌 Additional Enhancements (Pro Tips)**
- **Combine with Higher Timeframe (HTF) Cloud** – Use a 4H/1D cloud to filter trades.
- **Divergence Detection** – Hidden bullish/bearish divergences between Zig Zag & RSI Liquidity.
- **Volume Spike Confirmation** – Only trade if volume exceeds SMA(volume, 20) at reversal points.
---
🚀 Conclusion
This **all-in-one indicator** provides:
✔ **Trend direction** (Smooth Cloud)
✔ **Momentum + Liquidity strength** (RSI Spectrum)
✔ **Precise swing points** (Zig Zag++)
✔ **Volume-based S/R zones** (Profile Clustering)
Best used on **15M-4H timeframes** for swing/day trading. Adjust parameters based on asset volatility.

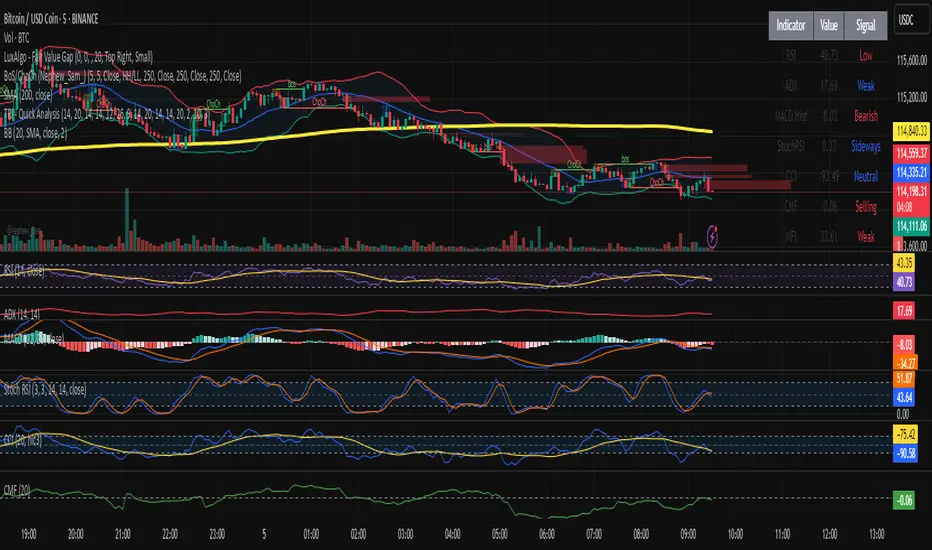
TRI - Quick Analysis"TRI - Quick Analysis" is a multi-indicator dashboard designed to give traders an immediate overview of market momentum, trend strength, volume flow, and volatility.
It visually summarizes key technical indicators in a compact table, including:
RSI (momentum)
MACD Histogram (trend momentum)
ADX + SuperTrend (trend strength & direction)
StochRSI (oversold/overbought)
CCI (price deviation)
CMF (volume flow)
MFI (volume-weighted momentum)
OBV (cumulative volume pressure)
ATR (volatility)
%B Bollinger (position within Bollinger Bands)
Each value is color-coded (green, red, blue) based on whether it's favorable, unfavorable, or neutral for a potential long position.
At the bottom of the table, a summary score dynamically aggregates signals from all indicators and provides a simple trading score.
This tool is designed for discretionary traders looking for a quick, color-coded insight into current market conditions without relying on a single signal.
Current Day High/Low and Mid- Made by IshaanThis TradingView indicator plots the current day's high, low, and mid (50%) levels, based on the daily timeframe, and displays them on any intraday chart (e.g., 15m, 1h, etc.).
Lines begin at the official market open time (default: 9:30 AM exchange time).
Lines extend right indefinitely so they’re visible throughout the day.
Values are updated live during the trading session using daily high and low data.
The mid line is calculated as the average of the current day’s high and low.
You can customize:
Line colors (high, low, mid)
Line thickness
Market open time
This tool is helpful for traders looking to monitor intraday interaction with key daily levels.