Buy Sell Sniper Entry Background (based on EP Script by RedK)
Is this one of the most precise Buy Sell Indicators?
Only you can tell!
Based on the EP script by RedK EVEREX this indicator will color your background directly in your chart. Clean, easy, simple.
I did not alter any of their logic, nothing.
Looking for an even more precise entry option?
How about combining it with my first Background Indicator based on Williams Alligator.
The Candle coloring is based on this TUE ADX script
Happy Sniper Trading!
Trend Analysis

Time-Price Velocity [QuantAlgo]🟢 Overview
The Time-Price Velocity indicator uses advanced velocity-based analysis to measure the rate of price change normalized against typical market movement, creating a dynamic momentum oscillator that identifies market acceleration patterns and momentum shifts. Unlike traditional momentum indicators that focus solely on price change magnitude, this indicator incorporates time-weighted displacement calculations and ATR normalization to create a sophisticated velocity measurement system that adapts to varying market volatility conditions.
This indicator displays a velocity signal line that oscillates around zero, with positive values indicating upward price velocity and negative values indicating downward price velocity. The signal incorporates acceleration background columns and statistical normalization to help traders identify momentum shifts and potential reversal or continuation opportunities across different timeframes and asset classes.
🟢 How It Works
The indicator's key insight lies in its time-price velocity calculation system, where velocity is measured using the fundamental physics formula:
velocity = priceChange / timeWeight
The system normalizes this raw velocity against typical price movement using Average True Range (ATR) to create market-adjusted readings:
normalizedVelocity = typicalMove > 0 ? velocity / typicalMove : 0
where "typicalMove = ta.atr(lookback)" provides the baseline for normal price movement over the specified lookback period.
The Time-Price Velocity indicator calculation combines multiple sophisticated components. First, it calculates acceleration as the change in velocity over time:
acceleration = normalizedVelocity - normalizedVelocity
Then, the signal generation applies EMA smoothing to reduce noise while preserving responsiveness:
signal = ta.ema(normalizedVelocity, smooth)
This creates a velocity-based momentum indicator that combines price displacement analysis with statistical normalization, providing traders with both directional signals and acceleration insights for enhanced market timing.
🟢 How to Use
1. Signal Interpretation and Threshold Zones
Positive Values (Above Zero): Time-price velocity indicating bullish momentum with upward price displacement relative to normalized baseline
Negative Values (Below Zero): Time-price velocity indicating bearish momentum with downward price displacement relative to normalized baseline
Zero Line Crosses: Velocity transitions between bullish and bearish regimes, indicating potential trend changes or momentum shifts
Upper Threshold Zone: Area above positive threshold (default 1.0) indicating strong bullish velocity and potential reversal point
Lower Threshold Zone: Area below negative threshold (default -1.0) indicating strong bearish velocity and potential reversal point
2. Acceleration Analysis and Visual Features
Acceleration Columns: Background histogram showing velocity acceleration (the rate of change of velocity), with green columns indicating accelerating velocity and red columns indicating decelerating velocity. The interpretation depends on trend context: red columns in downtrends indicate strengthening bearish momentum, while red columns in uptrends indicate weakening bullish momentum
Acceleration Column Height: The height of each column represents the magnitude of acceleration, with taller columns indicating stronger acceleration or deceleration forces
Bar Coloring: Optional price bar coloring matches velocity direction for immediate visual trend confirmation
Info Table: Real-time display of current velocity and acceleration values with trend arrows and change indicators
3. Additional Features:
Confirmed vs Live Data: Toggle between confirmed (closed) bar analysis for stable signals or current bar inclusion for real-time updates
Multi-timeframe Adaptability: Velocity normalization ensures consistent readings across different chart timeframes and asset volatilities
Alert System: Built-in alerts for threshold crossovers and direction changes
🟢 Examples with Preconfigured Settings
Default : Balanced configuration suitable for most timeframes and general trading applications, providing optimal balance between sensitivity and noise filtering for medium-term analysis.
Scalping : High sensitivity setup with shorter lookback period and reduced smoothing for ultra-short-term trades on 1-15 minute charts, optimized for capturing rapid momentum shifts and frequent trading opportunities.
Swing Trading : Extended lookback period with enhanced smoothing and higher threshold for multi-day positions, designed to filter market noise while capturing significant momentum moves on 1-4 hour and daily timeframes.

Adaptive Market Profile – Auto Detect & Dynamic Activity ZonesAdaptive Market Profile is an advanced indicator that automatically detects and displays the most relevant trend channel and market profile for any asset and timeframe. Unlike standard regression channel tools, this script uses a fully adaptive approach to identify the optimal period, providing you with the channel that best fits the current market dynamics. The calculation is based on maximizing the statistical significance of the trend using Pearson’s R coefficient, ensuring that the most relevant trend is always selected.
Within the selected channel, the indicator generates a dynamic market profile, breaking the price range into configurable zones and displaying the most active areas based on volume or the number of touches. This allows you to instantly identify high-activity price levels and potential support/resistance zones. The “most active lines” are plotted in real-time and always stay parallel to the channel, dynamically adapting to market structure.
Key features:
- Automatic detection of the optimal regression period: The script scans a wide range of lengths and selects the channel that statistically represents the strongest trend.
- Dynamic market profile: Visualizes the distribution of volume or price touches inside the trend channel, with customizable section count.
- Most active zones: Highlights the most traded or touched price levels as dynamic, parallel lines for precise support/resistance reading.
- Manual override: Optionally, users can select their own channel period for full control.
- Supports both linear and logarithmic charts: Simple toggle to match your chart scaling.
Use cases:
- Trend following and channel trading strategies.
- Quick identification of dynamic support/resistance and liquidity zones.
- Objective selection of the most statistically significant trend channel, without manual guesswork.
- Suitable for all assets and timeframes (crypto, stocks, forex, futures).
Originality:
This script goes beyond basic regression channels by integrating dynamic profile analysis and fully adaptive period detection, offering a comprehensive tool for modern technical analysts. The combination of trend detection, market profile, and activity zone mapping is unique and not available in TradingView built-ins.
Instructions:
Add Adaptive Market Profile to your chart. By default, the script automatically detects the optimal channel period and displays the corresponding regression channel with dynamic profile and activity zones. If you prefer manual control, disable “Auto trend channel period” and set your preferred period. Adjust profile settings as needed for your asset and timeframe.
For questions, suggestions, or further customization, contact Julien Eche (@Julien_Eche) directly on TradingView.

TZtraderTZtrader
This is a TrendZones version with features to set stoploss and targets in short and long positions meant for use in intraday charts. It aims to provide signals for opening and closing long and short positions. In the comments under the TrendZones publication several people expressed a need for features for a short position similar to those for a long position as implemented in TrendZones, some want to use it for scalping, some asked for alerts. When I proposed to create a version for day trading with target lines based on ATR, several people liked the idea.
Full disclosure: I don’t do day trading, because, after I lost a lot of money, I had to promise my wife to stay away from it. I restrict myself to long term investing in stocks which are in uptrend. However I understand what a day trader needs. I gather from my experience that day trading or scalping is an attempt to earn something by opening a position in the morning and close, reopen and close it again during the day with a profit. It is usually done with leveraged instruments like CFD’s, futures, options, and what have you. Opening and closing positions is done within minutes, so the trader needs a quick and efficient way to set proper stoploss and target. TZtrader supports this by showing only three or four numbers on the price bar: The price of the instrument, The logical stop level (gray or green or maroon dots), and the target level (navy). All other numbers are suppressed to prevent mistakes. Also a clear feedback for current settings at the top-center of the pane and an alert feedback at bottom that flashes alerts during the development of the current bar and gives suppression status.
The script
First I made a bare bones version of TrendZones to which I added code for long and short trading setups and a bare setup for no position. The code for the logical stops in long setup had to be reviewed, after which this became the basis for stops in short setup.
Then I added code for 10 alert messages, which was a hassle, because this is the first time I coded alerts and the first time I used an array as a stack to avoid a complicated if-then construction. During testing the array caused a runtime error which I solved by adding ‘array.clear’ to the code, also I discovered that in TradingView separate alerts have to be created for all three setups - short, long and bare. Flipping setups is done in the inputs with a dropdown menu because Pine Script has no function for a clickable button.
One visual with three setups.
The visual has the TrendZones structure: Three near parallel very smooth curves, which border the moderate uptrend (green) and downtrend (orange) zone over and under the curve in the middle, the COG (Center Of Gravity). Where the price breaks out of these curves, strong trend zones show up over and under the curves, respectively strong uptrend (blue) and strong downtrend (red).
Three setups were made clearly different to avoid confusion and to provide oversight in case of multiple trades going on simultaneously which I imagine are monitored in one screen. You have to see which one is long, which short and which have no position. The long setup should not trigger short signals, nor should the short trigger long signals nor the bare setup exclusive long or short signals.
The Long setup is default, shown on the example chart. In this setup the Stoploss suggestions (green, gray and maroon dots) are under the price bars and the target line (navy) at a set distance above the High Border. A zone with a width of 1 ATR is drawn under the Low Border. In this setup 5 specific alerts are provided
The Short setup has the Stoploss suggestions over the price bars, the target line at a set distance under the Low Border. A zone with a width of 1 ATR is drawn above the High Border. This setup also has 5 specific alerts.
The Bare setup has no Stoploss suggestions, no target line and supports 4 alerts, 2 in common with the Long setup and 2 with Short.
The table below gives a summary of scripted alerts:
Setup = Where = When = Purpose
Long, Bare = Green Zone = Bars come from lower zones = Uptrend starts
Long, Bare = Green Zone = Sideways ends in uptrend = Uptrend resumes
Long = COG = First crossing = Uptrend might end warning
Long = Orange Zone = Bars come from higher zones = Uptrend ended take care
Long = Red Zone = Bars come from higher zones = Strong downtrend->close Long
Short, Bare = Orange Zone = Bars come from higher zones = Downtrend starts
Short, Bare = Orange Zone = Sideways ends in downtrend = Downtrend resumes
Short = COG = First crossing = Downtrend might end warning
Short = Green Zone = Bars come from lower zones = Downtrend ended take care
Short = Blue Zone = Bars come from lower zones = Strong uptrend -> close short
You can use script alerts in TradingView by clicking the clock in the sidebar, then ‘create alert’ or plus, as condition you choose ‘Tztrader’ in the dialog box, then the “Any alert() function call” option (the first item in the list). The script lets the valid alert trigger by TradingView after the bar is completed, this can differ from the flashed messages during its formation.
When you create alerts in Tradingview, I advice to do that for each setup, then to make only the alert active which matches the current setup, pause the other ones.
Suppressing false and annoying signals
The script has two ways to suppress such signals, which have to do with the numbers in the alert feedback. The numbers left and right of the message with a colored background, depict the zones in which the previous (left) and current (right) bar move. 1 is the strong downtrend zone (red), 2 the moderate downtrend zone (orange), 3 the sideways zones (gray), 4 the COG (gray), 5 the moderate uptrend zone (green), 6 the strong uptrend zone (blue), 7 something went wrong with assigning a zone (black). In extensive testing the number 7 never occurs, because I catch that error in the code. The idea is that an alert is only triggered if the previous bar was in a different zone. When the bars are in the same zone, no alert is possible. This way all annoying signals are suppressed and long, short and bare get the appropriate alerts.
The third number is a counter. It counts how often the COG is crossed without touching the outer curves. The counter will reset to zero when the upper or lower curve is touched. When the count is 1 you have zone situation 4 and appropriate alerts are flashed. When the count is 2 or higher, a sideways situation (3) is called and while the recrossings are going on, no alerts can be flashed. This suppresses false signals. The ATR zone and curves are brownish-gray where sideways happens(ed). When the channel is narrowed down to just the three curves, some false signals still might occur.
Inputs
“Setup”, default is long, drop down menu provides long, short and bare.
“Target ATR”, default is 2, sets the amount of ATR for the target line. In 1 minute charts 4 seems an appropriate setting, you have to learn by experience which setting works.
“show feedback …” default is on, This creates two feedback labels, a Setup feedback on top of the pane, which shows charted instrument, Setup type, Trend and timeframe of the chart. Background color of Trend feedback is green when it matches the setup, red when mismatches and gray when no match. The alert feedback at the bottom of the pane shows a number, a message and two numbers. The numbers will be explained in the chapter about false and annoying signals below. During formation of the bar, valid alerts are flashed with a blue background, otherwise the message ‘alerts for current bar suppressed’.
Logical Stops
The curves are the logical place to put stops, because, as these are averages of the high and low border of a Donchian channel, they signify the ‘natural’ current highest, lowest and main level in the lookback period that fit the monitored trend setup. A downtrend turns into an uptrend when a breakout of the upper curve occurs. If you are short, that is where you want to close position, so the logical place for the stoploss is the upper curve. Vice versa, when you are long, the logical stop is on the lower curve. The stops show up as green or gray dots on the curves, the green dots signify a nice entry level, the gray stops are there to suggest levels where unrealized profits might be secured, the maroon dots indicate that the trend mismatches the setup.
COG versus other lines
Any line used to identify a trend, be it some MA or some other line, is interpreted the same way: When the bars move above the line there is an uptrend and when below, a downtrend. COG is not different in that sense. If you put such a line in the same chart as TZtrader, you can see situations in which the other line shows uptrend or downtrend earlier than COG, also some other lines, e.g. Hull MA, are very good at showing tops and bottoms, while COG ignores these. On the other hand the other lines are usually a little nervous and let you shake out of position too soon. Just like the other lines, COG gives false signals when it is near horizontal. The advantage of the placement COG is the tolerance for pull backs. This way TZtrader keeps you longer in the trend. Such pull backs are often ‘flags’ which are interpreted in TA as confirming the trend. Tztrader aims to get you in position reasonably soon when a trend begins and out of position as soon as the trend turns against you. The placement of COG is done with a fundamentally different algorithm than other lines as it is not an average of prices, but the middle of two averages of borders of a Donchian channel. This gives the two zones between the curves the same quality as the two zones above and below the middle line of a standard Donchian Channel.
A multi timeframe application.
In this scenario you put a 5 minutes and 1 minute chart with Tztrader side by side. If the 5 minutes shows uptrend, set the 1 minute on long trading and open positions when the trend matches uptrend en close when it mismatches. Don’t open short positions. Once the 5 minute changes to downtrend, set Tztrader in the 1 minute to short trading and open positions when the trend matches downtrend and close when it mismatches.
The idea is that in a long ‘context’, provided by the 5 minutes, the uptrends in the 1 minute will last longer and go further, vice versa for the short ‘context’. This way you do swing trading in the 5 minute in a smart way, maximizing profits.
You can do this with any timeframe pairs with a proportion of around 5:1, 4:1, 6:1, like e.g. 60 minutes and 15 minutes or weeks and days (5 trading days in a week).
Dear day-traders, may this tool be helpful and may your days be blessed.
Take care

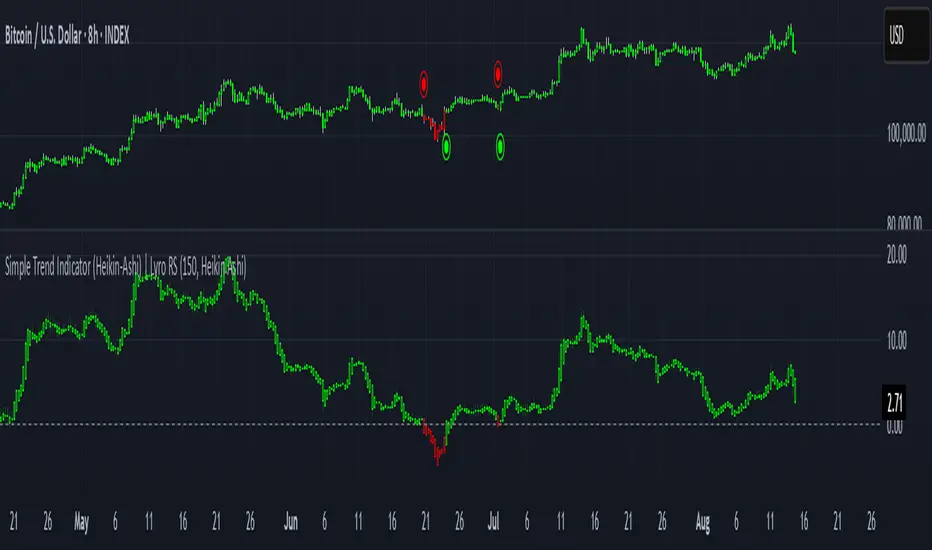
Simple Trend Indicator (Heikin-Ashi) | Lyro RSSimple Trend Indicator (Heikin-Ashi)
A momentum oscillator using Heikin-Ashi smoothed data to filter trend direction with zero-line crosses.
This indicator calculates the normalized deviation of Heikin-Ashi OHLC values from their Simple Moving Average (SMA), then averages these deviations into a single oscillator. It simplifies trend detection by:
Reducing noise via Heikin-Ashi smoothing.
Highlighting momentum shifts through a zero-line cross system (bullish/bearish).
Providing clear visual signals with color-coded plots and directional dots.
Originality:
Unlike standard momentum oscillators, this tool uniquely combines:
Heikin-Ashi normalization for cleaner trend analysis.
Multi-component averaging (high, open, low, close) to balance sensitivity.
Minimalist design for clutter-free charting.
How It Works:
Data Input: Fetches Heikin-Ashi OHLC values using request.security().
Momentum Calculation: For each Heikin-Ashi component:
Computes % deviation from its SMA: (value − SMA(value, length)) / SMA(value, length) * 100.
Oscillator: Averages deviations of all four components into one line (sum).
Signals:
Bullish: Oscillator > 0 (green).
Bearish: Oscillator < 0 (red).
Cross Confirmation: Dots (⦿) mark zero-line crosses.
Usage:
Trend Following: Enter long/short on sustained oscillator breaks above/below zero.
Reversal Watch: Zero-line crosses may hint at weakening momentum.
Filter: Combine with volume or support/resistance levels.
⚠️Disclaimer: This indicator is a tool for technical analysis and does not provide guaranteed results. It should be used in conjunction with other analysis methods and proper risk management practices. The creators of this indicator are not responsible for any financial decisions made based on its signals.
Mara JPY Strength (USDJPY+EURJPY+GBPJPY)/3 + DXYJPY, USDJPY, EURJPY, GBPJPY, smart money, bias, index, forex indicator, DXY, strength meter, professional, trading tool, price action

Mara JPY Bias ProMara JPY Bias Pro™ is a precision tool built for serious traders who focus on JPY and USD pairs.
This synthetic index combines USDJPY + EURJPY + GBPJPY, generating a smooth and dynamic representation of JPY strength or weakness. When the line turns green, JPY is weakening — time to look for LONG setups on XXX/JPY pairs. When red, JPY is strengthening — ideal moment for SHORT trades.
Built-in bias logic with adjustable MA-based trend detection or slope/momentum view lets you customize signals based on your strategy.
Plus, we’ve included a normalized DXY overlay, so you can track USD strength in parallel — perfect for traders working with EUR/USD, GBP/USD, USD/JPY and JPY crosses.
💡 Designed for day traders, scalpers, and smart money traders looking for clean confluence.
✅ Features:
Visual color-coded JPY bias (Green = Long / Red = Short)
Optional USD (DXY) strength overlay
Customizable MA length and bias logic
Built-in alerts for bias shifts & momentum flips
🔔 Alert-ready – never miss a reversal.
Trade smarter. Cut the noise. Stay on the right side of the move.

Global M2 Money Supply // Days Offset =This is the original version.. there is no update... just needed to re-install the script.

Dual Supertrend tohungmc tikDual Supertrend is an advanced trend-following indicator that combines two Supertrend strategies — a Large Supertrend and a Small Supertrend — to provide you with more precise entry and exit signals.
This indicator plots two Supertrend lines:
Large Supertrend (Blue and Orange): A broader trend that reacts slower to price movements.
Small Supertrend (Green and Red): A faster trend that responds quicker to market changes.
Key Features:
Customizable ATR Periods and Multipliers for both Large and Small Supertrends.
Buy/Sell Signals: When the Small Supertrend trend changes, and it's aligned with the Large Supertrend, you get reliable buy and sell signals.
Highlighting: The background can be highlighted in green or red, depending on whether the Large Supertrend is in an uptrend or downtrend.
Alerts: Alerts can be set for buy/sell signals or when the trend direction changes.
Use Case:
This indicator is designed for traders looking to follow both long-term and short-term trends. By combining the slower Large Supertrend with the faster Small Supertrend, it gives a more comprehensive view of market trends and better entry/exit points.
Indicator Inputs:
ATR Periods and Multipliers: Control how sensitive the Supertrend reacts to market changes.
Highlighting: Enable/Disable background highlighting.
Buy/Sell Signals: Option to show buy/sell signals based on trend direction changes.

Lucas Scalia Maximums and minimums of the day, week, and month. Basically, it automatically marks and labels the highs and lows of the previous daily , weekly, and monthly candles. The labels can be added or removed at your discretion, leaving only the dotted lines.

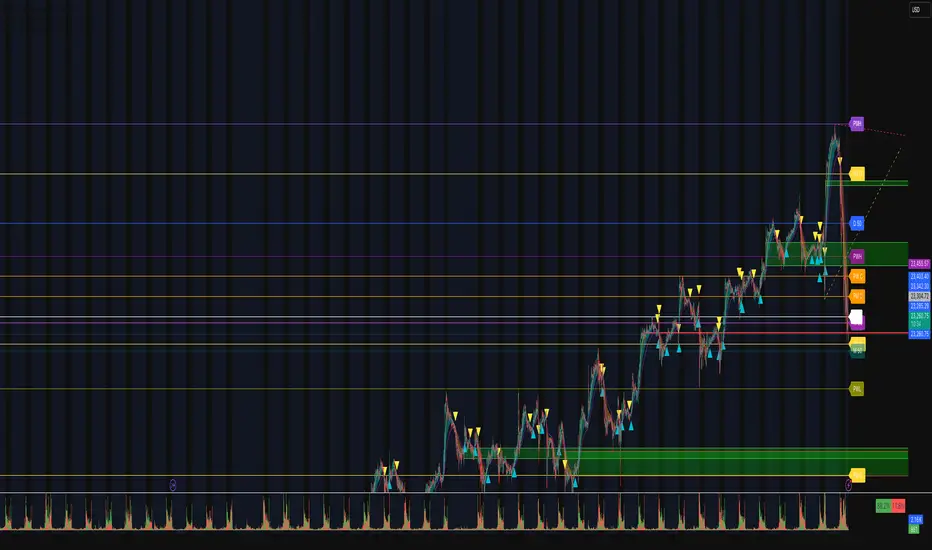
Auto-Pivot Levels with Alerts and 4 methods [ChartWhizzperer]🚀 Auto-Pivot Levels – Dynamic Edition
Now with
Live Mode,
4 Pivot Methods
PineConnector-Ready Alerts!
Free, Open Source, Pine Script v6-compliant.
🟢 NEW: Live Mode (Ultra-Dynamic, Repainting) – Switchable in UI!
Instantly switch between Classic (session-based, repaint-free) and Live (rolling window, real-time, repainting) using the simple checkbox in the settings!
Live Mode recalculates all pivots on every tick/bar, using the current high/low/close for the chosen session (daily, weekly, monthly).
Perfect for:
Scalping and high-frequency trading
Real-time bot/automation setups (PineConnector-ready)
Fast-moving or breakout markets
Classic Mode: For traditional, stable levels based on confirmed session data – ideal for backtesting and trading history.
📊 Four Calculation Methods (Choose What Fits YOU):
1️⃣ Classic
Standard pivot calculation.
Based on previous session’s High, Low, Close.
Simple, proven, and suitable for any asset.
2️⃣ Fibonacci
Projects levels using Fibonacci ratios of the prior session’s range.
Great for traders who want to align pivots with fib retracements and extensions.
3️⃣ Camarilla
Uses unique multipliers for support/resistance, focusing on mean reversion and volatility.
Popular among futures and forex day traders.
4️⃣ Woodie
Puts extra weight on previous Close for more responsive pivots.
Often used in trending or choppy conditions.
Switch methods anytime in the UI – the script recalculates instantly and keeps your chart clean!
🔔 Level-Specific Alerts – PineConnector Ready!
Dedicated alert for EVERY level and direction (Up/Down):
Pivot (P), R1, R2, R3, S1, S2, S3
No configuration hassle:
All alerts are pre-defined in the TradingView Alert Panel.
Machine-readable message format:
PIVOT=R1 DIR=UP SYMBOL={{ticker}} PRICE={{close}}
Direct plug-and-play with PineConnector, webhooks, Discord, Telegram, bots, and other automation tools.
Never miss a breakout, reversal, or key support/resistance touch.
🛠 Powerful Customization & Performance
Session selection: Daily, Weekly, Monthly (choose what suits your trading style).
Show/hide any level (Pivot, R1–R3, S1–S3) for minimal chart clutter.
Color selection for each level to match your theme or highlight key pivots.
Auto-cleanup: Old lines and labels are cleared on every recalculation or session change for maximum performance and visual clarity.
Zero runtime errors: Strict Pine Script v6 practices for stability.
💡 How To Use – Quick Start
Add the indicator to your TradingView chart.
Pick your calculation method (Classic, Fibonacci, Camarilla, Woodie).
Set session type (Daily, Weekly, Monthly).
Switch between Classic and Live Mode with a single click in settings.
Customize your levels (on/off, colors).
Open the Alert Panel, select any pre-configured alert (e.g. "R2 Cross Down"), and go live!
Connect with PineConnector or any webhook system instantly using the pre-formatted alert messages.
🤖 Who Is It For?
Active scalpers & bot traders: Live Mode + PineConnector-ready alerts = instant, automated reactions.
Swing and position traders: Use Classic Mode for stable, repaint-free levels.
Strategy developers: Seamless integration into automated and manual trading workflows.
🏷 License & Community
Open Source, Non-Commercial:
Free for personal & educational use under CC BY-NC-SA 4.0.
Feedback, bug reports & ideas:
Drop a comment, or contact me for feature requests.
Trade smart. Trade dynamic. Unlock the true power of pivots – with ChartWhizzperer !

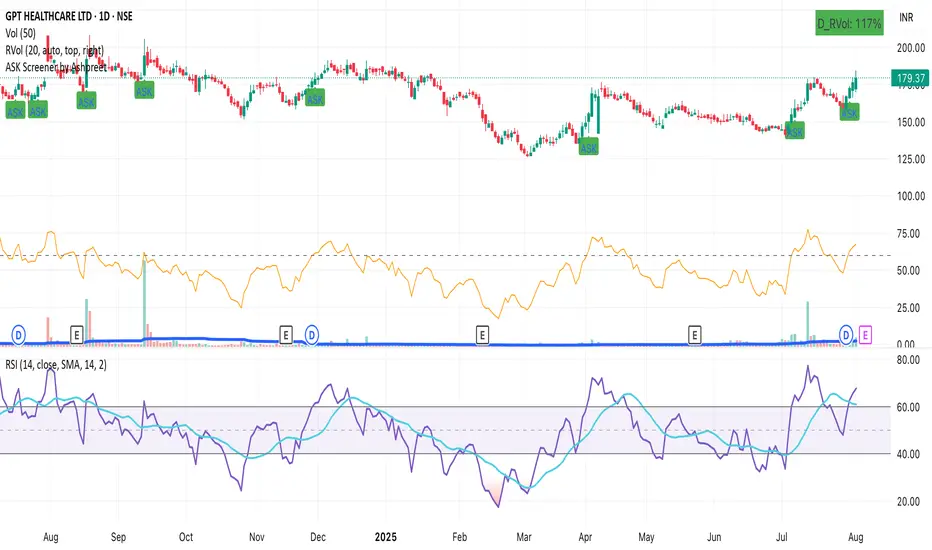
ASK Screener by AshpreetThe ASK Indicator is a custom-built breakout and trend continuation system designed for swing traders seeking high-probability entries with strong risk-reward ratios. Built using a combination of moving averages, momentum filters, volume confirmation, and price structure, this indicator helps identify stocks poised for explosive moves.
It uses three key moving averages: the 44-period SMA (medium trend), 20-period DEMA (short-term strength, custom-coded), and 50-period WEMA (institutional trendline). Trades are only triggered when the price is above 50 WEMA, and the 20 DEMA is above the 44 SMA.
Momentum is confirmed using RSI(14) within a healthy zone of 40–60, ensuring the stock is not overbought or oversold. To focus on breakout candidates, the stock must be trading within 10% of its 52-week high, and the weekly candle range must be under 10%, signaling compression before expansion.
A valid ASK Signal occurs when these conditions are met along with a breakout above the previous day’s high and volume exceeding 1.5× the 20-day average. Once triggered, the indicator auto-plots the stop-loss (1× ATR) and two profit targets: 1:2 (TP1) and 1:4 (TP2).
Additionally, the system detects a narrow range setup, where the last 3 daily candles are inside the previous 3-day range — a powerful consolidation signal. Alerts for both ASK entries and narrow ranges are included.
This system is ideal for positional and short-term swing traders who want to combine structure, momentum, and volume in one powerful tool.
Auto Channel [SciQua]Auto Channel
Purpose
Auto Channel finds the single best parallel price channel from recent price action and keeps it updated in real time. It uses ZigZag pivots to build candidate channels, scores each candidate for quality, then plots the winner. When price closes outside the channel, the script flags a breakout and can fire alerts.
How it works
1. ZigZag pivots
The script uses TradingView’s TradingView/ZigZag/7 library to generate a stream of swing highs and lows based on a percentage reversal threshold and a leg depth. These pivots are the only points the channel logic evaluates, which keeps the search fast and focused on structure rather than noise.
2. Channel candidates
From the most recent pivots, the script forms all combinations of two swing highs and two swing lows.
It computes a slope for the high line and a slope for the low line and requires that they be nearly parallel within a user-defined tolerance.
3. Quality scoring and selection
For every valid candidate, the script checks the recent pivot segments against the trial channel and computes:
Inside ratio: fraction of tested pivots that sit fully inside the channel after applying the tolerance buffer.
Violation sum: total magnitude of the breaches for any pivots outside the channel.
Current width: distance between upper and lower lines at the current bar.
The “best” channel is chosen by:
1. highest inside ratio
2. then widest current width
3. then smallest violation sum
4. Plot and projection
The upper and lower lines are anchored to the chosen pivot pairs and extend to the left. The script also projects each line to the current bar to compute the live upper and lower channel prices. Those levels drive the breakout checks and alerts.
5. Breakouts and alerts
A breakout is detected when the bar closes above the projected upper line or closes below the projected lower line, after applying the tolerance buffer. Triangle markers highlight fresh breakouts, and you can enable alert conditions to automate notification or strategy handoff.
Inputs:
ZigZag
Price deviation for reversals (%)
Default 0.2. Larger values produce fewer, larger swings. Smaller values produce more, smaller swings.
Pivot legs
Default 2. Controls the lookback depth ZigZag uses to confirm pivots.
ZigZag Color
Visual only.
Tip: If you are not seeing a stable channel, increase the ZigZag percentage to reduce minor swings.
Channel search
Number of recent pivots to consider
Default 12. Higher values search more history and try more channel combinations. Lower values make the search faster and more reactive.
Max slope difference for parallel
Default 0.0005. Maximum allowed difference between the upper and lower line slopes. Smaller values enforce stricter parallelism.
Max price tolerance outside channel
Default 0.0. A buffer added to the channel boundaries during validation and breakout checks. Use this to ignore tiny wicks that poke the lines.
Minimum inside to outside pivots ratio for valid channel (0.00–1.00)
Default 1.00. Require that at least this fraction of checked pivots lie inside the channel. For a more permissive fit, try 0.60 to 0.85.
Styling
Upper Line Color
Lower Line Color
Breakout Above Color
Breakout Below Color
Plots and visuals
Upper channel line
Lower channel line
Triangle markers on the bar that first confirms a close outside the channel, above or below.
Lines extend left from their pivot anchors. Projection to the current bar is used internally to test for breakouts and to set alerts.
Alerts
The script defines two alert conditions:
Close Above Channel
Triggers when the bar closes above the projected upper line plus tolerance.
Close Below Channel
Triggers when the bar closes below the projected lower line minus tolerance.
Practical usage
Trend channels
In a steady trend, a high inside ratio with a moderate width often highlights the dominant channel. Consider trend entries near the lower line in an uptrend or near the upper line in a downtrend, with exits or stops beyond the opposite boundary.
Breakout trades
Combine the channel breakout alert with volume or a separate momentum filter. The tolerance input helps avoid false triggers from small wicks.
Tuning for timeframe and symbol
• Faster markets or lower timeframes usually benefit from a larger ZigZag percentage and a smaller pivot count.
• Slower markets or higher timeframes can use more pivots and a tighter slope difference to enforce cleaner geometry.
Notes and limitations
Channels are derived from ZigZag pivots. If your ZigZag settings change, the detected channel will also change.
The script plots only the single best channel at any time to keep the chart clean.
Breakout markers appear on confirmed bars. For historical bars, markers appear only where a breakout would have been confirmed at that time.
Lines extend left from their anchors. The script projects the lines internally to the current bar for checks and alerts.
License and attribution
License
Creative Commons Attribution-NonCommercial 4.0 International (CC BY-NC 4.0).
Open source for educational and personal use only. Commercial use requires written permission.
Attribution
© 2025 SciQua — Joshua Danford
Libraries
Uses TradingView/ZigZag/7.
Changelog
v1.0
Initial release. Automatic parallel channel detection from ZigZag pivots, quality scoring, live plotting, and close-based breakout alerts.
FAQ
Why do I not see any channel sometimes?
There may not be a valid pair of highs and lows that pass the slope, inside ratio, and tolerance checks. Loosen the constraints by increasing Max slope difference, lowering Minimum inside ratio, or increasing the ZigZag percentage.
The channel looks too narrow or too wide?
Adjust Number of recent pivots and Minimum inside ratio. A higher inside ratio tends to favor cleaner, sometimes wider channels. A lower ratio may admit narrower, more reactive channels.
How can I reduce false breakout alerts?
Increase Max price tolerance outside channel to ignore small wicks. Add a volume or momentum confirmation in your personal alert workflow.
Thank you for using Auto Channel . Feedback and improvements are welcome.


Auto AVWAP (Anchored-VWAP) with Breakout ScreenerAuto AVWAP (Anchored-VWAP) with Breakout Screener. fINAL VERSION

Trend_Finder(Telegram-RR_Algo_Indicators_Intraday)EMA Inputs
It uses 6 EMAs with customizable lengths (defaults: 30, 35, 40, 45, 50, 60).
Trend Conditions
Bullish Trend: All EMAs are strictly ordered from smallest to largest, meaning short-term prices are leading long-term prices upward.
Bearish Trend: All EMAs are ordered from largest to smallest, meaning short-term prices are falling below long-term ones.
Neutral: EMAs are mixed and do not meet the above criteria.
Trend Tracking
The script remembers the current trend and only flips when a full trend reversal condition is confirmed.

3 EMA cross overThis Pine Script displays the 3 EMA trend status for a list of popular stocks in a dynamic table. It calculates and monitors 13 EMA, 48 EMA, and 200 EMA for each ticker to detect bullish or bearish alignment.
Best Use:
Use this script to quickly scan market trends across multiple stocks and identify potential trade opportunities based on EMA alignment.

Buy/Sell Demand Pressure SMAThis indicator shows when competing buying and selling pressure has changed.
When bullish buying offsets bearish transaction volume, the indicator turns green. When bearish selling pressure offsets bullish buying volume the indicator is red.
Can be used as a normal SMA or to confirm buy/sell signals of other indicators.
Works best at the start of trades...and not exits but if set properly, it is a good indicator of when a trend has reversed.
~ jb tuttle

Manual 1H Trend BackgroundThis TradingView Pine Script v6 indicator allows you to manually set the trend direction (based on your analysis of the 1-hour timeframe), and it will change the background color of your chart based on that input:
"Buy" → chart background turns green
"Sell" → chart background turns red
"Neutral" → no background color (transparent)

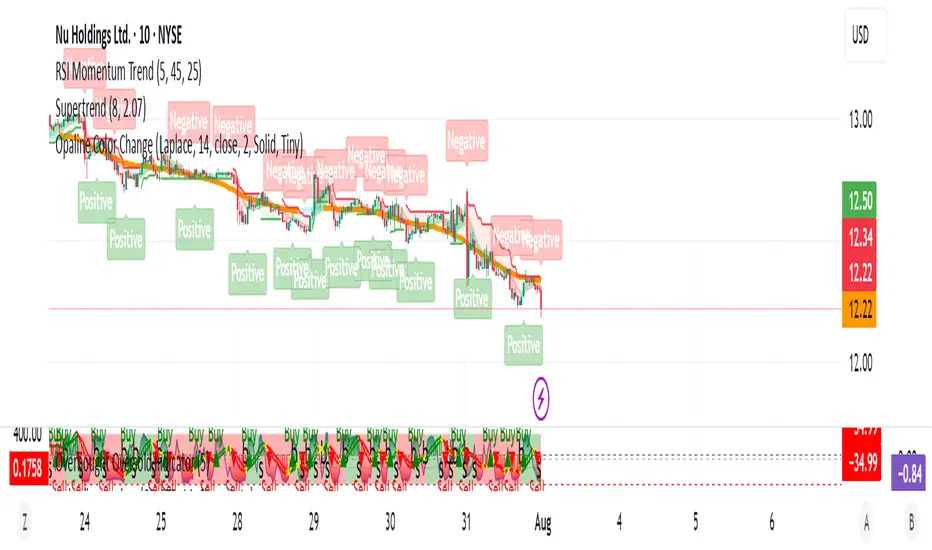
Opaline Color ChangeONLY USE for serious full time trading strategy, or running away from Military/City.
Multi Kernel Regression with Alert.

X1 newbie code trying to create
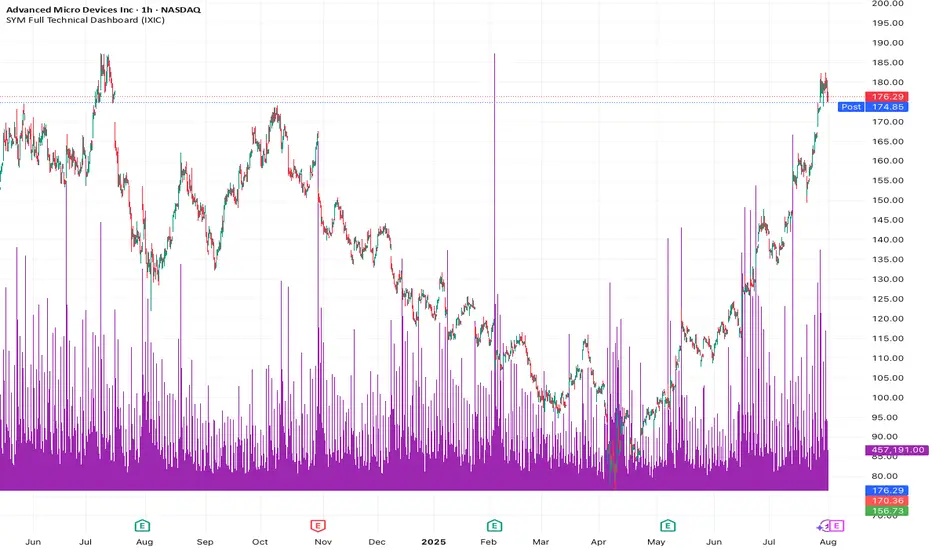
✅ Script Behavior on Other Stocks
• If you’re on a chart for SYM, it calculates indicators using SYM’s data.
• If you switch to NVDA, AVGO, CRDO, etc., it will automatically update to reflect that ticker’s:
• Price
• 50-day moving average
• Volume
• MACD
• RSI
• Index comparison
with 1. 📊 Volume shows in its own pane
2. ✅ MACD and RSI are included in separate panes (as promised)
3. 🎯 Script works cleanly with any ticker