Valuation TableHey folks, I hope you are all doing well!
This is an indicator that you can use to help you to evaluate companies. There are a few things I added to the valuation table that I personally use and I will explain what they are.
I added Joel Greenblatt's ROC% because it takes Earnings before Interest and Taxes to reflect more closely what the company earns from its operations, while including the cost of depreciation/amortization of assets. A high double digit figure often means that the company has a defensible edge versus its competitors (e.g. a strong brand or a unique product). It's good for relative valuation (comparing two companies in the same industry).
I also added Donald Yacktman's forward rate of return. Yacktman defines forward rate of return as the normalized free cash flow yield plus real growth plus inflation . Unlike the Earnings Yield %, the Forward Rate of Return uses the normalized Free Cash Flow of the past seven years, and considers growth. The forward rate of return can be thought of as the return that investors buying the stock today can expect from it in the future. Yacktman’s Forward Rate of Return may or may not be a useful metric. However, it does present new ways to see and think about stocks we may want to buy.
I added a box called "real price" and that is from Peter Lynch's book, "One Up on Wall Street," where he talked about how the real price of the stock is really the current price - Net Cash Per Share.
I would also personally pair this script with TradingView's built in financial indicators that shows the revenue growth, net income, etc.
Note: the script only works on the weekly timeframe and it will take some time to load because it has a lot of data.
Valuation

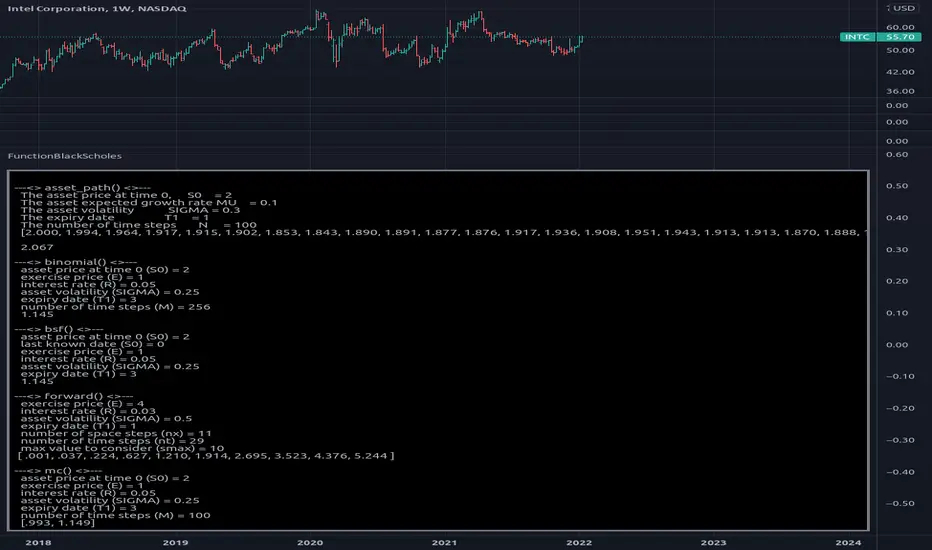
FunctionBlackScholesLibrary "FunctionBlackScholes"
Some methods for the Black Scholes Options Model, which demonstrates several approaches to the valuation of a European call.
// reference:
// people.math.sc.edu
// people.math.sc.edu
asset_path(s0, mu, sigma, t1, n) Simulates the behavior of an asset price over time.
Parameters:
s0 : float, asset price at time 0.
mu : float, growth rate.
sigma : float, volatility.
t1 : float, time to expiry date.
n : int, time steps to expiry date.
Returns: option values at each equal timed step (0 -> t1)
binomial(s0, e, r, sigma, t1, m) Uses the binomial method for a European call.
Parameters:
s0 : float, asset price at time 0.
e : float, exercise price.
r : float, interest rate.
sigma : float, volatility.
t1 : float, time to expiry date.
m : int, time steps to expiry date.
Returns: option value at time 0.
bsf(s0, t0, e, r, sigma, t1) Evaluates the Black-Scholes formula for a European call.
Parameters:
s0 : float, asset price at time 0.
t0 : float, time at which the price is known.
e : float, exercise price.
r : float, interest rate.
sigma : float, volatility.
t1 : float, time to expiry date.
Returns: option value at time 0.
forward(e, r, sigma, t1, nx, nt, smax) Forward difference method to value a European call option.
Parameters:
e : float, exercise price.
r : float, interest rate.
sigma : float, volatility.
t1 : float, time to expiry date.
nx : int, number of space steps in interval (0, L).
nt : int, number of time steps.
smax : float, maximum value of S to consider.
Returns: option values for the european call, float array of size ((nx-1) * (nt+1)).
mc(s0, e, r, sigma, t1, m) Uses Monte Carlo valuation on a European call.
Parameters:
s0 : float, asset price at time 0.
e : float, exercise price.
r : float, interest rate.
sigma : float, volatility.
t1 : float, time to expiry date.
m : int, time steps to expiry date.
Returns: confidence interval for the estimated range of valuation.
ROE ValuationAn indicator that can be used to study ROE Valuation for stocks.
Red color means the market price is higher than the valuation whereas green color means the market price is below the valuation and it might be a good opportunity for value traders. Gray color indicates non-applicable results, when valuation is below zero for example.

PE ValuationAn indicator that can be used to study PE Valuation for stocks.
When the reported EPS for a company is non-positive the line turns gray. Red color means the market price is higher than the valuation whereas green color means the market price is below the valuation and it might be a good opportunity for value traders.

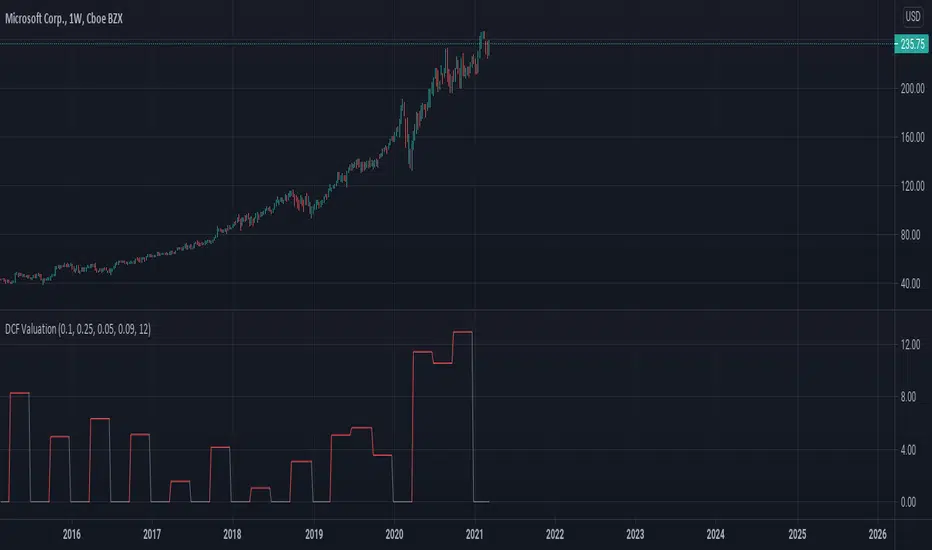
DCF ValuationAn indicator that can be used to study Discounted Cash Flow Valuation for stocks.
When the reported Free Cash Flow for a company is non-positive the line turns gray. Red color means the market price is higher than the valuation whereas green color means the market price is below the valuation and it might be a good opportunity for value traders.
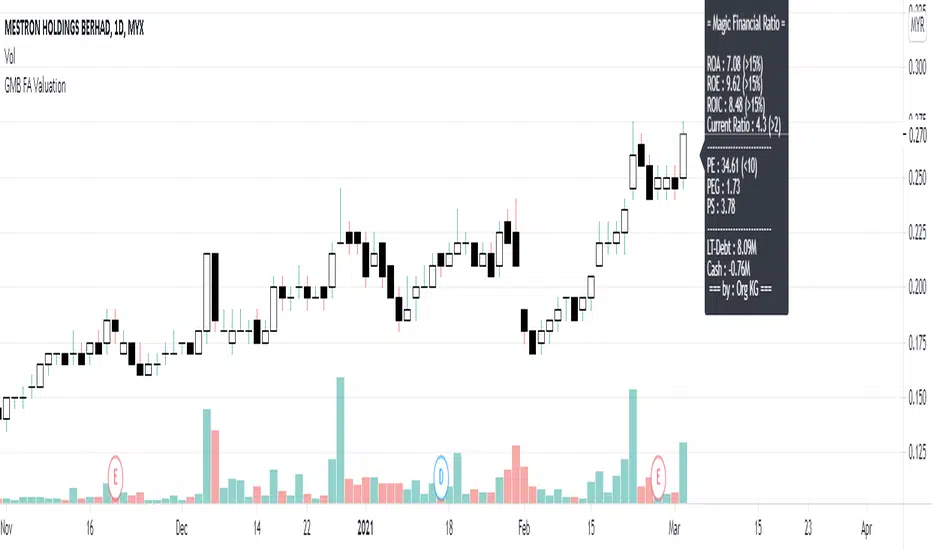
FA Valuation DashboardSimple Financial Ratio for investor.
User can insert CAGR value for PEG ratio.
UCSgears_Transaction Valuation IndexHere is the Version 2 of the TVI indicator posted earlier.
This is inspired from the Value Charts Indicator.
Version 1

UCSgears_Transaction Valuation IndexThis is an indicator, That works great in a wip-saw market range. Would not use this to trade in a breakout.
I am calling it the "Transaction Value Index (UCS_TVI)", The reason is because, it measure where the price currently from the mean trade value.
The cross represents the highest trade value on that day, circle represents the lowest trade value.
In other words, Top and bottom of the candle wicks, in relation to the mean trade value (MTV).
Watchout for Further Updates on Optimizing this indicator.
DO NOT CONFUSE IT WITH FUNDAMENTAL VALUATION, THIS IS PURELY TECHNICAL VALUATION TECHNIQUE
As Usual, Good Luck
List of All my Indicators - www.tradingview.com
