Market Internals: VolumeThe indicator plots the total volume of the NYSE and NASDAQ exchanges and identifies periods with significant asymmetry between Up Volume and Down Volume. It can be used as an additional tool to confirm broad market sentiment.
Chart shows Total Volume (TVOL) bars for SPY daily chart. Green bars for UVOL>>DVOL, Red for DVOL>>UVOL. Neutral bars are gray. Blue line shows median TVOL.
Rationale:
Up Volume (UVOL) and Down Volume (DVOL) represent the total volume of stocks that have increased or decreased in price, respectively, compared to the previous session's closing price. The magnitude of the price change is irrelevant.
When UVOL is significantly higher than DVOL, it indicates a prevailing buying sentiment in the broad market. Conversely, when DVOL is higher, it signals prevailing selling sentiment.
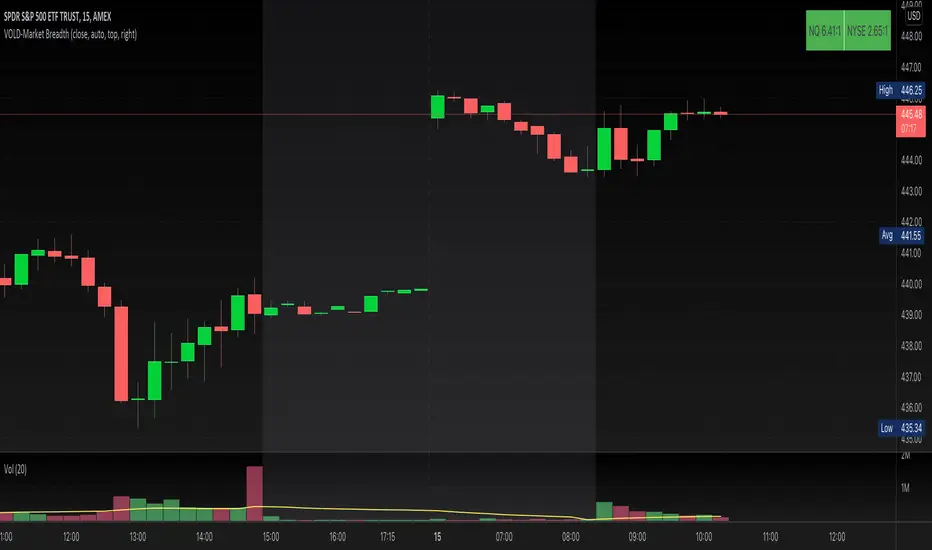
Occasionally, the UVOL/DVOL (VOLD) ratio may be misaligned with the movement of the S&P index. The picture below illustrates an example of a day when the S&P declined, yet the UVOL was twice larger than DVOL. Such a divergence can suggest that the S&P was pulled down by a decline in a few large-cap stocks, while the broader market remained positive. In this case, the divergence led to a continuation of the rally.
Thus, VOLD, when combined with volume analysis, can be an effective tool for confirming market trends.
Parameters:
VOLD Ratio – minimum ratio of UVOL/DVOL or DVOL/UVOL. Indicator will color code volume columns when condition is true (“green” means buying; “red” selling).
Median Length – number of periods to calculate median TVOL.
Show Divergencies – indicator marks divergencies between price and volume sentiments on the main chart. Only works for SPY chart.
Users can also choose which exchanges (NASDAQ/NYSE) to use for volume calculation.
Notes:
Volume is shown in millions of contracts
Indicator should be used on the daily or higher timeframes. It won't work properly on the intraday charts
Disclaimer
This indicator should not be used as a standalone tool to make trading decisions but only in conjunction with other technical analysis methods.
VOLD

4C NYSE Market Breadth RatioThe NYSE Market Breadth Ratio is considered by some to be the “king” of market internals. It lets you know instantly how strong current buying or selling pressure is in the broad market, to eliminate guessing or opinion.
This indicator plots the Market Breadth Ratio values for the NYSE and the NASD exchanges in real time.
It also plots the NYSE Market Breadth Ratio in a histogram plot for visual reference.
The indicator dynamically changes colors between green and red depending on whether breadth is currently positive or negative.
This indicator divides the 'Up-Volume' ("UVOL") by 'Down-Volume' ("DVOL"), for each exchange.
It can be added to any chart, but is incredibly useful when added to other sources of market internals like the NYSE Advancers/Decliners Difference (ticker ADD) or with the NYSE UVOL / DVOL Difference (ticker VOLD ).
Credit goes to author=@auron9000 as the bulk of this code was from their Breadth Ratio Bubbles indicator.
---> The changes made to their indicator include: bug fixes where the values werent properly updating; fixed indicator to be a separate plot (not chart overlay), and added the histogram plot.

VOLD-MarketBreadth-RatioThis script provides NASDAQ and NYSE Up Volume (volume in rising stocks) and Down Volume (volume in falling stocks) ratio. Up Volume is higher than Down Volume, then you would see green label with ratio e.g 3.5:1. This means Up Volume is 3.5 times higher than Down Volume - Positive Market Breadth. If Down Volume is higher than Up Volume, then you would see red label with ratio e.g -4.5:1. This means Down Volume is 4.5 times higher than Up Volume.
For example, ratio is 1:1, then it is considered Market Breadth is Neutral.
PS: Currently TradingView provides only NASDAQ Composite Market volume data. I have requested them to provide Primary NASDAQ volume data. If they respond with new ticket for primary NQ data, I will update the script and publish the updated version. So if you have got similar table on ToS, you would see minor difference in NQ ratio.
NYSE Volume UP FLOW VS Down FLOW ULTIMATE VOLDNYSE Volume UP FLOW VS Down FLOW ULTIMATE StokedStocks
BASED OFF THE VOLD INDEX
The VOLD (also $VOLD) is the difference between the up volume and down volume on the NYSE. i.e. NYSE $UVOL minus $DVOL; the net up volume.
If you consider that VOLD is the net value between UVOL (up volume) and DVOL (down volume) then you need to understand these two to understand VOLD.
UVOL or DVOL are a total of the volume on all stocks that are up or down in price. Up or down is based on the previous session's closing price. The size of the stock's price change is irrelevant.
If the stock is up only $.01, then its volume is grouped into the UVOL total. If that stock's price then drops by $.02 it will be down $.01 and the day's volume for that stock will now be grouped with the DVOL total.
Note that when a stock moves from being an up stock to a down stock its volume will be removed from the UVOL total and added to the DVOL total. Say the stocks volume is 1 million shares when it moves from up to down. The DVOL will increase by 1 million and the UVOL will decrease by 1 million which means that VOLD will decrease by 2 million.
NYSE Up/Down Volume Ratio is often used as a barometer for stocks trading on all U.S. Exchanges even though it is calculated based on stocks listed on the New York Stock Exchange.
NYSE Up/Down ratio represents the volume of NYSE stocks that are advancing divided by the volume of declining stocks.
The volume of advancing stocks or upside volume is the sum of the volume or the number of shares traded associated with stocks that closed higher.
The downside volume is the total number of shares traded that are associated with stocks that closed lower.
The interpretation of the NYSE Up/Down ratio is rather simple. A value higher than one indicates that there is more volume associated with up stocks than with down stocks and it is usually interpreted as a bullish signal.
Obviously, a bearish signal occurs when the NYSE Up/Down ratio is lower than one, which tells us that there are more volume associated with down stocks than with up stocks.
Check out my other indicators and website stokedstocks.wordpress.com for tons of free stock training books and pictures and settings

Market Internals [Makit0] MARKET INTERNALS INDICATOR v0.5beta
Market Internals are suitable for day trade equity indices, named SPY or /ES, please do your own research about what they are and how to use them
This scripts plots the NYSE market internals charts as an indicator for an easy and full visualization of market internal structure all in one chart, useful for SPY and /ES trading
Description of the Market Internals
- TICK: NYSE stocks ticking up vs stocks ticking down, extreme values may point to trend continuation on trending days or reversal in non trending days, example of extreme values can be 800 and 1000
- ADD: NYSE stocks going up vs stocks going down, if price auctions around the zero line may be a non trend day, otherwise may be a trend day
- VOLD: NYSE volume of stocks up vs volume of stocks going down, identify clearly where the volume is going, as example if volume is flowing down may be a good idea no to place longs
- TRIN: NYSE up stocks vs down stocks ratio divided by up volume vs down volume ratio. A value of 1 indicates parity, below that the strength is on the long side, above the strength is in the short side.
A basic use of market internals may be looking for divergences, for example:
- /ES is trading in a range but ADD and VOLD are trending up nonstop, may /ES will break the range to the upside
- /ES is trading in a range and ADD and VOLD are trading around the zero line but got an extreme reading on TICK, may be a non trending day and the TICK extreme reading is at one of the extremes of the /ES range, may be a good probability trade to fade that move
- /ES is trading in a trend to the downside, ADD and VOLD too, you catch a good portion of the move but are fearful to flat and miss more gains, you see in the TICK a lot of extreme values below -800 so your're confident in the continuation of the downtrend, until the TICK goes beyond -1000 and you use that signal to go flat
Market internals give you context and confirmation, price in /ES may be trending but if market internals do not confirm the move may a reversal is on its way
Price is an advertise, you can see the real move in the structure below, in the behavior of the individual components of the market, those are the real questions:
- How many stocks are going up/down (ADD)
- How many volume is flowing up/down (VOLD)
- How many stocks are ticking up/down (TICK)
- What is the overall volume breath of the market (TRIN)
FEATURES:
- Plot one of the four basic market internal indices: TICK, ADD, VOLD and TRIN
- Show labels with values beyond an user defined threshold
- Show ZERO line
- Show user defined Dotted and Dashed lines
- Show user defined moving average
SETTINGS:
- Market internal: ticker to plot in the indicator, four options to choose from (TICK, ADD, VOLD and TRIN)
- Labels threshold: all values beyond this will be ploted as labels
- Dot lines at: two dotted lines will be plotted at this value above and below the zero line
- Dash lines at: two dashed lines will be plotted at this value above and below the zero line
- MA type: two options avaiable SMA (Simple Moving Average) or EMA (Exponential Moving Average)
- MA length: number of bars to calculate the moving average
- Show zero line: show or hide zero line
- Show dot line: show or hide dotted lines
- Show dash line: show or hide dashed lines
- Show labels: show or hide labels
GOOD LUCK AND HAPPY TRADING
