Multi-Timeframe VWAP V2 MODQuick and dirty mod of this script in order to fit my needs.
Added one custom session
More user friendly (Enable/disable through inputs menu)
Volumepriceanalysis

Klinger Volume OscillatorThis indicator was originally developed by Stephen J. Klinger (Stocks & Commodities, V.15:12 (December, 1997): "Identifying Trends with Volume Analysis").
NOTE : this is the only correct version of Klinger Volume Oscillator in the public library.
Like and follow for more open source indicators!
Happy Trading!

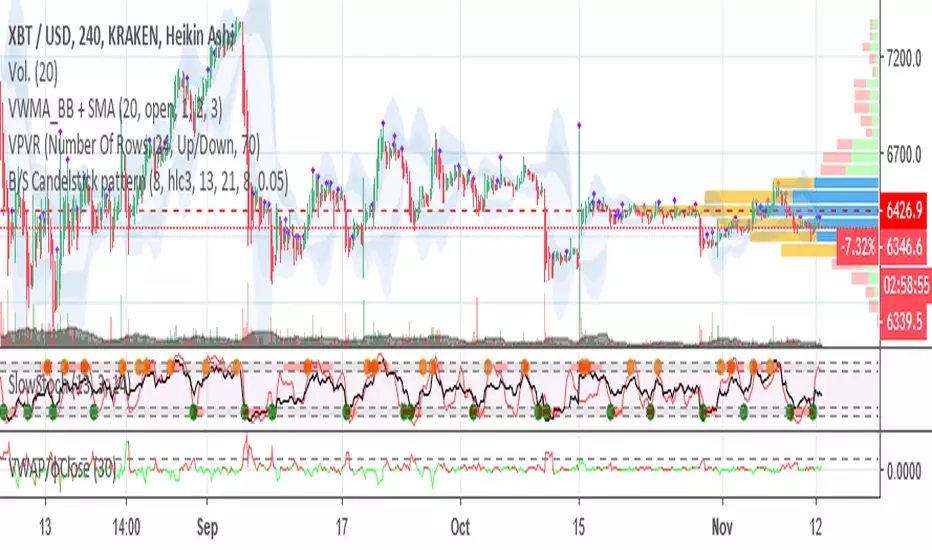
VWAP/CloseHey!
This time I'm going to introduce you to an indicator which catches volume spikes and its respect price change, to give an idea of the following price action.
The logic is pretty simple:
Value > 1 : High Volume that changed a lot the price, next price action will follow that trend.
Value < 1 : Low volume that changed a lot the price, trend is weak.
Value = 1 : Volume and price change is balanced, trend would continue based on the previous values.
If you have any doubt just comment!
φ

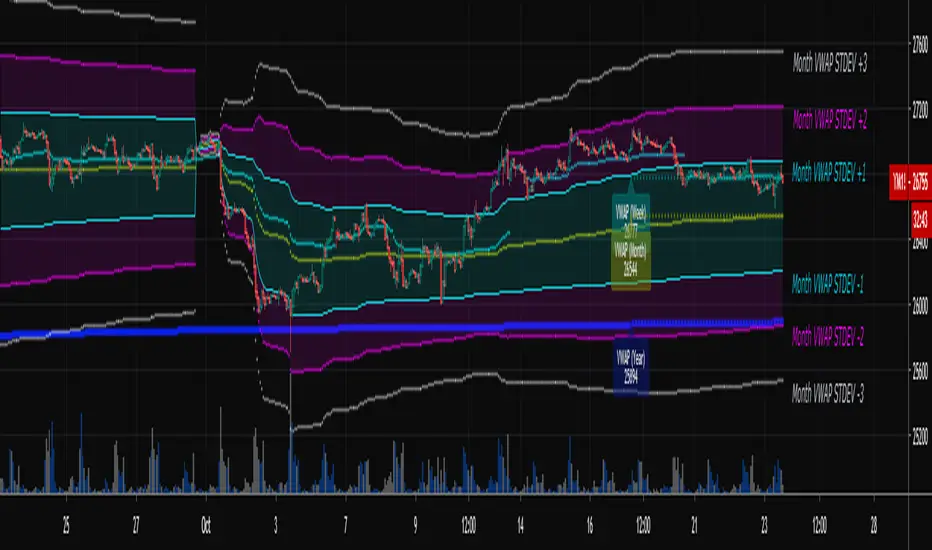
Multi-Timeframe VWAPShows the Daily, Weekly, Monthly, Quarterly, and Yearly VWAP.
Also shows the previous closing VWAP, which is usually very near the HLC3 standard pivot for the previous time frame. i.e. The previous daily VWAP closing price is usually near the current Daily Pivot. Tickers interact well with the previous Daily and Weekly closing VWAP.
Enabling the STDEV bands shows 3 separate standard deviation levels, defaulted at 1, 2, and 3. The lookback period for the bands is always changing with each new bar, since the standard deviation is calculated from the current bar to the beginning of the period. This is different from bollinger bands, as the lookback is constant (usually 20 periods is the textbook default).
The STDEV bands interval of interest can be changed from Day (D), Week (W), Month (M), Quarter (Q), Year (Y).
Tickers tend to bounce very well on Daily, Weekly, and Yearly VWAP (Yes... Year). Use this code and observe the Year VWAP on several major symbols through the past few years and eyes will be opened.
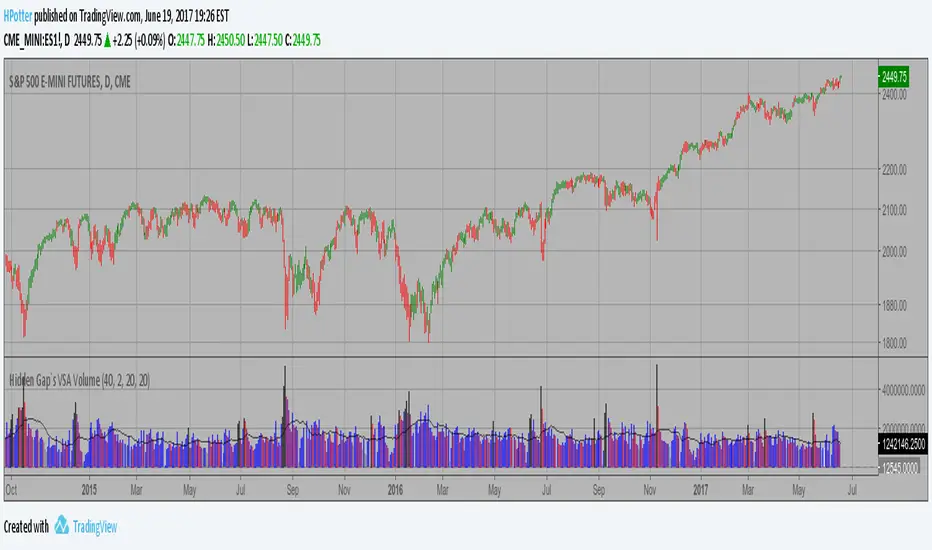
Hidden Gap`s VSA Volume If Volume is less then the previous 20 intervals, Volume is gray.
If Volume is greater then the previous 40 intervals, Volume is black.
If Volume is less then the previous 2 intervals, Volume is purple.
If Volume is less then the previous, Volume is red.
If Volume is greater then the previous, Volume is blue.
Other - white.
You can add on the indicator a 2.5 Standart Deviation of a 20 period
Bollinger Band Shifted 3 periods forward.
Advance-Decline Volume Percent Backtest Advance-Decline Volume Percent (AD Volume Percent) is a breadth indicator
that measures the percentage of Net Advancing Volume for a particular group
of stocks, such as an index or ETF. Net Advancing Volume equals the volume
of advances less the volume of declines. AD Volume Percent equals Net Advancing
Volume divided by total volume for the group. AD Volume Percent fluctuates
between -100% and +100%.
You can change long to short in the Input Settings
Please, use it only for learning or paper trading. Do not for real trading

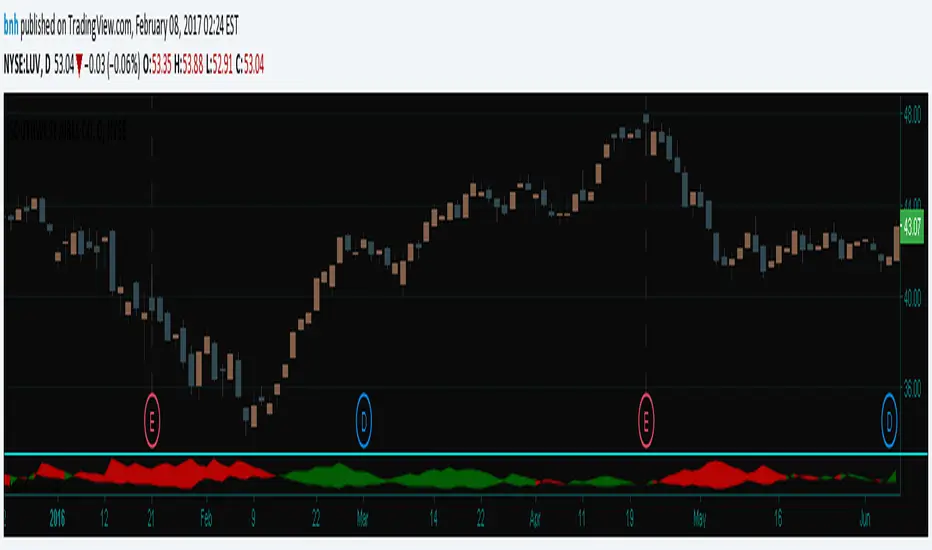
Hersheys Volume Pressure v2Hersheys Volume Pressure gives you very nice confirmation of trend starts and stops using volume and price.
For up bars...
If you have a large price change with low volume , that's very bullish .
If you have a small price change with low volume , that's bullish .
For down bars...
If you have a large price change with low volume , that's very bearish .
If you have a small price change with low volume , that's bearish .
Look at the chart and you'll see how trends start and end with a PINCH and widen in the middle of the moves.
You can set the moving average period, 14 is the default.
Good trading!
Brian Hershey
v2 change log...
- issue with price gaps - gaps at the open were sometimes showing incorrect colors
- scaling issues - sometimes a change is so large it scales down all nearby data and renders it hard to view. Code was added to clip those huge values.
v3 what's coming next...
- better scaling - sometimes with thinly traded stocks there is too much clipping. For now increase the chart interval to correct.

Hersheys Volume Pressure v1Hersheys Volume Pressure gives you very nice confirmation of trend starts and stops using volume and price.
For up bars...
If you have a large price range with low volume, that's very bullish.
If you have a small price range with low volume, that's bullish.
For down bars...
If you have a large price range with low volume, that's very bearish.
If you have a small price range with low volume, that's bearish.
Look at the chart and you'll see how trends start and end with a PINCH and widen in the middle of the moves.
Hersheys Volume Pressure is unique, in that it measures bull/bear pressure on each bar by itself. Other volume indicators like On Balnce Volume and Price Volume Trend use cumulative differences in the current and previous bar to show trends.
You can set the moving average period, 14 is the default.
Good trading!
Brian Hershey
cooltoyz: Volume Delta RealTime v1.0This is a tool, shows the volume variation % strength related to the X past candles.
The current candle is shown in real time, until candle closes.
The visualization of the candle time to close is a thin line, that is 100% for all past candles and slowly goes up for the current candle.
Best with an example:
with a 4h candle, 1 hour has wasted already. This is 25% of all the candle time. So, if volume is also at 25% of the last candles traded, we can expect(yeah, you wish) that by candle close, around 100% of the last volumes average will be traded.
Or two:
in a 4h candle, we're at 10mins., around 8% of total candle time. If volume traded is already at 57% of average past volumes, something big is going on.
Note 1: in the indicator's "Format" pop-up there is a "candle minutes" field, it MUST match the chart timeframe in minutes (ex: 4h=240min)
Note 2: the back volume function check can be switched between the methods "highest value" or "average", in the Format->inputs
Note 3: when a new candle opens, it will go craaayeeezeee!!, because the extreme small values introduce a lot of rounding errors. just let it go, it calms it self after ~0.5% of candle time has passed.
There are more examples and details in the early version of this indicator, check my published scripts.

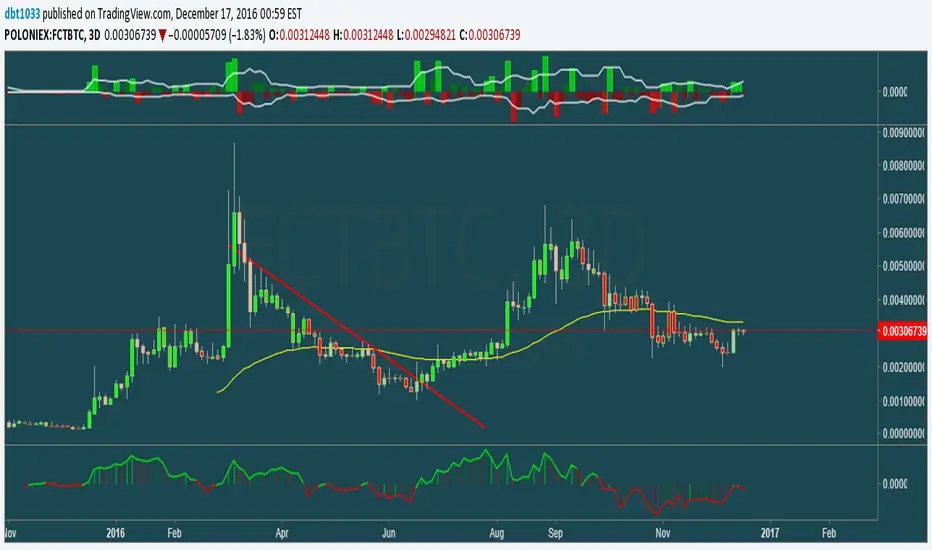
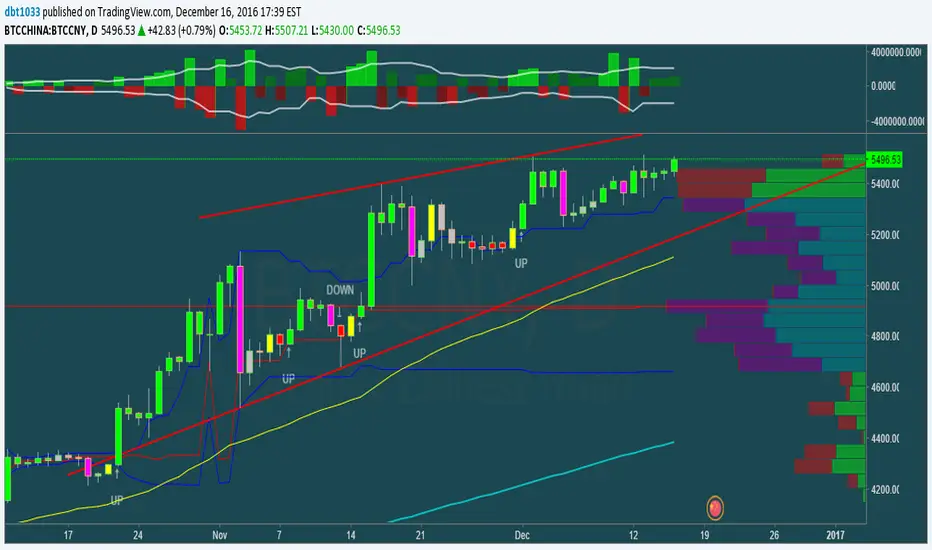
Pump_Doctor Trends**You must enable bar colors in the options for the script if you wish to see them**
This indicator is very useful for spotting trends / tops / bottoms.
This is the ultimate altcoin pump spotting tool. Use on higher timeframes for greatest accuracy. If altcoin is newish (ZEC for example), try 4h rather than 1D or 3D.
Green = Uptrend
Red = Downtrend
Gray = Top/local top, bottom/local bottom, or continuation. You will need some knowledge of price action to determine which condition applies.
You can use the oscillator at the bottom as a measure of momentum / trend strength. You can draw trendlines on the oscillator on the top/bottom or the interior.
1337 VolumeThis volume indicator gives you a unique perspective and ability to analyze volume in any market. The upper line that is always >=0 represents average up volume over a user definable period while the lower line that is always <= 0 represents the average down volume over a user definable period.
green == bullish candle but volume lower than average
lime == bullish candle with above average volume
crimson == bearish candle with below average volume
red == bearish candle with above average volume
This indicator is very useful for spotting bottoms / tops (do a visual backtest and observe its behavior) as well as entry opportunities.
By default, the lookback period for average volume is 7, but I encourage you to change this value in order to find settings that work best for your particular market.
If you have any feedback or ideas for improvement, please comment.
Enjoy :D
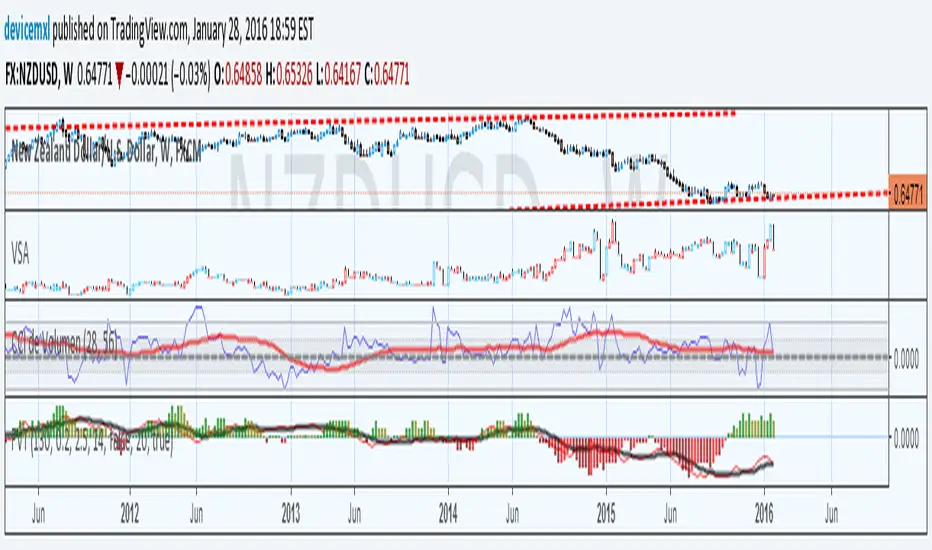
Volume Price Spread Analysis 2With the same idea of the VPSA i make the VPSA2 to make Heiken Ashi style synthetic graph of the price and the volume effect, its easy to see the volume trends. Each instrument have a more clear time frame to see the volume patterns.
I see very useful like a secondary analysis layer. in the graph show the same RSI with price and VPSA2 like source.
Can use others indicators over the VPSA, only write in CAPITAL letters open, high, low, close or hl2 at inputs section.
Ideas, corrections & comments.
They are always welcome.

Volume Price Spread AnalysisWith the same idea of the VSA i make the VPSA to make synthetic graph of the price and the volume effect, its easy to see the volume trends. Each instrument have a more clear time frame to see the volume patterns.
Can use others indicators over the VPSA, only write in CAPITAL letters open, high, low, close or hl2 at inputs section.

Colored Volume Bars standard deviation from meanThe colour bars:
Green: Price up - Volume > 2 x STD of last 21 bars
Blue: Price up - Volume > 1 x STD of last 21 bars
Maroon: Price down - Volume > 2 x STD of last 21 bars
Purple: Price down - Volume > 1 x STD of last 21 bars
Grey: not high volume bar
Green line: 2 bar sma
Red line: 8 period sma of the greenline
Bollinger band: 55 period sma of the 21 period sma with bands 1.618 deviation from the mean


Volume CCIHere simply calculate the CCI of the volume, this will use to measure the strength of the trend of the volume
Background:
I think the volume as the price could be represented by candles or other graphic to use indicators and strengthen their analysis, due to lack of registration of this it is first necessary to calculate a volume graph, if the candle traditionally negative price brand then the total volume is taken as negative for the period. An example of this is in the On Balance Volume indicator, the problem is that there is no way to analyze the volume using other methods. An approximate volume of the spread could be the use of the price spread to make a synthetic behavior
As traditionally is observed if Open> Close then the candle and the volume will be negative and vice versa; the next step, is estimate the amounts of the candle necessary to calculate the ratio to use for the volume and thus idealize their spread within the candle:
VLOW = Volume x Low
vHigh = x High Volume
VOpen = vClose
vClose = Volume x Close
This graph can show a stable synthetic form of fluctuations in the volume trend affected by price.
ideas, comments and suggestions (or corrections).They are always welcome

Propagation Volumes and TrendsWith this, i calculate RSI of the HL2 of the volume and use like an oscillator, this will use to measure the strength of the trend and the "Volume Flow" to follow the trend.
I use like foundation the LazyBear "Volume Flow Indicator" "honor a quien honor merece"
Background:
I think the volume as the price could be represented by candles or other graphic to use indicators and strengthen their analysis, due to lack of registration of this it is first necessary to calculate a volume graph, if the candle traditionally negative price brand then the total volume is taken as negative for the period. An example of this is in the On Balance Volume indicator, the problem is that there is no way to analyze the volume using other methods. An approximate volume of the spread could be the use of the price spread to make a synthetic behavior
As traditionally is observed if Open> Close then the candle and the volume will be negative and vice versa; the next step, is estimate the amounts of the candle necessary to calculate the ratio to use for the volume and thus idealize their spread within the candle:
VLOW = Volume x Low
vHigh = x High Volume
VOpen = vClose
vClose = Volume x Close
This graph can show a stable synthetic form of fluctuations in the volume trend affected by price.
ideas, comments and suggestions (or corrections).They are always welcome