Volume Sentiment Pro (NTY88)Volume Sentiment Edge: Smart Volume & RSI Trading System
Description:
Unlock the power of volume-driven market psychology combined with precision RSI analysis! This professional-grade indicator identifies high-probability trading opportunities through:
🔥 Key Features
1. Smart Volume Spike Detection
Auto-detects abnormal volume activity with adaptive threshold
Clear spike labels & multi-timeframe confirmation
RSI-Powered Sentiment Analysis
Real-time Bullish/Bearish signals based on RSI extremes
Combined volume-RSI scoring system (Strong Bull/Bear alerts)
2. Professional Dashboard
Instant sentiment status table (bottom-right)
Color-coded momentum strength visualization
Customizable themes for all chart styles
3. Institutional-Grade Tools
HTF (Daily/Weekly) volume confirmation
EMA trend-filtered momentum signals
Spike-to-Threshold ratio monitoring
4. Trade-Ready Alerts
Pre-configured "Bullish Setup" (Spike + Oversold RSI)
"Bearish Setup" (Spike + Overbought RSI)
Why Traders Love This:
✅ Real-Time Visual Alerts - SPIKE markers above bars + table updates
✅ Adaptive Thresholds - Self-adjusting to market volatility
✅ Multi-Timeframe Verification - Avoid false signals with HTF confirmation
✅ Customizable UI - 10+ color settings for perfect chart integration
Usage Scenarios:
Day Traders: Catch volume surges during key sessions
Swing Traders: Confirm reversals with RSI extremes
All Markets: Works equally well on stocks, forex & crypto
Confirmation Tool: Combine with your existing strategy
Sample Setup:
"Enter long when:
5. RED SPIKE label appears
Table shows 'Oversold RSI'
Momentum status turns 'Bullish'
Volume exceeds daily average (Confirmed)"
📈 Try Risk-Free Today!
Perfect for traders who want:
Clean, non-repainting signals
Institutional-level volume analysis
Professional visual feedback
Customizable trading rules
⚠️ Important: Works best on 15m-4h timeframes. Combine with price action for maximum effectiveness.
📜 Legal Disclaimer
By using this indicator, you agree to the following terms:
Not Financial Advice
This tool provides technical analysis only. It does NOT constitute investment advice, financial guidance, or solicitation to trade.
High Risk Warning
Trading financial instruments carries substantial risk. Past performance ≠ future results. Never risk capital you cannot afford to lose.
No Guarantees
Signals are based on historical data and mathematical models. Market conditions may change rapidly, rendering previous patterns ineffective.
User Responsibility
You alone bear 100% responsibility for trading decisions. We expressly disclaim liability for any profit/loss resulting from this tool's use.
Professional Consultation
Always consult a licensed financial advisor before taking positions. This tool should NEVER be used as sole decision-making criteria.
Educational Purpose
This indicator is provided "as is" for informational/educational use only. No representation is made about its accuracy or completeness.
Third-Party Data
We do not verify exchange data accuracy. Use signals at your own discretion after independent verification.
Volumestrength

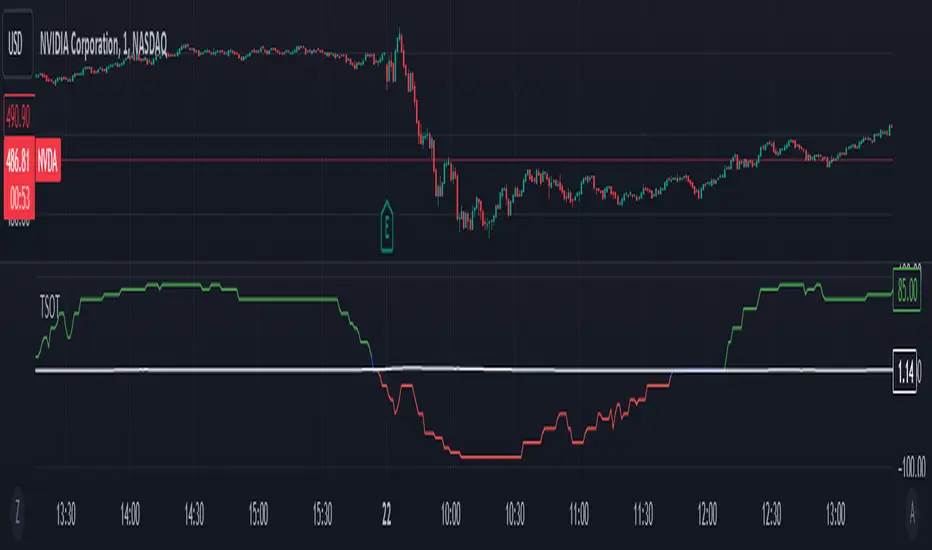
Risk-Adjusted Trend IndicatorThe Risk-Adjusted Trend Indicator is a comprehensive tool designed to evaluate market trends while factoring in risk levels. By combining trend strength, volatility, and dynamic scaling, this indicator provides traders with clear, actionable signals for optimal entries and exits. Its focus on risk-adjusted metrics ensures that signals are both reliable and contextually informed by prevailing market conditions.
Key Features:
1. Exponential Moving Average (EMA):
• The EMA serves as the foundation for trend detection, offering a smoothed representation of price movement over a user-defined period.
• Aids in distinguishing bullish and bearish trends effectively.
2. Average True Range (ATR):
• ATR is used to gauge market volatility, ensuring that the indicator adapts to changing market conditions.
• Facilitates the normalization of trend strength relative to current market volatility.
3. Risk-Adjusted Trend Score:
• Computes the difference between the price and EMA and normalizes it using the ATR to account for risk.
• This metric allows traders to focus on trends with favorable risk-reward ratios, filtering out weak or high-risk setups.
4. Dynamic Scaling:
• Adjusts the risk-adjusted score to fit within the chart’s price range, making the visualization intuitive and easy to interpret.
5. Buy/Sell Signals:
• Buy signals are triggered when the risk-adjusted score crosses above a positive threshold.
• Sell signals are triggered when the score crosses below a negative threshold.
• Signals are plotted directly on the chart with intuitive markers for quick decision-making.
6. Background Color Zones:
• Highlights bullish and bearish trend zones using subtle background shading, enhancing visual clarity.
Reason for Combining These Elements
The Risk-Adjusted Trend Indicator blends elements of trend analysis, volatility measurement, and risk assessment to address a fundamental challenge in trading: identifying high-confidence trades that align with a trader’s risk tolerance. Here’s why these components were chosen and how they work together:
1. EMA (Trend Detection):
• Provides a reliable baseline for trend direction, ensuring that the indicator aligns with the market’s prevailing trend.
2. ATR (Volatility Normalization):
• Adjusts trend strength calculations based on market volatility, allowing the indicator to adapt to varying market conditions and avoid false signals in high-volatility environments.
3. Risk-Adjusted Score:
• By factoring in both trend strength and volatility, this score ensures that only trends with favorable risk-reward dynamics are highlighted.
• This approach minimizes overtrading and reduces exposure to high-risk setups.
4. Dynamic Scaling:
• Ensures that the indicator’s outputs remain visually accessible, regardless of the asset or timeframe being analyzed.
• Enhances usability by aligning the score with price action on the chart.
5. Visual Aids (Signals and Background Zones):
• The inclusion of visual signals and background zones simplifies decision-making, making the tool suitable for both novice and experienced traders.

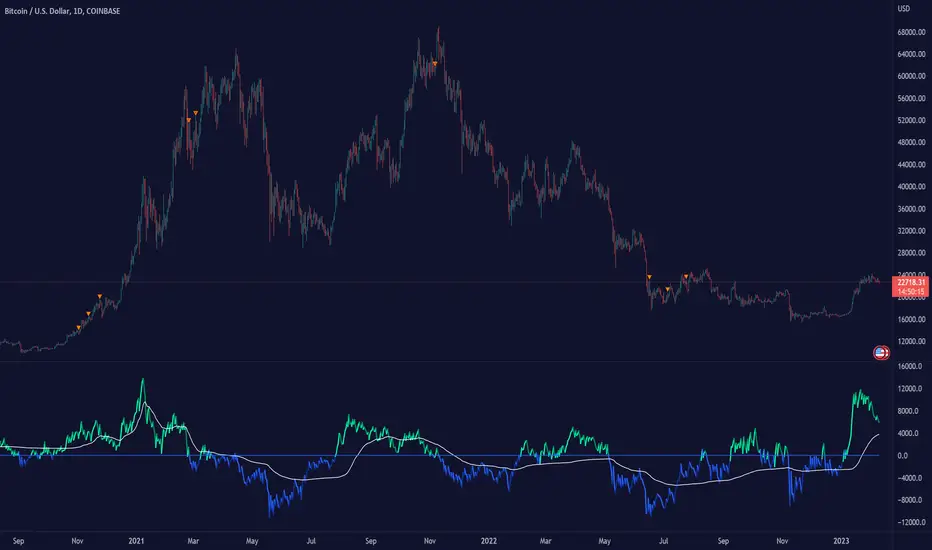
Trend Strength Over TimeThe script serves as an indicator designed to assess and visualize trend strength and Volume strength over time. It employs a variety of calculations and conditions to offer insights into both bullish and bearish market trends. Let's explore the key conceptual elements of the code.
Trend Strength Conditions:
The script defines conditions to assess trend strength based on a comparison between each calculated percentile value and the highest high (bullish) or lowest low (bearish). Separate conditions are established for each percentile length, allowing for a nuanced understanding of trend dynamics across different timeframes.
Counting Bull and Bear Trends:
To quantify the strength of bullish and bearish trends, the script maintains counts for the number of conditions that are true for each. This count-based approach provides a quantitative measure of trend strength.
Weak Bull and Bear Counts:
Recognizing that trends are not always clear-cut, the script introduces the concept of weak trends. It counts instances where the percentiles fall between the highest high and lowest low, indicating a potential weakening of the prevailing trend.
Bull and Bear Strength:
Bull and bear strengths are calculated based on the counts, with adjustments made for weak trends. This step provides a more nuanced and comprehensive assessment of trend strength by considering both strong and weak signals.
Current Trend Value:
The culmination of these calculations is the determination of the current trend value. This value represents the balance between bullish and bearish forces, offering a dynamic indicator of the market's prevailing sentiment.
Volume Strength Calculation:
In addition to price-based indicators, the script incorporates volume strength as a crucial element. This is calculated using the simple moving averages (SMAs) of volume over different lengths, normalized relative to the SMA over a length of 144. Volume strength adds a layer of confirmation or divergence to the price-based trend analysis.
Color Change:
To facilitate quick and intuitive interpretation, the script dynamically changes the color of the plotted line on the chart based on the current trend value. Green indicates a bullish trend, red indicates a bearish trend, and blue suggests a neutral or indecisive market.
Plotting:
The script uses the plot function to visually present the calculated trend strength and volume strength on the chart. This visual representation aids traders in making informed decisions based on the identified trends and their strengths.
Volume Strength: A Detailed Explanation
In the context of the provided script, volume strength is a critical component used to assess the strength of a market trend. It provides insights into the level of participation and commitment of market participants, offering a complementary perspective to traditional price-based indicators. Let's delve into the concept and practical applications of volume strength.
Calculation of Volume Strength:
The script calculates volume strength by considering the simple moving averages (SMAs) of volume over different time periods (13, 21, 34, 55, 89). These individual SMAs are then normalized relative to the SMA over a more extended period of 144. The weights assigned to each SMA in the calculation are defined in the variable VCF (Volume Correction Factor).
Calculation of Volume Strength with Weights: The weights assigned to each SMA in this calculation are crucial for emphasizing the significance of shorter-term volume movements relative to a longer-term baseline.
Interpretation of Weights:
The choice of weights reflects the relative importance of shorter-term volume movements compared to longer-term trends. In this script, shorter-term SMAs (13, 21, 34, 55, 89) are assigned decreasing weights, while the longer-term SMA (144) serves as the baseline.
Shorter-term SMAs with higher weights may have a more immediate impact on the volume strength calculation. This implies that recent changes in volume carry more weight in assessing the current market conditions.
The decreasing weights for shorter-term SMAs might indicate that, as the timeframe lengthens, the significance of recent volume movements diminishes in relation to the longer-term trend. This approach allows for a focus on both short-term volatility and longer-term stability in volume patterns.
The purpose of normalization is to emphasize the current volume's significance in comparison to its historical context. This can help identify abnormal volume spikes or sustained increases in trading activity, which may indicate the strength or weakness of a trend.
Interpretation and Practical Use:
Confirmation of Trend:
Rising volume during an uptrend can validate the strength of the upward movement, suggesting that a significant number of market participants are actively buying. Conversely, decreasing volume during an uptrend might indicate weakening interest and a potential reversal.
In a downtrend, increasing volume on downward price movements reinforces the strength of the trend. A decrease in volume during a downtrend may suggest a potential weakening or exhaustion of the downward momentum.
Divergence Analysis:
Divergence occurs when there is a disagreement between the price movement and the corresponding volume. For example, if prices are rising but volume is declining, it could signal a lack of conviction in the upward movement, and a reversal might be imminent.
Conversely, if prices are falling, but volume is decreasing as well, it might suggest that the downward momentum is losing steam, and a potential reversal or consolidation could be on the horizon.
In conclusion, volume strength analysis provides traders with a powerful tool to gauge the conviction behind price movements. By incorporating volume data into the technical analysis, one can make more informed decisions, enhance trend identification, and improve risk management strategies.
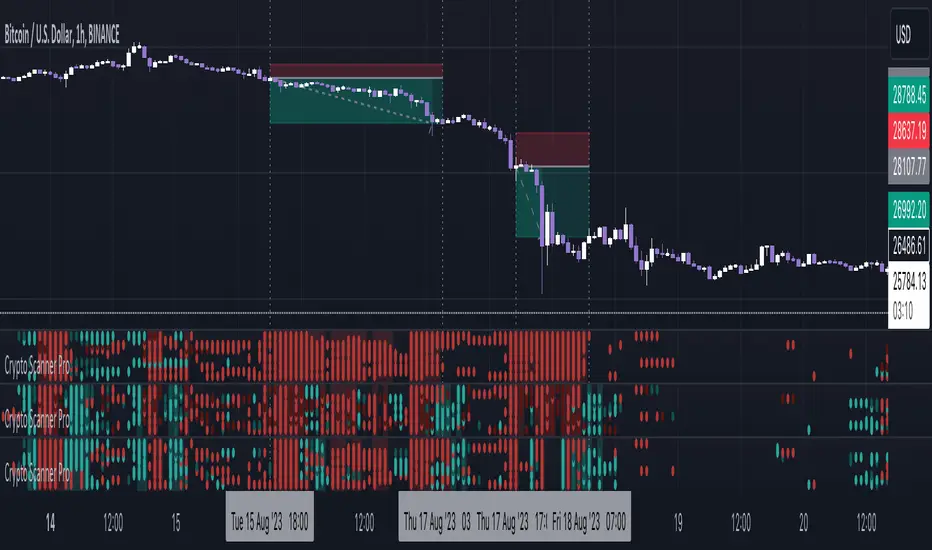
Crypto Scanner Pro [FxScripts]***** FEATURES *****
Crypto Scanner Pro is both an indicator and market scanner combined. The combination allows you to have multiple eyes across the market, all from a single chart.
Each scanner is comprised of an intuitively designed 3-in-1 tool that tracks the key metrics that drive markets.
They each use advanced algorithms to gather information from multiple data points, distilled into one simplified view.
***** TREND SCANNER *****
The Trend Scanner allows you to track price action across the wider market. Instantly see pattern shifts and emerging trends; when the market moves, you can move with it.
***** MOMENTUM SCANNER *****
The Momentum Scanner offers realtime insights into momentum shifts as they occur. This allows you to monitor false breakouts and catch the moves that matter.
***** VOLUME SCANNER *****
The Volume Scanner provides unique indications into where buy and sell volume is being placed. It offers a further way of determining entry and exit points or simply confirmation that a trend is underway.
***** INSTRUMENTS *****
Crypto Scanner Pro works effortlessly with the following large cap coins:
Avalanche, Bitcoin Cash, Bitcoin, BITO, BNB, Cardano, Chainlink, Dogecoin, Ethereum, Litecoin, Polkadot, Polygon, Shiba Inu, Solana, Stellar, Toncoin, XRP (Ripple) *
***** SETTINGS OVERVIEW *****
The scanner features the following customizable settings:
~~ Trend Settings ~~
Trend Filter - adjusting this will allow you to focus on short term trends (most suitable for scalping), medium or long term (best for swing trading).
Countertrend Strength - increases the sensitivity of weaker vs stronger countertrends. As countertrends are trends that run against the main trend, this will assist in detecting the strength of a pullback or reversal and allow you to either hold, exit or reverse the trade with confidence.
~~ Momentum Settings ~~
Momentum Filter - increase or decrease the sensitivity of the momentum scanner. Increase to avoid periods of low or weak momentum, decrease to highlight stronger surges in momentum.
~~ Volume Settings ~~
Volume Filter - increase or decrease the sensitivity of the volume scanner. Increase to avoid periods where buy and sell volume can potentially cancel each other out.
~~ Volatility Settings ~~
Volatility Offset - use this to fine tune the volatility filter. A higher value generally delays the volatility filter allowing for confirmation of stronger trends, a lower value will detect trend, momentum or volume movement sooner but may be less accurate.
Each scanner has its own setting allowing you to adjust how you monitor the underlying volatility for each.
As with all settings, we recommend adjusting this to your style of trading, instrument and timeframe.
~~ Alerts ~~
Alerts can be configured to send notifications when anything from 6-10 bullish or bearish dots are showing. Exit markers can be configured when anything from 2+ dots are revealed. This adds an extra layer of sensitivity for traders who appreciate complete control over their trade.
~~ Display Settings ~~
You have the ability to hide all colored dots and only show the background or, alternatively, hide the background and only show colored dots.
***** TRIAL PERIOD *****
We offer a FREE, no questions asked, 7-day trial with every new registration. Visit the link below to register.
* list subject to change as coins increase or decrease in popularity
Volume Delta (Expo)█ Overview
Volume Delta (Expo) is a trading tool that measures the difference between buying and selling volume in a given market. It is a powerful tool for analyzing volume clusters and price action, as it can help traders identify the direction and strength of the trend as well as potential volume-weighted support and resistance areas.
█ How is the Volume Delta calculated?
Volume Delta is calculated by subtracting the number of contracts traded on the bid from the number of contracts traded on the ask. A positive Volume Delta indicates that more contracts are being traded on the ask than on the bid, which suggests buying pressure. A negative Volume Delta indicates that more contracts are being traded on the bid than on the ask, which suggests selling pressure.
Note, our Volume Delta (Expo) uses intrabar analysis in combination with volume clusters which is a great approximation to calculating volume delta on TradingView. The tool is equipped with a unique volume-weighted cluster function to calculate the delta trend over time as well as a dynamic trend strength calculation.
█ How to Use Volume Delta to Analyze Volume Clusters
Volume clusters are areas of high volume that indicate a potential change in price direction. Once the clusters have been identified, traders can then use Volume Delta to measure the difference between buying and selling volume in the clusters.
If the buying volume is greater than the selling volume, it indicates that the price is likely to move higher. Conversely, if the selling volume is greater than the buying volume, it indicates that the price is likely to move lower.
In addition to measuring the difference between buying and selling volume, traders can also use Volume Delta to analyze price action. By looking at the volume clusters and the corresponding price action, traders can identify potential support and resistance levels.
█ How to use
The volume delta provides insight into market sentiment, as a rise in buying volume on a positive close indicates that bullish sentiment is strengthening, while a rise in selling volume on a negative close indicates that bearish sentiment is increasing. In addition, use volume delta to identify the direction and strength of the trend.
It's common among volume traders to use volume delta to confirm trends, identify reversals, divergences, and volume-weighted support and resistance areas
Volume - divergences
If the volume delta is positive but the price trend is still bearish, it could be an indication that the current trend is weakening and a reversal may be imminent. Similarly, if the volume delta is negative but the price trend is still bullish, it could be an indication that the current trend is weakening and a reversal may be imminent.
█ Indicator Features
In addition to the main Volume Delta feature, the indicator has the following features:
Adaptive or Stability Volume Strength: Choose between adaptive or stability volume strength.
Exhausted Volume bars: Show Exhausted Volume Bars on the chart.
Divergences: Enable Regular and Hidden Volume Divergences
-----------------
Disclaimer
The information contained in my Scripts/Indicators/Ideas/Algos/Systems does not constitute financial advice or a solicitation to buy or sell any securities of any type. I will not accept liability for any loss or damage, including without limitation any loss of profit, which may arise directly or indirectly from the use of or reliance on such information.
All investments involve risk, and the past performance of a security, industry, sector, market, financial product, trading strategy, backtest, or individual's trading does not guarantee future results or returns. Investors are fully responsible for any investment decisions they make. Such decisions should be based solely on an evaluation of their financial circumstances, investment objectives, risk tolerance, and liquidity needs.
My Scripts/Indicators/Ideas/Algos/Systems are only for educational purposes!