Smart Market Matrix Smart Market Matrix
This indicator is designed for intraday, scalping, providing automated detection of price pivots, liquidity traps, and breakout confirmations, along with a context dashboard featuring volatility, trend, and volume.
## Summary Description
### Menu Settings & Their Roles
- **Swing Pivot Strength**: Controls the sensitivity for detecting High/Low pivots.
- **Show Pivot Points**: Toggles the display of HH/LL markers on the chart.
- **VWMA Length for Trap Volume** & **Volume Spike Multiplier**: Identify concentrated volume spikes for liquidity traps.
- **Wick Ratio Threshold** & **Max Body Size Ratio**: Detect candles with disproportionate wicks and small bodies (doji-ish) for traps.
- **ATR Length for Trap**: Measures volatility specific to trap detection.
- **VWMA Length for Breakout Volume**, **ATR Multiplier for Breakout**, **ATR Length for Breakout**, **Min Body/Range Ratio**: Set adaptive breakout thresholds based on volatility and volume.
- **OBV Smooth Length**: Smooths OBV momentum for breakout confirmation.
- **Enable VWAP Filter for Confirmations**: Optionally validate breakouts against the VWAP.
- **Enable Higher-TF Trend Filter** & **Trend Filter Timeframe**: Align breakout signals with the 1h/4h/Daily trend.
- **ADX Length**, **EMA Fast/Slow Length for Context**: Parameters for the context dashboard (Volatility, Trend, Volume).
- **Show Intraday VWAP Line**, **VWAP Line Color/Width**: Display the intraday VWAP line with custom style.
### Signal Interpretation Map
| Signal | Description | Recommended Action |
|--------------------------------|-----------------------------------------------------------|-------------------------------------------|
| 📌 **HH / LL (pivot)** | Market structure (support/resistance) | Note key levels |
| **Bull Trap(green diamond)** | Sweep down + volume spike + wick + rejection | Go long with trend filter
| **Bear Trap(red diamond)** | Sweep up + volume spike + wick + rejection | Go short with trend filter
| 🔵⬆️ **Breakout Confirmed Up** | Close > ATR‑scaled high + volume + OBV↑ | Go long with trend filter |
| 🔵⬇️ **Breakout Confirmed Down** | Close < ATR‑scaled low + volume + OBV↓ | Go short with trend filter |
| 📊 **VWAP Line** | Intraday reference to guide price | Use as dynamic support/resistance |
| ⚡ **Volatility** | ATR ratio High/Med/Low | Adjust position size |
| 📈 **Trend Context** | ADX+EMA Strong/Moderate/Weak | Confirm trend direction |
| 🔍 **Volume Context** | Breakout / Rising / Falling / Calm | Check volume momentum |
*This summary gives you a quick overview of the key settings and how to interpret signals for efficient intraday scalping.*
### Suggested Settings
- **Intraday Scalping (5m–15m)**
- `Swing Pivot Strength = 5`
- `VWMA Length for Trap Volume = 10`, `Volume Spike Multiplier = 1.6`
- `ATR Length for Trap = 7`
- `VWMA Length for Breakout Volume = 12`, `ATR Length for Breakout = 9`, `ATR Multiplier for Breakout = 0.5`
- `Min Body/Range Ratio for Breakout = 0.5`, `OBV Smooth Length = 7`
- `Enable Higher-TF Trend Filter = true` (TF = 60)
- `Show Intraday VWAP Line = true` (Color = orange, Width = 2)
- **Swing Trading (4h–Daily)**
- `Swing Pivot Strength = 10`
- `VWMA Length for Trap Volume = 20`, `Volume Spike Multiplier = 2.0`
- `ATR Length for Trap = 14`
- `VWMA Length for Breakout Volume = 30`, `ATR Length for Breakout = 14`, `ATR Multiplier for Breakout = 0.8`
- `Min Body/Range Ratio for Breakout = 0.7`, `OBV Smooth Length = 14`
- `Enable Higher-TF Trend Filter = true` (TF = D)
- `Show Intraday VWAP Line = false`
*Adjust these values based on the symbol and market volatility for optimal performance.*
Volume

PWWTC Order Blox - Standard Deviation MethodPWWTC Order Blox - Dynamic Support/Resistance Zones
Proprietary Volatility-Weighted Zone Identification
Overview:
This indicator identifies statistically significant price zones that tend to act as support/resistance levels. The strength of these zones is automatically classified into three confidence levels:
🔴 Red Zones - Strongest conviction areas (rare, high-signal events)
🟡 Yellow Zones - Significant but less frequent than red
🟢 Green Zones - Common but still relevant technical levels
Key Features:
1. Dynamic Zone Strength Classification
- Automatically ranks zones based on market volatility and trading activity
- Stronger colors indicate higher confidence levels in zone significance
2. Adaptive Channel Generation
- Projects potential reaction areas using multiple time perspectives
- Channels automatically adjust to current market conditions
3. Volume Confirmation (Optional)
- Includes filter to only show zones accompanied by unusual trading activity
4. Smart Alert System
- Get notified when new high-confidence zones form
- Priority alerting for red zones (most significant)
How to Use:
1. Apply to any chart (works across all markets/timeframes)
2. Watch for colored zones to form at potential reversal areas
3. Stronger color = Higher likelihood of price reaction
4. Use in conjunction with:
- Trend confirmation indicators
- Price action patterns
- Volume analysis
Settings:
- Adjust lookback periods for sensitivity
- Customize alert thresholds
- Modify color transparency/visibility
Note: Proprietary volatility-based calculations drive zone identification. While the exact methodology remains protected, the output reflects areas where institutional order flow is likely to create price reactions.
Alerts Supported:
- New Red Zone Formation (Highest Priority)
- New Yellow Zone Formation
- New Green Zone Formation

Volume USDTName:
USDT Volume Bars (Directional Colors)
Description:
This indicator visualizes trading volume in USDT by multiplying the candle's volume by the average of its open and close prices. The result reflects a more realistic estimation of the traded value per candle.
🟩 Green bars: Bullish or neutral candles (close ≥ open)
🟥 Red bars: Bearish candles (close < open)
Useful for spotting high-value inflows and outflows based on actual price-weighted volume.

Jinsu RSI 14### 🔍 **Jinsu RSI 14 – EMA 9 & WMA 45**
**Description:**
This custom indicator combines the classic RSI (Relative Strength Index) with two moving averages — EMA (Exponential Moving Average) and WMA (Weighted Moving Average) — applied directly to the RSI value to provide more nuanced momentum signals.
### 📊 **How It Works**
- **RSI 14** measures market momentum and identifies overbought (above 70) or oversold (below 30) conditions.
- **EMA 9 on RSI** responds quickly to short-term changes, signaling momentum shifts.
- **WMA 45 on RSI** captures long-term sentiment, while placing more emphasis on recent data.
### 🧠 **Signal Interpretation**
- **RSI crosses above EMA 9** → Possible bullish momentum shift.
- **RSI falls below EMA 9** → Possible bearish momentum shift.
- **EMA 9 crosses above WMA 45** → Strong bullish momentum.
- **EMA 9 falls below WMA 45** → Strong bearish momentum.
- **RSI is between EMA 9 & WMA 45** → Market may be consolidating or oscillating.
### 🎨 **Visual Enhancement**
- The neutral zone (RSI between 30–70) is lightly shaded purple to reduce visual noise.
- When **RSI > 70**, a green color appears and intensifies with higher RSI values, highlighting strong buying pressure.
- All values are displayed with two decimal precision for clarity.
This tool is ideal for trend-following traders and momentum-based strategies, helping you recognize early shifts in market sentiment with visual cues and cross confirmations.

Price Map Profile [BigBeluga]An advanced volume-based tool designed to map out how trading activity is distributed across price levels. It combines dynamic volume profiling with structural pivot detection to highlight key levels of interest in the market — including hidden support/resistance zones and dominant liquidity areas.
Unlike traditional volume profiles locked to fixed sessions, this indicator continuously processes historical bars to build a real-time "map" of volume distribution. It intelligently reveals where buyers and sellers were most active, helping traders pinpoint high-impact zones with clarity.
🔵 KEY FEATURES
Creates a volume map profile by scanning price action over a defined lookback window (`length`).
Divides price vertically into volume bins (default: 100) and aggregates either total volume or bar count per bin.
Bins are plotted as horizontal zones extending to the right of the chart — wider offset means more volume at that price.
Each zone is color-coded using gradients to represent volume magnitude:
- Below average volume = cool tones (blue/teal)
- Above average volume = warm tones (red/orange)
The highest volume bin is highlighted with a red label showing the exact volume, helping to identify strong price agreement.
Detects pivot highs and lows using a 15-bar swing method, marking them as potential S/R levels.
If a pivot level is located inside a low-volume zone (volume < average), it is emphasized with a dashed line and label .
Pivot line color matches direction:
- High pivots = yellow
- Low pivots = aqua
The volume of the bin containing the pivot is shown alongside the pivot, providing volume context for the structural level.
Filters out nearby duplicate pivots using ATR-based distance checks to ensure clean and non-redundant signals.
🔵 HOW TO USE
Use the wide red zones as liquidity and consolidation areas where price may stall, reverse, or absorb volume.
Pivot-based dashed lines within low-volume zones highlight hidden support/resistance levels where price may react sharply.
Combine this indicator with trend or order flow tools to validate reversal or breakout setups .
Switch between Volume and Frequency modes to adapt to the type of data your asset provides.
🔵 CONCLUSION
The Price Map Profile transforms raw volume into an actionable visual map. By aligning volume depth with key market structure levels, it helps traders identify where market participants are most active — and where hidden inefficiencies lie. Ideal for traders seeking precision entries, dynamic S/R zones, and deeper volume structure insight.

Amihud Liquidity RatioCalculates liquidity as a sort of moving average over time
The Amihud Illiquidity Ratio (ILLIQ) measures the price impact of trading volume. It's calculated as the absolute daily return divided by the daily dollar volume:
𝐼𝐿𝐿𝐼𝑄ₜ = |𝑅ₜ| / 𝑉𝑂𝐿𝐷ₜ
Where:
|𝑅ₜ| is the absolute value on return day t
𝑉𝑂𝐿𝐷ₜ is the dollar trading volume on day t
Here's how you can incorporate this indicator into your analysis:
1. Identifying Liquidity Regimes:
High Liquidity (Low Indicator Values): When the indicator is consistently low, it suggests a market or asset where it's generally easier to enter and exit positions without significant slippage. This might be a more favorable environment for strategies that rely on tight spreads and efficient order execution.
Low Liquidity (High Indicator Values): When the indicator is consistently high or spiking, it signals periods of lower liquidity. This can lead to:
Increased Volatility: Fewer participants and larger bid-ask spreads can amplify price movements.
Higher Slippage: Executing large orders might result in getting a worse price than expected.
Gap Risk: Significant price gaps can occur between trading sessions due to a lack of continuous trading interest.
---------------------------------------------------------------------------------------------------------------------
2. Confirming Trends and Breakouts:
Trend Confirmation:
Uptrend with Increasing Liquidity (Falling Amihud): A healthy uptrend often sees increasing participation and ease of trading. A falling Amihud during an uptrend can provide confidence in the trend's sustainability.
Uptrend with Decreasing Liquidity (Rising Amihud): An uptrend accompanied by rising Amihud might be less stable. It could suggest that the price increase is driven by fewer participants and might be more prone to reversals.
The same logic applies to downtrends, but in reverse.
---------------------------------------------------------------------------------------------------------------------
Breakout Confirmation:
Breakout with Increasing Liquidity (Falling Amihud): A breakout accompanied by increasing liquidity (falling Amihud) can suggest strong conviction and a higher probability of the breakout being sustained.
Breakout with Decreasing Liquidity (Rising Amihud): A breakout on low liquidity might be more suspect and could be a "fakeout" if there isn't enough sustained buying or selling pressure.
---------------------------------------------------------------------------------------------------------------------
3. Identifying Potential Reversal Points:
Liquidity Exhaustion: Sometimes, a prolonged period of low liquidity (high Amihud) might precede a reversal. The lack of active trading interest at those levels could make the price more susceptible to a shift in sentiment.
Liquidity Surges: A sudden spike in liquidity (a sharp drop in Amihud) after a period of low liquidity could indicate renewed interest and potentially the start of a new trend or a reversal of the previous one.
-----------------------------------------------THANK YOU----------------------------------------------------------------------------------------------------------------------------------------------------------------------------------------------------------------------------------<3-----------------------------------------------
BTC Spot Aggregated Volume + 20EMAThe purpose of this indicator is to provide a more comprehensive view of Bitcoin's spot market activity by combining volume data from several sources.
1. Fetches and aggregates spot volume data for BTC from the following exchanges:
Binance (BTCUSDT)
Coinbase (BTCUSD)
Kraken (BTCUSD)
Bitfinex (BTCUSD)
Bitstamp (BTCUSD)
KuCoin (BTCUSDT)
Gate.io (BTCUSDT)
OKX (BTCUSDT)
Huobi (BTCUSDT)
2. Calculates a 20-period EMA on the aggregated volume to smooth out the data and identify volume trends.
This indicator is particularly useful for traders who want a broader view of real BTC spot market activity, rather than relying on a single exchange's data, which might be misleading or incomplete. By averaging across major exchanges, the indicator helps reduce noise and gives a more accurate picture of volume trends.

ZenAlgo - RangerThe core of the indicator is the daily range, anchored around the 1-minute timeframe VWAP (volume-weighted average price), with ±2 standard deviations defining the upper and lower bounds. This range dynamically forms throughout the day and then gets “locked” at 23:59 each day to establish historical reference values.
The indicator calculates this locked VWAP and standard deviation per day, which serves two primary purposes:
Drawing today's real-time evolving range , updated each minute.
Plotting previous daily ranges , based on historical locked VWAPs and standard deviations, providing visual reference boxes on the chart.
This design enables the trader to identify mean-reversion zones and persistent directional biases based on volume-weighted price consensus.
Multiple Standard Deviation Layers
Beyond the ±2.0 deviation bounds, optional lines are available at half-step increments (e.g., ±0.5, ±1.5, ..., ±4.5) and full-step levels beyond ±2.0 (±3.0, ±4.0, ±5.0). These provide a customizable grid to visualize price extremes, tail behavior, or potential breakout zones relative to volume-adjusted price equilibrium.
Users can enable only the levels they need, offering flexibility depending on their strategy (e.g., scalping versus swing trading).
Historical Range Retention
The script stores up to 70 previous daily VWAP + standard deviation values (adjustable). For each, it draws a full range box and standard deviation lines in the past. This historical context helps in understanding how current price interacts with prior days’ balance zones.
These boxes are always drawn from 00:00 to 23:59 UTC , ensuring consistent alignment across instruments and avoiding session-based discrepancies.
Monday Range Reference (Drawn on Tuesdays)
On Tuesdays, the indicator plots the previous Monday's VWAP-based range across the rest of the week. This serves as a persistent contextual anchor for traders watching weekly unfolding behavior. The range is defined identically (VWAP ±2σ) and drawn from Monday 00:00 through the following Monday.
This method assumes Monday often sets the tone or structure for the week, and tracking this level through time may highlight support/resistance confluence or range expansion scenarios.
Each Monday range is extended over 7 days and includes dashed lines at the 25%, 50%, and 75% marks within the range. These midrange markers help traders assess microstructure behaviors (e.g., reversion to median, failure to hold midpoint, etc.).
Daily Volume Delta via 4H Candles
The indicator also integrates daily buy/sell volume deltas , derived from 4-hour candles of the regular session (non-Heikin Ashi). The logic categorizes volume as:
Buy volume when candle closes above the previous close.
Sell volume when it closes below.
Even split when the candle closes flat.
These volumes accumulate each day to derive net delta (buy - sell). This delta is recorded for each day and can optionally be displayed. A similar process tracks the delta for each Monday range on an ongoing basis.
This information quantifies the market’s aggressive buying vs. selling , correlating with price positions inside or outside the VWAP ranges. A strong delta in one direction may justify a price sustaining above/below VWAP, or diverging from the previous range.
Interpretation and Best Usage Practices
VWAP±2σ Range : Considered a high-probability area for consolidation or reversal. Mean-reverting strategies can benefit from signals within this area.
VWAP±3.0 and beyond : Extreme deviations may signal exhaustion or breakout potential, but are less frequent.
Previous Range Overlap : Overlap of today’s price with past VWAP zones may indicate support/resistance zones.
Monday Range on Tuesday : Persistent levels where the week may repeatedly pivot. Best used on instruments that exhibit weekly cyclical behavior (e.g., indices, forex).
Delta Behavior : Sharp positive or negative delta combined with price outside VWAP bands may suggest initiative participation and potential trend continuation.
Added Value Over Free Alternatives
While many free VWAP tools exist, this script differs in several specific and factual ways:
Anchored 1-minute VWAP lock at a consistent daily timestamp (23:59 UTC), enabling historical analysis.
Historical storage of previous VWAP ranges , with adjustable memory depth and visual continuity.
Flexible standard deviation plotting , down to 0.5 increments, tailored to the user's strategy needs.
Dedicated Monday range analysis , not common in freely available scripts.
Volume delta tracking per day and per Monday range , offering a directional volume view unavailable in standard VWAP implementations.
Persistent and visual interpretation framework using extended boxes and dashed lines for easier contextual navigation.
Each of these additions increases the script’s utility for methodical traders relying on volume-weighted statistics, without requiring additional configuration or external calculations.
Limitations and Disclaimers
VWAP based on 1-minute resolution : The indicator uses minute-level data to calculate daily VWAP and standard deviation. This offers high fidelity on liquid instruments but may produce noisy or unreliable levels on illiquid assets or during periods of low volume. For example, microcap stocks or thinly traded altcoins might not yield stable VWAP centers.
Inferred buy/sell volume : Volume delta is estimated using price movement from one candle to the next (close-to-close logic), rather than actual trade-level aggressor data (which is not accessible via TradingView). This approximation may misclassify volume in choppy or low-volatility environments, especially in assets where price changes do not correlate well with order flow (e.g., crypto during low-volume weekends).
Non-continuous markets and price gaps : For assets that do not trade continuously (e.g., stocks, futures), the VWAP calculation starts fresh every day at 00:00 UTC, regardless of the instrument’s official session start. As a result:
Pre-market/post-market trades may be included in VWAP when analyzing equities, even though they are often excluded in professional VWAP tools.
Opening gaps in equities and futures may distort early VWAP values due to lack of volume context, especially if the previous day's session was already closed when new data begins accumulating.
Weekend gaps in crypto, although less frequent due to 24/7 trading, can still influence delta accumulation if abrupt moves happen during low liquidity periods.
Daily session alignment : The VWAP anchoring and box drawing uses 00:00 UTC to 23:59 UTC windows. For instruments with different official session timings (e.g., US equities, CME futures), this may cause mismatches between expected session VWAPs and the ones shown in this script.
Conclusion
The ZenAlgo – Ranger script offers a systematic visualization of volume-adjusted price behavior, combining statistical VWAP ranges with volume delta overlays. By integrating daily and weekly reference zones, this tool supports structured decision-making in various market environments, particularly for traders prioritizing mean reversion, range expansion, or trend confirmation.

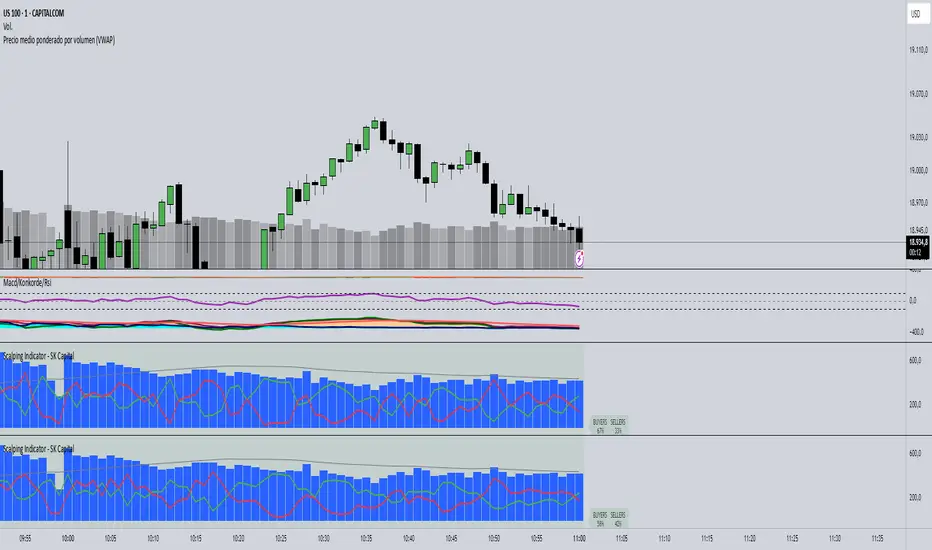
Scalping Indicator - SK CapitalThe Scalping Indicator - SK Capital is a professional-grade tool designed to empower intraday traders with real-time volume sentiment analysis and trend confirmation. Built on Pine Script v6, this indicator combines essential elements of technical trading—such as VWAP/EMA crossovers and volume decomposition—into one streamlined visualization.
Key Features:
Buyers vs. Sellers Visualization: Accurately estimates and displays the percentage of buying and selling volume within each candle. These are plotted with color-coded lines (green for buyers, red for sellers) and highlighted with a fixed summary label at the top for instant comparison.
Dynamic Sentiment Label: A prominent label at the top of the chart dynamically updates with the percentage of buyers and sellers per bar. The label’s background color shifts to green or red based on volume dominance and stays neutral when balanced, providing instant visual feedback.
Volume Histogram with Average Overlay: The total volume is represented by blue histogram bars, while a gray SMA line tracks the 50-period average volume to contextualize current activity.
Customizable Settings: Input fields allow traders to adjust the smoothing period for volume analysis, the EMA crossover length, and label font size for visual clarity.
This indicator is ideal for scalpers and short-term traders who rely on swift, data-driven decisions based on volume dynamics and trend signals. Whether you're analyzing one-minute candles or broader intraday timeframes, this script provides critical context in a compact, intuitive layout.
Easy MA SignalsEasy MA Signals
Overview
Easy MA Signals is a versatile Pine Script indicator designed to help traders visualize moving average (MA) trends, generate buy/sell signals based on crossovers or custom price levels, and enhance chart analysis with volume-based candlestick coloring. Built with flexibility in mind, it supports multiple MA types, crossover options, and customizable signal appearances, making it suitable for traders of all levels. Whether you're a day trader, swing trader, or long-term investor, this indicator provides actionable insights while keeping your charts clean and intuitive.
Configure the Settings
The indicator is divided into three input groups for ease of use:
General Settings:
Candlestick Color Scheme: Choose from 10 volume-based color schemes (e.g., Sapphire Pulse, Emerald Spark) to highlight high/low volume candles. Select “None” for TradingView’s default colors.
Moving Average Length: Set the MA period (default: 20). Adjust for faster (lower values) or slower (higher values) signals.
Moving Average Type: Choose between SMA, EMA, or WMA (default: EMA).
Show Buy/Sell Signals: Enable/disable signal plotting (default: enabled).
Moving Average Crossover: Select a crossover type (e.g., MA vs VWAP, MA vs SMA50) for signals or “None” to disable.
Volume Influence: Adjust how volume impacts candlestick colors (default: 1.2). Higher values make thresholds stricter.
Signal Appearance Settings:
Buy/Sell Signal Shape: Choose shapes like triangles, arrows, or labels for signals.
Buy/Sell Signal Position: Place signals above or below bars.
Buy/Sell Signal Color: Customize colors for better visibility (default: green for buy, red for sell).
Custom Price Alerts:
Custom Buy/Sell Alert Price: Set specific price levels for alerts (default: 0, disabled). Enter a non-zero value to enable.
Set Up Alerts
To receive notifications (e.g., sound, popup, email) when signals or custom price levels are hit:
Click the Alert button (alarm clock icon) in TradingView.
Select Easy MA Signals as the condition and choose one of the four alert types:
MA Crossover Buy Alert: Triggers on MA crossover buy signals.
MA Crossover Sell Alert: Triggers on MA crossover sell signals.
Custom Buy Alert: Triggers when price crosses above the custom buy price.
Custom Sell Alert: Triggers when price crosses below the custom sell price.
Enable Play Sound and select a sound (e.g., “Bell”).
Set the frequency (e.g., Once Per Bar Close for confirmed signals) and create the alert.
Analyze the Chart
Moving Average Line: Displays the selected MA with color changes (green for bullish, red for bearish, gray for neutral) based on price position relative to the MA.
Buy/Sell Signals: Appear as shapes or labels when crossovers or custom price levels are hit.
Candlestick Colors: If a color scheme is selected, candles change color based on volume strength (high, low, or neutral), aiding in trend confirmation.
Why Use Easy MA Signals?
Easy MA Signals is designed to simplify technical analysis while offering advanced customization. It’s ideal for traders who want:
A clear visualization of MA trends and crossovers.
Flexible signal generation based on MA crossovers or custom price levels.
Volume-enhanced candlestick coloring to identify market strength.
Easy-to-use settings with tooltips for beginners and pros alike.
This script is particularly valuable because it combines multiple features into one indicator, reducing chart clutter and providing actionable insights without overwhelming the user.
Benefits of Easy MA Signals
Highly Customizable: Supports SMA, EMA, and WMA with adjustable lengths.
Offers multiple crossover options (VWAP, SMA10, SMA20, etc.) for tailored strategies.
Custom price alerts allow precise targeting of key levels.
Volume-Based Candlestick Coloring: 10 unique color schemes highlight volume strength, helping traders confirm trends.
Adjustable volume influence ensures adaptability to different markets.
Flexible Signal Visualization: Choose from various signal shapes (triangles, arrows, labels) and positions (above/below bars).
Customizable colors improve visibility on any chart background.
Alert Integration: Built-in alert conditions for crossovers and custom prices support sound, email, and app notifications.
Easy setup for real-time trading decisions.
User-Friendly Design: Organized input groups with clear tooltips make configuration intuitive.
Suitable for beginners and advanced traders alike.
Example Use Cases
Swing Trading with MA Crossovers:
Scenario: A trader wants to trade Bitcoin (BTC/USD) on a 4-hour chart using an EMA crossover strategy.
Setup:
Set Moving Average Type to EMA, Length to 20.
Set Moving Average Crossover to “MA vs SMA50”.
Enable Show Buy/Sell Signals and choose “arrowup” for buy, “arrowdown” for sell.
Select “Emerald Spark” for candlestick colors to highlight volume surges.
Usage: Buy when the EMA20 crosses above the SMA50 (green arrow appears) and volume is high (dark green candles). Sell when the EMA20 crosses below the SMA50 (red arrow). Set alerts for real-time notifications.
Scalping with Custom Price Alerts:
Scenario: A day trader monitors Tesla (TSLA) on a 5-minute chart and wants alerts at specific support/resistance levels.
Setup:
Set Custom Buy Alert Price to 150.00 (support) and Custom Sell Alert Price to 160.00 (resistance).
Use “labelup” for buy signals and “labeldown” for sell signals.
Keep Moving Average Crossover as “None” to focus on price alerts.
Usage: Receive a sound alert and label when TSLA crosses 150.00 (buy) or 160.00 (sell). Use volume-colored candles to confirm momentum before entering trades.
When NOT to Use Easy MA Signals
High-Frequency Trading: Reason: The indicator relies on moving averages and volume, which may lag in ultra-fast markets (e.g., sub-second trades). High-frequency traders may need specialized tools with real-time tick data.
Alternative: Use order book or market depth indicators for faster execution.
Low-Volatility or Sideways Markets:
Reason: MA crossovers and custom price alerts can generate false signals in choppy, range-bound markets, leading to whipsaws.
Alternative: Use oscillators like RSI or Bollinger Bands to trade within ranges.
This indicator is tailored more towards less experienced traders. And as always, paper trade until you are comfortable with how this works if you're unfamiliar with trading! We hope you enjoy this and have great success. Thanks for your interested in Easy MA Signals!

Sweep Reversal 5M PRO – by [TuNombre]🔹 **Sweep Reversal 5M PRO – by ** 🔹
This indicator is built to detect high-probability *Institutional Sweeps* using Swing Failure Patterns (SFP), fully filtered with Smart Money Concepts (SMC) logic and volume confirmation.
✅ Identifies key liquidity grabs
✅ Confirms with strong impulse candle + increasing volume
✅ Filters out false signals (doji, weak zones, low volume)
✅ Optimized for the 5-minute timeframe (5M)
✅ Compatible with push alerts to your mobile
---
**How to use it:**
1. Wait for a “BUY” or “SELL” signal on the chart
2. Only enter if the next candle confirms with momentum
3. Place a tight stop just beyond the sweep
4. Recommended Take Profit: 1:1 minimum / 2:1 ideal
---
💡 Inspired by institutional trading (SMC, ICT-style setups)
🔒 Developed by – private or team-based use
📲 Activate alerts to get real-time trade opportunities on your phone
---
⚠️ This script does not repaint.
Built for serious traders who want precision, not noise.

TradeSmart Morning GloryThe Morning Glory Indicator by TradeSmart University is a pre-market volume visualization tool designed to help traders quickly assess the quality of a morning gap. By highlighting volume levels before the market opens, this indicator helps distinguish between a professional gap (likely to continue running) and a retail/news-driven gap (likely to fade or reverse).
💡 What It Does:
This indicator plots color-coded volume bars in the pre-market session and highlights when volume crosses two key thresholds:
Teal Bars – Low institutional interest
Yellow Bars – Medium institutional interest (100K+ volume)
Red Bars – High institutional interest (400K+ volume)
These thresholds are most effective on AMEX:SPY and other high-volume ETFs or stocks, but may be customized to fit your trading style. Consider using a 15-minute chart for the above settings.
🧠 How to Use It:
This indicator works best in conjunction with the Morning Glory Strategy and Qualified Trade Setup . On its own, the indicator gives a real-time read on pre-market strength , helping you:
Confirm gap-and-go setups (gap + high volume = likely continuation)
Fade the gap (gap + low volume = higher likelihood of reversal)
While the indicator focuses exclusively on volume, the full Morning Glory strategy adds an important price gap size filter to create powerful trade signals.
📊 Probabilities of Success (Based on Full Strategy):
When used as part of the Morning Glory Qualified Trade Setup, here are the historical win rates by day of the week:
Monday: 65%
Tuesday: 77%
Wednesday: 79%
Thursday: 82%
Friday: 78%
If used in conjunction with an artificial intelligence like the Deep Sky Trading Assistant™, win-loss ratios improve to 89% or better across all days of the week.
🔔 Note: For best results, activate premium ARCA data on your TradingView account. This ensures the most accurate and complete pre-market volume data.

Volume Weighted Median Price (VWMP)The volume is indeed crucial for confirming price moves and understanding market conviction. While many traders are familiar with VWAP (Volume Weighted Average Price), this indicator introduces a lesser-known but powerful cousin: the Volume Weighted Median Price (VWMP).
What is VWMP?
Unlike VWAP, which calculates the average price weighted by volume over a period, VWMP identifies the median price level weighted by volume.
Think of it this way: If you line up all the trades within a specific lookback period, sorted by price, and then start accumulating the volume traded at each price level, the VWMP is the price level where 50% of the total volume occurred below it, and 50% occurred above it.
It essentially finds the "middle ground" of trading activity based on where the bulk of the volume actually traded, not just the average price.
Key Difference: VWMP vs. VWAP
VWAP: Volume Weighted Average Price. Sensitive to outliers (single large trades at extreme prices can skew the average).
VWMP: Volume Weighted Median Price. More robust to outliers. It represents the price that splits the period's volume distribution in half.
Because it uses the median, VWMP can sometimes provide a more stable or representative level of the "typical" price where significant volume is changing hands, especially in volatile markets or when large, anomalous trades occur.
How to Interpret and Use VWMP in trading
The VWMP plots as a line on your chart, similar to a moving average or VWAP. Here are a few ways traders might use it:
Dynamic Support and Resistance:
Like VWAP, the VWMP line can act as a dynamic level of interest.
Watch how price interacts with the VWMP. Consistent acceptance above VWMP might suggest bullish control and potential support.
Consistent rejection or acceptance below VWMP might indicate bearish control and potential resistance.
Trend Filter / Confirmation:
Uptrend: Look for price consistently staying above the VWMP line. Pullbacks to the VWMP that hold could offer entry opportunities.
Downtrend: Look for price consistently staying below the VWMP line. Rallies to the VWMP that fail could present shorting opportunities.
Use it to filter trades: Only take long trades if price is above VWMP, and short trades if below.
Mean Reversion Potential (Use with Caution):
When price extends significantly far away from the VWMP, some traders might look for potential reversion back towards this volume-based median level.
Important: This should not be used in isolation. Always look for confirmation from other indicators (like RSI, Stochastics, or candlestick patterns) before trading counter-trend reversions.
Confluence with Other Indicators:
VWMP works best when combined with other analysis tools.
Look for confluence: Does the VWMP align with a key Fibonacci level, a standard moving average, or a prior support/resistance zone? This confluence strengthens the level's potential significance.
Considerations
Lookback Period: The length input is crucial. A shorter period makes VWMP more responsive to recent action; a longer period makes it smoother and reflects longer-term volume distribution. Experiment to find what suits your timeframe and trading style.
Lagging Nature: Like all indicators based on past data, VWMP is inherently lagging. It reflects past volume distribution, not the future.
Market Context: Its effectiveness can vary depending on the market conditions (trending vs. ranging) and the asset being traded.

VolVolVolVol: Volatility & Volume
The indicator consists of 3 oscillating components that are all represented on a positive/negative percentage scale.
Direction : Green/Red shaded area
Smoothened distance between Close and EMA of Close relative to StDev of Close
Intensity : Turquoise line
If direction = bullish: Smoothened distance between Low and EMA of Low relative to StDev of Low
If direction = bearish: Smoothened distance between High and EMA of High relative to StDev of High
Momentum : Fuchsia line
Double exponential average of bullish closing volume - bearish closing volume
The indicator provides the following signals on the candlestick charts based on the above components' movements.
Bullish position signals: Below candles
Bearish position signals: Above candles
Entry signal : Increase in all 3 factors or sharp increase in Intensity + Momentum
Add signal : Trend slowdown because of volume drop or retracement following a temporary consolidation
Exit signal : Increase in Intensity and Momentum against the prevailing trend direction
There may be simultaneous Bullish and Bearish signals. These should be treated as hedges for existing positions.

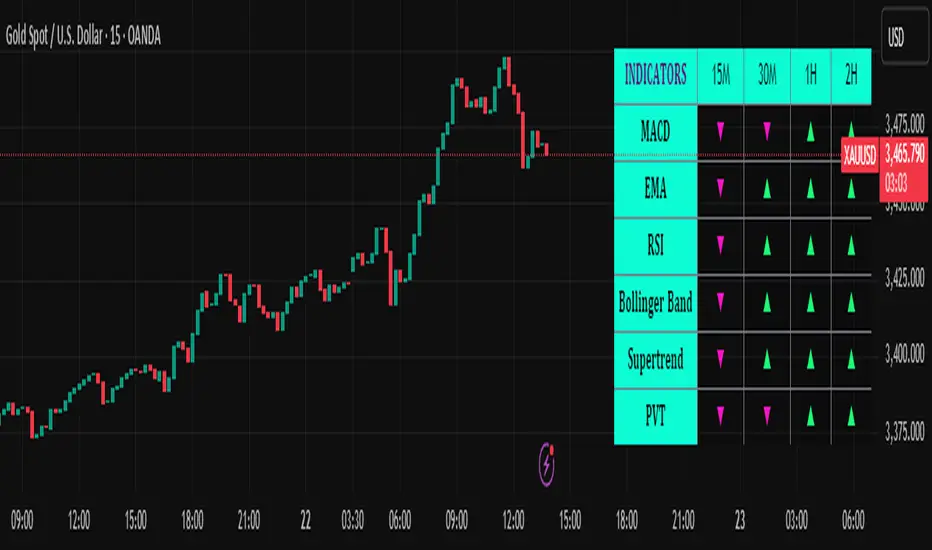
Trend Matrix Multi-Timeframe Dashboard(TechnoBlooms)Trend Matrix Multi-Timeframe Dashboard is a Minimalist Multi-Timeframe Trend Analyzer with Smart Indicator Integration. Trend Matrix MTF Dashboard is a clean, efficient, and visually intuitive trend analyzer built for traders who value simplicity without compromising on technical depth.
This dashboard empowers you to track trend direction across multiple timeframes using a curated set of powerful technical indicators—all from one compact visual panel. The design philosophy is simple: eliminate clutter, highlight trend clarity, and accelerate your decision-making process.
Key Features
✅ Minimalist Design with Maximum Insight
A compact dashboard view designed for clean charts and focused trading
Optimized layout shows everything you need—nothing you don’t
✅ Multi-Timeframe Access at a Glance
Instantly read the trend direction of selected indicators on multiple timeframes (e.g., 15m, 1h, 4h, 1D)
Customize the timeframe stack to fit scalping, intraday, swing, or positional strategies
✅ Robust Technical Indicators Built In
Each one is hand-picked for trend reliability:
MACD – Momentum and crossover confirmation
RSI – Overbought/oversold and directional shift
EMA – Dynamic support/resistance and trend bias
Bollinger Bands – Volatility structure and trend containment
PVT – Volume-Weighted Trend Confirmation
Supertrend – Price-following trend tracker
✅ Live Updates & Lightweight Performance
Built to update efficiently on every bar close
Minimal performance impact even with multiple timeframes active
By offering multi-timeframe (MTF) access to proven trend-following indicators, Trend Matrix helps you confidently align with the market’s dominant direction—without jumping between charts or analyzing indicators one by one.
This indicator offers customizable settings. The trader can choose the input parameters timeframes as per the choice.
Trend Matrix Multi-Timeframe Dashboard helps traders to identify trend based on technical indications. Trader can refer this while taking trading decisions.
🧠 Ideal For
Scalpers who need higher timeframe confirmation
Swing traders identifying clean entries aligned with the macro trend
Trend followers seeking clarity before committing capital
Price action & SMC traders validating market structure setups
Beginners who want a high-level trend guide without messy indicators
30-Day Rolling VWAP30-Day Rolling VWAP (30-RVWAP)
Overview:
The 30-Day Rolling VWAP is an advanced technical analysis tool designed for crypto traders that combines Volume Weighted Average Price over a 30-day rolling window with sophisticated volume analysis to generate high-probability trading signals.
Key Features:
1. Dynamic Color-Coded VWAP Line
Green glow = Strong bullish pressure
Red glow = Strong bearish pressure
Gray = Neutral/balanced market
The line changes color based on volume-weighted directional pressure
2. Volume Pressure Zones
Multi-layered glowing fill effect around VWAP
Expands/contracts based on volatility and volume
Shows potential support/resistance zones
3. Smart Alert System
Buy/Sell alerts based on VWAP color change
Cross above/below VWAP alerts
Confidence levels based on pressure strength
How to Use:
1. Color Signals
When VWAP turns green: Consider buying (bullish pressure)
When VWAP turns red: Consider selling (bearish pressure)
Gray color indicates consolidation/neutral market
2. Alert Structure
Buy/Sell alerts include confidence percentage (0-100%)
Higher confidence = stronger directional pressure
Cross alerts notify when price crosses VWAP with distance
3. Volume Pressure Zones
Wider zones = higher volatility/volume
Use zones as dynamic support/resistance levels
Watch for price reactions at zone boundaries
4. Trading Strategy
Enter long when VWAP turns green with high confidence (60%+)
Enter short when VWAP turns red with high confidence
Use VWAP as trailing stop (exit when cross alerts trigger)
Use pressure zones for profit targets
5. Alert Messages
Buy Signal: "BTCUSDT | 15m | BUY Signal | Price: 42380.00 | VWAP: 42350.00 | Distance: 0.07% | Confidence: 78% due to strong bullish pressure"
Cross Alert: "BTCUSDT | 15m | CROSS ABOVE VWAP | Price: 42360.00 | VWAP: 42350.00 | Distance: 0.02%"
Best Practices:
Use higher timeframes (4H+) for trend direction; preferably **daily timeframe**
Combine with other indicators for confirmation
Monitor volume for signal validation
Consider market context when entering trades
The indicator combines multiple volume metrics to filter out false signals and provides clear visual and alert-based trading signals.

TDO & Hit Rates by Weekday (5 min)Purpose
Tracks how often the next NY session “hits” the previous day’s True Day Open (TDO) level, separately for sessions that open above vs. below TDO, and breaks the statistics down by weekday (Mon–Fri) plus an overall summary.
Key Features
True Day Open (TDO) Plot
Captures the prior day’s 23:00 CT close price as the TDO.
Plots it as a continuous yellow line across your chart.
Session Labeling
At the end of each NY session (08:30–15:00 CT), places a small “TDO” label at the TDO price to confirm visually where it lay during that day.
Hit‑Count Logic
For each 5 min bar in the NY session, checks if the bar’s high ≥ TDO ≥ low (i.e. the TDO level was “hit”).
Classifies each session by whether its opening price (first 5 min bar) was above or below the TDO.
Weekday Statistics Table
Displays in the bottom‑left of your main chart window.
Rows: Header, Mon, Tue, Wed, Thu, Fri, All.
Columns:
% Hit Above: % of “above‑TDO” sessions that saw at least one hit
% Hit Below: % of “below‑TDO” sessions that saw at least one hit
Automatically updates in real time as new sessions complete.
Inputs & Settings
Data Resolution: Default = 5 min; use any intraday timeframe you like (1, 3, 15 min, etc.).
Extended Hours: Make sure your chart’s Extended Session (overnight) is enabled so the 23:00 CT bar exists.
Overlay: Draws directly on your price chart (no separate pane).
How to Use
Add to Chart: Paste the Pine v5 code into TradingView’s editor and apply to your ES (or other) futures chart.
Enable Overnight Bars: In Chart Settings → Symbol/Session → include Extended Hours.
Select Timeframe: Set the chart (or the indicator’s “Data Resolution” input) to 5 min (or your preferred intraday).
Read the Table:
Each weekday row shows how reliable TDO touches have been historically, separately for “above” and “below” opens.
The bottom “All” row summarizes combined performance.
What You Learn
Edge Analysis: Do sessions opening above TDO tend to test that level more often than those opening below (or vice versa)?
Day‑of‑Week Bias: Are certain weekdays more prone to TDO retests?
Overall Confidence: The “All” row lets you see your full-sample hit‑rate on both sides.

Options Volume ProfileOptions Volume Profile
Introduction
Unlock institutional-level options analysis directly on your charts with Options Volume Profile - a powerful tool designed to visualize and analyze options market activity with precision and clarity. This indicator bridges the gap between technical price action and options flow, giving you a comprehensive view of market sentiment through the lens of options activity.
What Is Options Volume Profile?
Options Volume Profile is an advanced indicator that analyzes call and put option volumes across multiple strikes for any symbol and expiration date available on TradingView. It provides a real-time visual representation of where money is flowing in the options market, helping identify potential support/resistance levels, market sentiment, and possible price targets.
Key Features
Comprehensive Options Data Visualization
Dynamic strike-by-strike volume profile displayed directly on your chart
Real-time tracking of call and put volumes with custom visual styling
Clear display of important value areas including POC (Point of Control)
Value Area High/Low visualization with customizable line styles and colors
BK Daily Range Identification
Secondary lines marking significant volume thresholds
Visual identification of key strike prices with substantial options activity
Value Area Cloud Visualization
Configurable cloud overlays for value areas
Enhanced visual identification of high-volume price zones
Detailed Summary Table
Complete breakdown of call and put volumes per strike
Percentage analysis of call vs put activity for sentiment analysis
Color-coded volume data for instant pattern recognition
Price data for both calls and puts at each strike
Custom Strike Selection
Configure strikes above and below ATM (At The Money)
Flexible strike spacing and rounding options
Custom base symbol support for various options markets
Use Cases
1. Identifying Key Support & Resistance
Visualize where major options activity is concentrated to spot potential support and resistance zones. The POC and Value Area lines often act as magnets for price.
2. Analyzing Market Sentiment
Compare call versus put volume distribution to gauge directional bias. Heavy call volume suggests bullish sentiment, while heavy put volume indicates bearish positioning.
3. Planning Around Institutional Activity
Volume profile analysis reveals where professional traders are positioning themselves, allowing you to align with or trade against smart money.
4. Setting Precise Targets
Use the POC and Value Area High/Low lines as potential profit targets when planning your trades.
5. Spotting Unusual Options Activity
The color-coded volume table instantly highlights anomalies in options flow that may signal upcoming price movements.
Customization Options
The indicator offers extensive customization capabilities:
Symbol & Data Settings : Configure base symbol and data aggregation
Strike Selection : Define number of strikes above/below ATM
Expiration Date Settings : Set specific expiry dates for analysis
Strike Configuration : Customize strike spacing and rounding
Profile Visualization : Adjust offset, width, opacity, and height
Labels & Line Styles : Fully configurable text and visual elements
Value Area Settings : Customize POC and Value Area visualization
Secondary Line Settings : Configure the BK Daily Range appearance
Cloud Visualization : Add colored overlays for enhanced visibility
How to Use
Apply the indicator to your chart
Configure the expiration date to match your trading timeframe
Adjust strike selection and spacing to match your instrument
Use the volume profile and summary table to identify key levels
Trade with confidence knowing where the real money is positioned
Perfect for options traders, futures traders, and anyone who wants to incorporate institutional-level options analysis into their trading strategy.
Take your trading to the next level with Options Volume Profile - where price meets institutional positioning.

Volume-Price Momentum IndicatorVolume-Price Momentum Indicator (VPMI)
Overview
The Volume-Price Momentum Indicator (VPMI), developed by Kevin Svenson , is a powerful technical analysis tool designed to identify strong bullish and bearish momentum in price movements, driven by volume dynamics. By analyzing price changes and volume surges over a user-defined lookback period, VPMI highlights potential trend shifts and continuation patterns through a smoothed histogram, optional labels, and background highlights. Ideal for traders seeking to capture momentum-driven opportunities, VPMI is suitable for various markets, including stocks, forex, and cryptocurrencies.
How It Works
VPMI calculates the difference between volume-weighted buying and selling pressure based on price changes over a specified lookback period. It amplifies signals during high-volume periods, applies smoothing to reduce noise, and uses momentum checks to detect sustained trends.
Indicator display:
A histogram that oscillates above (bullish) or below (bearish) a zero line, with brighter colors indicating stronger momentum and faded colors for weaker signals.
Optional labels ("Bullish" or "Bearish") to mark significant momentum shifts.
Optional background highlights to visually emphasize strong trend conditions.
Alerts to notify users when strong bullish or bearish momentum is detected.
Key Features
Customizable Settings:
Adjust the lookback period, volume threshold, momentum length, and smoothing to suit your trading style.
Volume Sensitivity:
Emphasizes price movements during high-volume surges, enhancing signal reliability.
Momentum Detection: Uses linear regression and momentum change to confirm sustained trends, reducing false signals.
Visual Clarity:
Offers a clear histogram with color-coded signals, plus optional labels and backgrounds for enhanced chart readability.
Alerts:
Configurable alerts for strong momentum signals, enabling timely trade decisions.
Inputs and Customization
Lookback Period (Default: 9):
Sets the number of bars to analyze price changes. Higher values smooth signals but may lag.
Volume Threshold (Default: 1.4):
Defines the volume level (relative to a 20-period SMA) that qualifies as a surge, amplifying signals.
High Volume Multiplier (Default: 1.5):
Boosts histogram values during high-volume periods for stronger signals.
Histogram Smoothing Length (Default: 4):
Controls the EMA smoothing applied to the histogram, reducing noise.
Momentum Check Length (Default: 4):
Sets the period for momentum trend analysis (recommended to be less than Lookback Period).
Momentum Threshold (Default: 6):
Defines the minimum momentum change required for strong signals.
Show Labels (Default: Off):
Toggle to display "Bullish" or "Bearish" labels on significant momentum shifts.
Show Backgrounds (Default: Off):
Toggle to highlight chart backgrounds during strong momentum periods.
Bullish/Bearish Colors:
Customize colors for bullish (default: green) and bearish (default: red) signals.
Faded Transparency (Default: 40):
Adjusts the transparency of weaker signals for visual distinction.
How to Use
Interpret Signals:
Above Zero (Green):
Indicates bullish momentum. Bright green suggests strong, sustained buying pressure.
Below Zero (Red):
Indicates bearish momentum. Bright red suggests strong, sustained selling pressure.
Faded Colors:
Weaker momentum, potentially signaling consolidation or trend exhaustion.
Enable Visuals:
Turn on "Show Labels" and "Show Backgrounds" in the settings for additional context on strong momentum signals.
Set Alerts:
Use the built-in alert conditions ("Strong Bullish Momentum" or "Strong Bearish Momentum") to receive notifications when significant trends emerge.
Combine with Other Tools:
Pair VPMI with support/resistance levels, trendlines, or other indicators (e.g., RSI, MACD) for confirmation.
Best Practices
Timeframe:
VPMI works on all timeframes, but shorter timeframes (e.g., 5m, 15m) may produce more signals, while longer timeframes (e.g., 1h, 4h, 1D) offer higher reliability.
Market Conditions:
Most effective in trending markets. In choppy or sideways markets, consider increasing the smoothing length or momentum threshold to filter noise.
Risk Management:
Always use VPMI signals in conjunction with a robust trading plan, including stop-losses and position sizing.
Limitations
Lagging Nature:
As a momentum indicator, VPMI may lag in fast-moving markets due to smoothing and lookback calculations.
False Signals:
In low-volume or ranging markets, signals may be less reliable. Adjust the volume threshold or momentum settings to improve accuracy.
Customization Required:
Optimal settings vary by asset and timeframe. Experiment with inputs to align with your trading strategy.
Why Use VPMI?
VPMI offers a unique blend of volume and price momentum analysis, making it a versatile tool for traders seeking to identify high-probability trend opportunities. Its customizable inputs, clear visuals, and alert capabilities empower users to tailor the indicator to their needs, whether for day trading, swing trading, or long-term analysis.
Get Started
Apply VPMI to your chart, tweak the settings to match your trading style, and start exploring momentum-driven opportunities. For questions or feedback, consult TradingView’s community forums or documentation. Happy trading!

Volume NodesVolume Nodes Indicator:
What This Indicator Does:
The Volume Nodes indicator identifies and visualizes statistically significant volume events on your chart, helping you identify important price levels where substantial trading activity has occurred. Unlike standard volume indicators, Volume Nodes:
Uses statistical analysis (z-scores) to identify truly abnormal volume bars
Calculates accurate buy/sell volume ratios by analyzing all lower timeframe data
Identifies the Volume Point of Control (VPOC) for high volume areas
Visualizes significant volume ranges as they extend across the chart
Tracks when price interacts with these important levels
Key Features:
High Volume Detection: Highlights bars with unusually high volume (z-score above threshold)
Low Volume Detection: Highlights bars with unusually low volume (z-score below threshold)
VPOC Lines: Horizontal lines showing the exact price level with maximum volume concentration
Volume Range Fills: Shaded areas showing the entire price range with significant volume
Accurate Volume Metrics: Shows true buy/sell volume ratios or delta percentages derived from lower timeframe data
How to Use It in Your Trading: **Move to front in the visual order on chart**
Step 1: Identify Important Volume Zones
High Volume Bars (green/red candles) indicate where significant buying or selling has occurred
VPOC Lines extending from these bars show you the exact price level with highest volume
Range Fills show you the entire zone where significant volume occurred
Step 2: Use These Levels for Trading Decisions
Support/Resistance: VPOC lines often act as support or resistance levels
Breakout Validation: Breakouts on high volume are more likely to be valid
Low Volume Warning: Low volume bars (yellow) often indicate indecision or potential reversals
Trading with Volume Flow: Use the buy/sell ratio or delta % to confirm the strength and direction of moves
Step 3: Monitor Price Interaction with Volume Zones
When price approaches a VPOC line, watch for reaction (bounce or breakout)
When price enters a volume range area, increased volatility often follows
When price crosses a VPOC line, the line changes transparency indicating it's been tested
Tips for Optimal Use
Higher Timeframes: The indicator works exceptionally well on higher timeframes (4H, daily, weekly) where volume patterns are more significant
Range Trading: Use volume nodes to identify the boundaries of trading ranges
Combine with Price Action: Look for price action confirmation (rejections, engulfing patterns) at VPOC levels
Multiple Timeframe Analysis: Compare volume nodes across different timeframes to find confluent levels
Alert Setup: Set up alerts for when price enters important volume zones or crosses VPOC lines
Reversal Signals: High volume bars with significant wicks often signal exhaustion points where smart money is transferring positions. Bullish candles with long upper wicks suggest sellers absorbing buying pressure at highs, while bearish candles with long lower wicks indicate buyers stepping in at lows - both potentially signaling momentum shifts that precede reversals.
The indicator is particularly valuable for identifying levels where large players have been active in the market and are likely to defend or act again in the future.

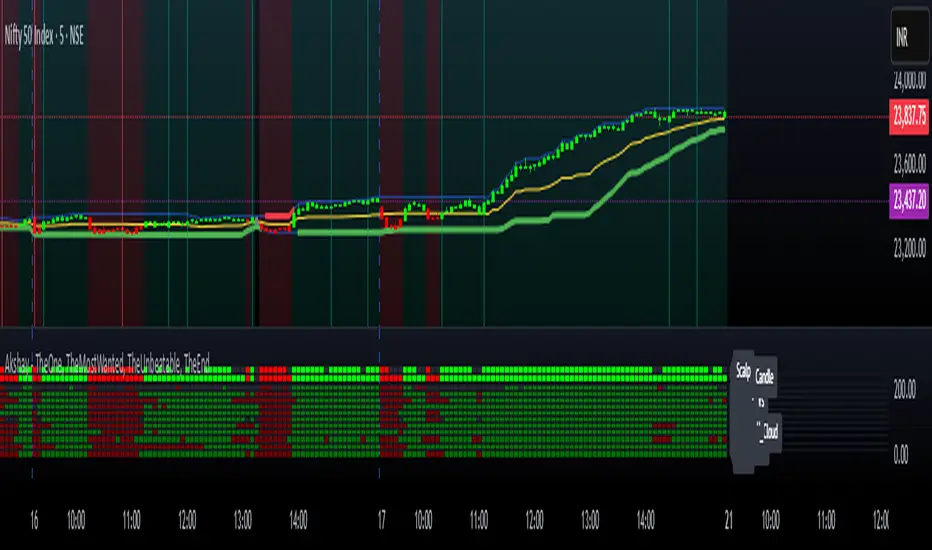
Akshay - TheOne, TheMostWanted, TheUnbeatable, TheEnd➤ All-in-One Solution (❌ No repaint):
This Technical Chart contains, MA24 Condition, Supertrend Indicator, HalfTrend Signal, Ichimoku Cloud Status, Parabolic SAR (P_SAR), First 5-Minute Candle Analysis (ORB5min), Volume-Weighted Moving Average (VWMA), Price-Volume Trend (PVT), Oscillator Composite, RSI Condition, ADX & Trend Strength.
Technicals don't lie.
🚀 Overview and Key Features
Comprehensive Multi-Indicator Approach:
The script is built to be an all-in-one technical indicator on TradingView. It integrates several well-known indicators and overlays—including Supertrend, HalfTrend, Ichimoku Cloud, various moving averages (EMA, SMA, VWMA), oscillators (Klinger, Price Oscillator, Awesome Oscillator, Chaikin Oscillator, Ultimate Oscillator, SMI Ergodic Oscillator, Chande Momentum Oscillator, Detrended Price Oscillator, Money Flow Index), ADX, and Donchian Channels—to create a composite picture of market sentiment.
Signal Generation and Alerts:
It not only calculates these indicators but also aggregates their output into “Master Candle” signals. Vertical lines are drawn on the chart with corresponding alerts to indicate potential buy or sell opportunities based on robust, combined conditions.
Visual Layering:
Through the use of colored histograms, custom candle plots, trend lines, and background color changes, the script offers a multi-layered visual representation of data, providing clarity about both short-term signals and overall market trends.
⚙️ How It Works and Functionality
MA24 Condition:
Uses the 24-period moving average as a proxy; if the price is above it, the bar is colored green, and red if below, with neutrality when conditions aren’t met.
Supertrend Indicator:
Evaluates price relative to the Supertrend level (calculated via ATR), coloring green when price is above it and red when below.
HalfTrend Signal:
Determines trend shifts by comparing the current close to a calculated trend level; green indicates an upward trend, while red suggests a downtrend.
Ichimoku Cloud Status:
Analyzes the relationship between the Conversion and Base lines; a bullish (green) signal is given when price is above both or the Conversion line is higher than the Base line.
Parabolic SAR (P_SAR):
Colors the signal based on whether the current price is above (green) or below (red) the Parabolic SAR marker, indicating stop and reverse conditions.
First 5-Minute Candle Analysis (ORB5min):
Uses key levels from the first 5-minute candle; if price exceeds the candle’s low, VWAP, and MA, it’s bullish (green), otherwise bearish (red).
Volume-Weighted Moving Average (VWMA):
Compares the current price to volume-weighted averages; a price above these levels is shown in green, below in red.
Price-Volume Trend (PVT):
Determines bullish or bearish momentum by comparing PVT to its VWAP—green when above and red when below.
Oscillator Composite:
Aggregates signals from multiple oscillators; a majority of positive results turn it green, while negative dominance results in red.
RSI Condition:
Uses a simple RSI threshold of 50, with values above signifying bullish (green) momentum and below marking bearish (red) conditions.
ADX & Trend Strength:
Reflects overall trend strength through ADX and directional movements; a combination favoring bullish conditions colors it green, with red signaling bearish pressure.
Master Candle Overall Signal:
Combines multiple indicator outputs into one “Master” signal—green for a consensus bullish trend and red for a bearish outlook.
Scalp Signal Variation:
Focused on short-term price changes, this signal adjusts quickly; green indicates improving short-term conditions, while red signals a downturn.
📊 Visualizations and 🎨 User Experience (❌ no repaint)
Dynamic Histograms & Bar Plots:
Each indicator is represented as a colored bar (with added vertical offsets) to facilitate easy comparison of their respective bullish or bearish contributions.
Clear Color-Coding & Labels:
Green (e.g., GreenFluorescent) indicates bullish sentiment.
Red (e.g., RedFluorescent) indicates bearish sentiment.
Custom labels and descriptive text accompany each bar for clarity.
Interactive Charting:
The overall background color adapts based on the “Master Candle” condition, offering an instant read on market sentiment.
The current candlestick is overlaid with color cues to reinforce the indicator’s signal, enhancing the trading experience.
Real-Time Alerts:
Vertical lines appear on signal events (buy/sell triggers), complemented by alerts that help traders stay on top of actionable market moves.
Sharp lines:
The Sharp lines are plotted based upon the EMA5 cross over with the same market trend, marks this as good time to reentry.
🔧 Settings and Customization
Flexible Timeframe Input:
Users can select their preferred timeframe for analysis, making the indicator adaptable to intraday or longer-term trading styles.
Customizable Indicator Parameters:
➤ Supertrend: Adjust ATR length and multiplier factors.
➤ HalfTrend: Tweak amplitude and channel deviation settings.
➤ Ichimoku Cloud & Oscillators: Fine-tune the conversion/base lines and oscillator lengths to match individual trading strategies.
Visual Customization:
The script’s color schemes and plotting styles can be altered as needed, giving users the freedom to tailor the interface to their taste or existing chart setups.
🌟 Uniqueness of the Concept
Integrated Multi-Indicator Synergy:
Combines a diverse range of trend, momentum, and volume-based indicators into a single cohesive system for a holistic market view.
Master Candle Aggregation:
Consolidates numerous individual signals into a "Master Candle" that filters out noise and provides a clear, consensus-based trading signal.
Layered Visual Feedback:
Uses color-coded histograms, adaptive background cues, and dynamic overlays to deliver a visually intuitive guide to market sentiment at a glance.
Customization and Flexibility:
Offers adjustable parameters for each indicator, allowing users to tailor the system to fit diverse trading styles and market conditions.
✅ Conclusion:
Robust Trading Tool & Non-Repainting Reliability:
This versatile technical analysis tool computes an extensive range of indicators, aggregates them into a stable, non-repainting “Master Candle” signal, and maintains consistent, verifiable outputs on historical data.
Holistic Market Insight & Consistent Signal Generation:
By combining trend detection, momentum oscillators, and volume analysis, the indicator delivers a comprehensive snapshot of market conditions and generates dependable signals across varying timeframes.
User-Centric Design with Rich Visual Feedback:
Customizable settings, clear color-coded outputs, adaptive backgrounds, and real-time alerts work together to provide actionable, transparent feedback—enhancing the overall trading experience.
A Unique All-in-One Solution:
The integrated approach not only simplifies complex market dynamics into an easy-to-read visual guide but also empowers systematic traders with a powerful, adaptable asset for accurate decision-making.
❤️ Credits:
Pine Script™ User Manual
Supertrend
Ichimoku Cloud
Parabolic SAR
Price Volume Trend (PVT)
Average Directional Index (ADX)
Volume Oscillator
HalfTrend
Donchian Trend
Buyer and Seller VWAPThis indicator calculates and visualizes Buyer and Seller Volume-Weighted Average Prices (VWAP) using a Least Squares Moving Average (LSMA) smoothing method. It classifies trades based on candle direction—buys when the close is above or equal to the open, and sells when the close is below the open.
The indicator applies LSMA to both buyer and seller VWAP values to reveal underlying trends with reduced noise. It also calculates a standard deviation band around each LSMA line, creating a shaded zone that represents volatility. This helps traders identify periods of expansion, contraction, and potential breakout opportunities based on buyer/seller strength.

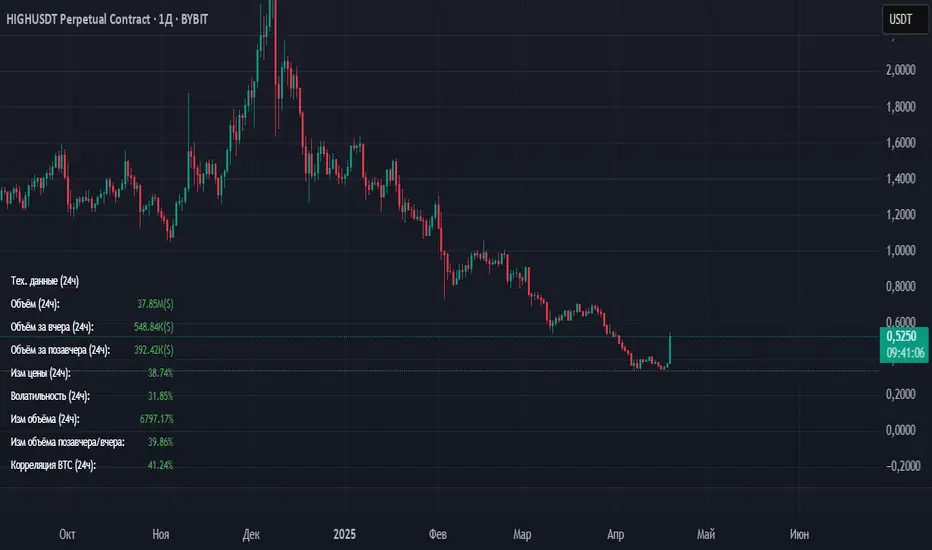
Volume_volatility_24)📊 TechData24h (24h Technical Metrics)
This TradingView indicator displays and alerts on key daily metrics for the current trading instrument, including:
Volume (24h, Yesterday, Day Before Yesterday)
Price Change (%) over 24h
Volatility (%) over 24h
Volume Change (%) vs Yesterday and Day Before
Correlation with BTC (custom symbol & timeframe)
🔔 Custom Alerts:
You can define your own percentage thresholds for both positive and negative changes. Alerts will trigger when:
Price change exceeds or drops below a set threshold
Volatility crosses a threshold
Volume increases or decreases significantly
Correlation with BTC moves beyond limits
📋 Table Dashboard:
All selected metrics are shown in a 2-column dashboard at the bottom left of the chart, with color-coded values based on increase/decrease.