Opening Range, Initial Balance, Opening Price, Pre-market Levels### Description of the Indicator: **Opening Range, Initial Balance, Opening Price, Pre-market Levels**
This custom TradingView indicator provides a comprehensive view of key price levels for intraday trading, specifically designed to track important levels from the Opening Range (OR), Initial Balance (IB), Opening Price (OP), and Pre-market session (PM). These levels are essential for traders to gauge potential market movements and identify critical areas of support and resistance.
#### **Features:**
1. **Opening Range (OR):**
- This is the high and low of the first 30 minutes of the regular market session (09:30 - 10:00 EST).
- The OR high and low act as significant levels that may influence price movement for the rest of the day.
- The mid-level of the Opening Range (OR Mid) is also plotted to give a more detailed view of potential price action.
2. **Initial Balance (IB):**
- The Initial Balance is the range created during the first hour of market activity (09:30 - 10:30 EST).
- This range often sets the tone for the market's direction. The IB high and low, along with the IB midline, are plotted for quick reference.
3. **Opening Price (OP):**
- The opening price of the market is marked as a circle and labeled "OP."
- This level provides context for market sentiment when compared to the high and low levels.
4. **Pre-market Levels (PM):**
- The pre-market session (04:00 - 09:30 EST) has its own important levels that are calculated for the high, low, and mid range (PM High, PM Low, and PM Mid).
- These levels are plotted and are useful for traders to understand where the market stood before the regular session opened.
#### **Customization Options:**
- **Exchange Timezone:** You can choose whether to display the times in the exchange's local timezone or in your own preferred timezone.
- **Mid Levels Display:** You can toggle whether the mid levels for each range (OR, IB, PM) should be shown on the chart.
- **Level Color Change:** The colors of the plotted levels (high, low, mid) change based on whether the price is above or below the respective level, making it easy to visualize potential support and resistance.
- **Label Positions:** The position of the labels (OR, IB, OP, PM) on the chart can be customized to avoid overlap with other data points.
#### **Key Use Cases:**
- **Intraday Trend Analysis:** Use the OR and IB to identify key levels for the day, providing insights into the possible trend or range for the day.
- **Pre-market Insights:** The PM levels are crucial for understanding where the market stood during the pre-market hours and can be used as reference points during the regular session.
- **Potential Support and Resistance:** The high and low levels of the OR, IB, and PM sessions can act as potential support or resistance, which are useful for setting stop-loss and take-profit levels.
#### **How to Use:**
- Pay attention to the levels provided for OR, IB, and PM as potential entry and exit points.
- Watch for breakouts or reversals around these levels, especially when combined with other technical indicators or price action patterns.
- The mid levels offer an additional reference to assess price direction or identify possible areas of consolidation.
This indicator is perfect for day traders who rely on key intraday levels and pre-market activity to make informed trading decisions. It helps to streamline the process of identifying potential breakouts, reversals, and ranges in the market.
Volume
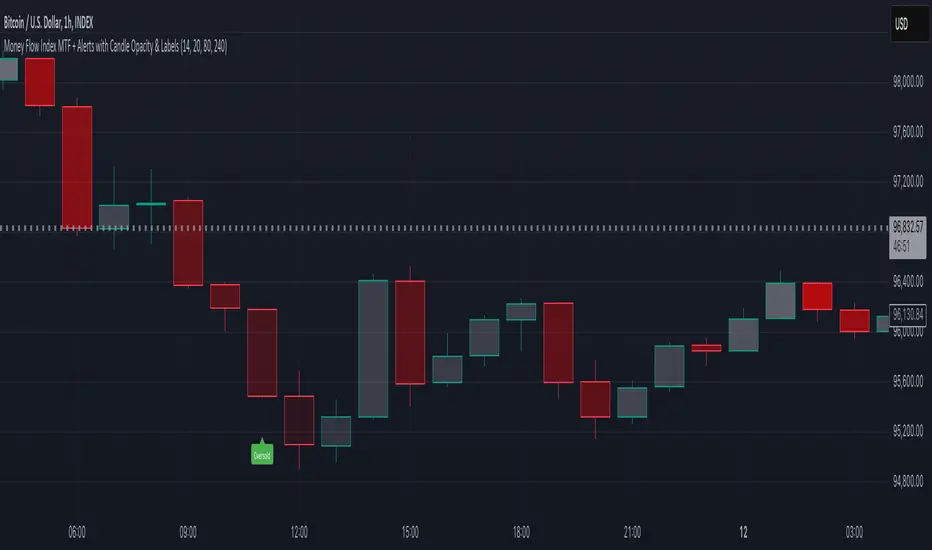
Money Flow Index MTF + Alerts with Candle Opacity & LabelsHow to Use the Money Flow Index MTF + Alerts with Candle Opacity & Labels Indicator
Overview:
This indicator is designed to help you gauge the buying and selling pressure in a market by using the Money Flow Index (MFI). Unlike many momentum oscillators, the MFI incorporates both price and volume, providing a unique perspective on market activity. It is particularly useful when you want to visually assess potential overbought or oversold conditions.
Indicator Components:
Money Flow Index (MFI) Calculation:
The indicator computes the MFI using a user-defined look-back period (default is 14 bars). The MFI is scaled between 0 and 100, where values above 80 typically indicate overbought conditions and values below 20 suggest oversold conditions.
Multi-Timeframe (MTF) Capability:
You can choose to calculate the MFI using either the current chart’s timeframe or a custom timeframe (for example, a 4-hour chart). This flexibility allows you to compare longer-term money flow trends against your primary trading timeframe.
Candle Opacity Based on MFI:
The opacity of the candles on your chart is dynamically adjusted based on the current MFI reading. When the MFI is high (near 100), candles become more opaque; when the MFI is low (near 0), candles appear more transparent. This visual cue can help you quickly spot changes in market momentum.
Visual Labels for Overbought/Oversold Conditions:
When the MFI crosses into the overbought territory, a red label reading “Overbought” is displayed above the high of the bar. Similarly, when it crosses into the oversold territory, a green label reading “Oversold” is placed below the low of the bar. These labels provide an immediate visual alert to potential reversal points or areas of caution.
Alert Conditions:
The script also includes alert conditions for both overbought and oversold signals. You can set up TradingView alerts so that you are notified in real time when the indicator detects these conditions.
Theory Behind the Money Flow Index (MFI):
The Money Flow Index is a momentum oscillator that uses both price and volume to signal the strength behind price moves.
Overbought Conditions: When the MFI is above 80, it suggests that buying pressure is very strong and the asset might be due for a pullback or consolidation.
Oversold Conditions: Conversely, when the MFI falls below 20, selling pressure is high and the asset might be oversold, potentially priming it for a bounce.
Keep in mind that in strong trending markets, overbought or oversold readings can persist for extended periods, so the MFI should be used in conjunction with other technical analysis tools.
Position Management Guidance:
While the indicator is useful for spotting potential overbought and oversold conditions, it is not designed to serve as an automatic signal to completely close a position. Instead, you might consider using it as a guide for pyramiding—gradually adding to your position over several days rather than exiting all at once. This approach allows you to better manage risk by:
Scaling In or Out Gradually: Instead of making one large position change, you can add or reduce your position in increments as market conditions evolve.
Diversifying Risk: Pyramiding helps you avoid the pitfalls of trying to time the market perfectly on a single trade exit or entry.
How to Get Started:
Apply the Indicator:
Add the indicator to your TradingView chart. Adjust the input settings (length, oversold/overbought levels, and resolution) as needed for your trading style and the market you’re analyzing.
Watch the Candles:
Observe the dynamic opacity of your candles. A sudden change in opacity can be a sign that the underlying money flow is shifting.
Monitor the Labels:
Pay attention to the “Overbought” or “Oversold” labels that appear. Use these cues in combination with your broader analysis to decide if it might be a good time to add to or gradually exit your position.
Set Up Alerts:
Configure TradingView alerts based on the indicator’s alert conditions so that you are notified when the MFI reaches extreme levels.
Use as Part of a Broader Strategy:
Remember, no single indicator should dictate your entire trading decision. Combine MFI signals with other technical analysis, risk management rules, and market insights to guide your trades.
RELATIVE VOLThis script, titled "Relative Vol," is designed to visualize and analyze volume data on TradingView. It calculates and displays the relative volume based on the average volume over a set lookback period, with volume expressed as a percentage of the average. Key features include:
Volume Percentage Calculation: The script calculates the volume percentage relative to the average volume over a specified lookback period (default of 20). It compares the current volume to the historical average and plots it as a percentage on the chart.
Volume Color Coding: The bars are color-coded based on the relationship between price action and volume:
Bullish volume above average: Green
Bearish volume above average: Red
Bullish volume below average: Light gray
Bearish volume below average: Dark gray
Daily Data Integration: It pulls in daily average volume and daily Average True Range (ATR) data:
Displays the daily average volume and ATR values in a table on the top-right of the chart.
Colors in the table reflect whether the daily average volume is high (greater than 1,000,000) and if the daily ATR is above 2.
Custom Timeframe Calculation: The script adjusts the lookback period and volume calculation based on the timeframe of the chart (1-minute, 5-minute, 15-minute, 30-minute, 60-minute, or daily).
This script provides traders with a visual representation of relative volume, helping them identify whether current trading activity is above or below average and how it correlates with price movement. Additionally, the integration of daily volume and ATR data helps assess overall market volatility and liquidity trends.

Absolute Volume Levels MA [AlgoRich]This script allows you to:
Choose between dynamic or static thresholds to classify the volume of the bars.
Select the type of moving average (SMA, EMA, RMA, or KAMA) and the period for calculating the volume's moving average, making it easier to adapt to different asset behaviors and volatilities.
Configure multiplier factors that determine the intermediate and strong thresholds based on the volume's moving average.
Assign differentiated colors for bullish and bearish bars, depending on whether the volume is weak, intermediate, or strong.
Visualize the classified volume in a histogram, which helps quickly identify the bars with the highest activity.
This flexibility and customization allow the indicator to adapt to various assets and timeframes, providing a robust visual tool for analyzing volume behavior.
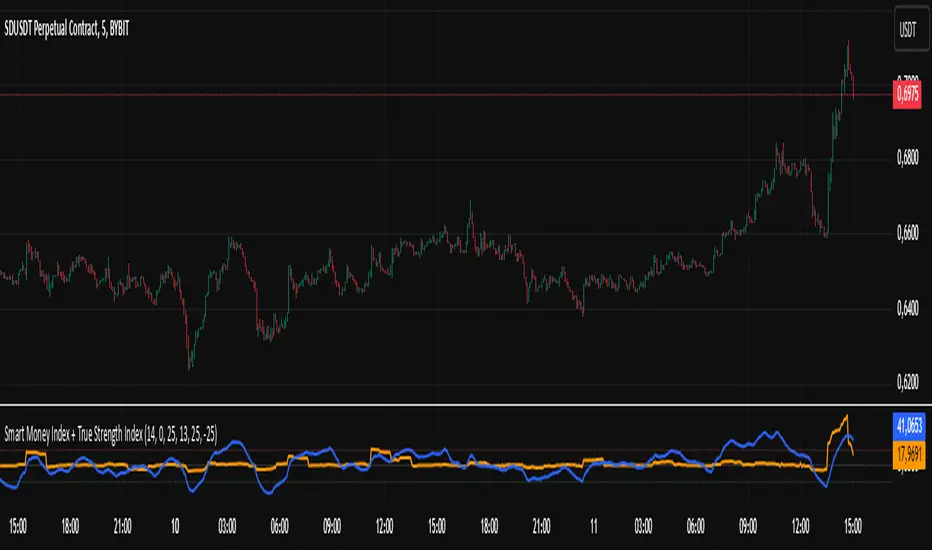
Smart Money Index + True Strength IndexThe Smart Money Index + True Strength Index indicator is a combination of two popular technical analysis indicators: the Smart Money Index (SMI) and the True Strength Index (TSI). This combined indicator helps traders identify potential entry points for long and short positions based on signals from both indexes.
Main Components:
Smart Money Index (SMI):
The SMI measures the difference between the closing and opening price of a candle multiplied by the trading volume over a certain period of time. This allows you to assess the activity of large players ("smart money") in the market. If the SMI value is above a certain threshold (smiThreshold), it may indicate a bullish trend, and if lower, it may indicate a bearish trend.
True Strength Index (TSI):
The TSI is an oscillator that measures the strength of a trend by comparing the price change of the current bar with the previous bar. It uses two exponential moving averages (EMAS) to smooth the data. TSI values can fluctuate around zero, with values above the overbought level indicating a possible downward correction, and values below the oversold level signaling a possible upward correction.
Parameters:
SMI Length: Defines the number of candles used to calculate the average SMI value. The default value is 14.
SMI Threshold: A threshold value that is used to determine a buy or sell signal. The default value is 0.
Length of the first TSI smoothing (tsiLength1): The length of the first EMA for calculating TSI. The default value is 25.
Second TSI smoothing length (tsiLength2): The length of the second EMA for additional smoothing of TSI values. The default value is 13.
TSI Overbought level: The level at which the market is considered to be overbought. The default value is 25.
Oversold level TSI: The level at which it is considered that the market is in an oversold state. The default value is -25.
Logic of operation:
SMI calculation:
First, the difference between the closing and opening price of each candle (close - open) is calculated.
This difference is then multiplied by the trading volume.
The resulting product is averaged using a simple moving average (SMA) over a specified period (smiLength).
Calculation of TSI:
The price change relative to the previous bar is calculated (close - close ).
The first EMA with the length tsiLength1 is applied.
Next, a second EMA with a length of tsiLength2 is applied to obtain the final TSI value.
The absolute value of price changes is calculated in the same way, and two emas are also applied.
The final TSI index is calculated as the ratio of these two values multiplied by 100.
Graphical representation:
The SMI and TSI lines are plotted on the graph along with their respective thresholds.
For SMI, the line is drawn in orange, and the threshold level is dotted in gray.
For the TSI, the line is plotted in blue, the overbought and oversold levels are indicated by red and green dotted lines, respectively.
Conditions for buy/sell signals:
A buy (long) signal is generated when:
SMI is greater than the threshold (smi > smiThreshold)
TSI crosses the oversold level from bottom to top (ta.crossover(tsi, oversold)).
A sell (short) signal is generated when:
SMI is less than the threshold (smi < smiThreshold)
TSI crosses the overbought level from top to bottom (ta.crossunder(tsi, overbought)).
Signal display:
When the conditions for a long or short are met, labels labeled "LONG" or "SHORT" appear on the chart.
The label for the long is located under the candle and is colored green, and for the short it is above the candle and is colored red.
Notification generation:
The indicator also supports notifications via the TradingView platform. Notifications are sent when conditions arise for a long or short position.
This combined indicator provides the trader with the opportunity to use both SMI and TSI signals simultaneously, which can improve the accuracy of trading decisions.
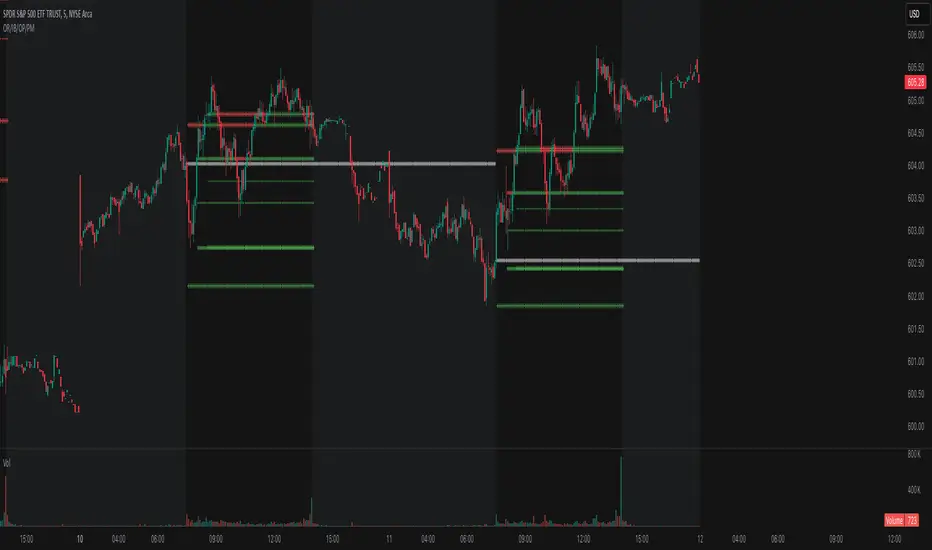
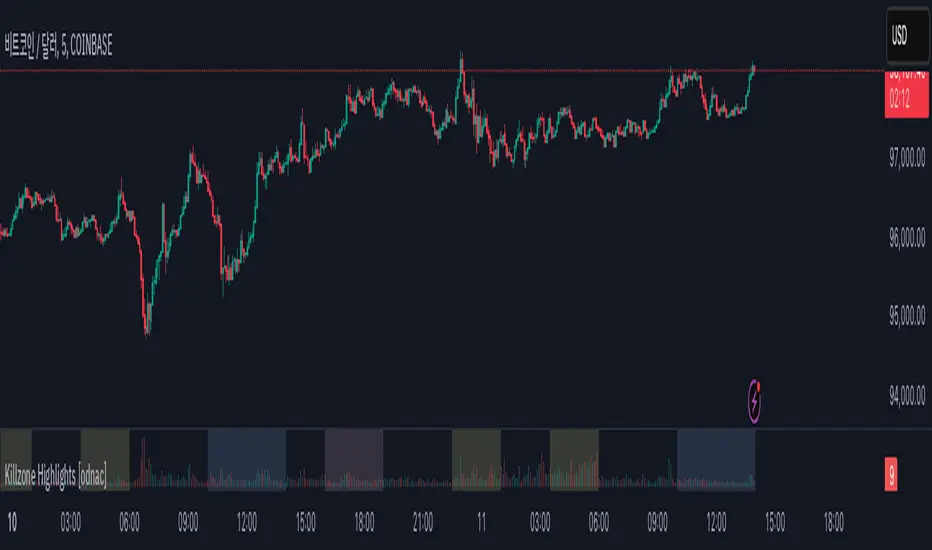
Killzone Highlights with Volume [odnac]
Description:
This indicator seamlessly integrates volume analysis with kill zone highlights across different market sessions.
The indicator dynamically displays trading volume and visually emphasizes key trading sessions in various time zones, including Asia, Europe, and New York (both AM and PM sessions).
Users have the flexibility to customize the colors of bullish and bearish volume bars, as well as the transparency and color of the kill zone highlights, allowing for tailored visual analysis of trading periods.
Features:
Bullish and Bearish Volume Colors:
Displays the volume of trades with user-defined colors for bullish (up) and bearish (down) candles.
Killzone Highlights:
Highlights the kill zones for Asia, Europe, New York AM, and New York PM sessions with user-defined colors and transparency.
Customization Options:
Allows users to adjust the colors, transparency, and time settings for each kill zone.
Weekend Handling:
Option to hide kill zone highlights during weekends.
Timeframe Limitation:
Users can set the maximum timeframe for which the kill zone highlights will be displayed.
Usage:
This indicator is designed for traders who want to gain insights into market activity during key trading sessions.
By combining volume data with visually distinct kill zone highlights, it helps traders make informed decisions based on the most active trading periods.
Ideal for intraday traders looking to leverage session-based strategies for more effective trading decisions.
Fibonacci Volume Profiles [AlgoAlpha]Unlock a deeper understanding of price action with the Fibonacci Volume Profiles indicator by AlgoAlpha! This powerful tool blends Fibonacci retracement levels with customizable volume profiles, helping traders identify high-probability areas of support, resistance, and accumulation. Designed for both continuous dynamic levels and custom time periods, this indicator is a must-have for traders seeking confluence in market structure analysis.
🔑 Key Features
📈 Dual Mode Selection : Choose between Continuous Fibonacci levels, which adapt dynamically to pivots, or a Custom Period mode, where you set your own start and end points.
📊 Integrated Volume Profile : Visualize volume distributions at key Fibonacci retracement levels, revealing areas of strong buying/selling interest.
🎨 Customizable Colors & Transparency : Adjust Fibonacci level colors, fill zones, and profile transparency for a visually clear experience.
🔍 Profile Resolution & Scaling : Control the number of price levels and width of the volume profile for detailed market insights.
🛠 Extendable Levels : Optionally extend Fibonacci levels to the right of the chart for better visualization of future price interaction.
📌 How to Use
Add the Indicator: Click on the star icon to add it to your favorites and apply it to your TradingView chart.
Analyze The Market: Observe how price interacts with Fibonacci levels alongside the volume profile to confirm support/resistance zones. Switch between custom range or continuous mode to align the tool with your trading style.
⚙️ How It Works
The indicator calculates pivot highs/lows dynamically (or uses user-defined time periods) to plot Fibonacci retracement levels. It then builds a volume profile by analyzing historical volume data, grouping it into price bins to highlight volume-heavy zones. The Point of Control (PoC) is identified as the level with the highest traded volume, acting as a key price magnet. The color-coded Fibonacci levels help traders spot retracement zones, while the volume profile confirms strength or weakness in those areas.

Volume Delta with PVSRAVolume Delta with PVSRA
Volume Delta with PVSRA is an advanced volume indicator that dissects each bar’s volume into its directional components using higher resolution data. It visually distinguishes between buying and selling volume, so that for a bullish candle the bottom portion represents buying volume and for a bearish candle it represents selling volume. A dot is plotted at the 50% mark of the candle’s total volume, serving as a clear reference point.
Key Features:
Directional Volume Breakdown:
The indicator calculates the delta volume by analyzing lower timeframe data. The bottom portion of a bullish candle (displayed in green) represents buying volume, while that of a bearish candle (displayed in red) represents selling volume.
PVSRA Analysis:
Using Price-Volume Spread Range Analysis, the indicator compares the current volume to the 10-bar average. When volume is significantly higher (using thresholds of 150% and 200%), the candle borders are highlighted in custom colors, indicating medium or strong volume conditions.
Volume Moving Averages:
Three moving averages are plotted:
Total Volume MA (yellow): Tracks overall volume.
Buying Volume MA (green) and Selling Volume MA (red): These are re-centered around the total volume MA. A crossover of the green over the red typically signals rising buying pressure, while the opposite indicates increasing selling pressure.
Scalable Volume Bars:
The indicator scales the volume bars to provide optimal visualization on your chart.
Setup Instructions:
For best results, open your chart settings, navigate to the Canvas tab, and set the bottom margin to 0%. This ensures the indicator displays like a standard volume indicator without any unwanted gaps at the bottom.
Customize the various settings—including colors, border opacity, and moving average parameters—to suit your trading style.

Engulfing Pattern with Volume and EMAs
**Strategy Overview:
This strategy combines price action (Engulfing patterns), volume analysis, trend confirmation (EMAs), and noise reduction (ATR filter) to generate high-probability trading signals.
Engulfing Pattern with Volume, EMAs, and Market Noise Filter**
This strategy identifies bullish and bearish Engulfing candlestick patterns, combined with volume analysis, moving averages (EMAs), and a market noise filter to generate trading signals.
**Key Components:**
1. **Engulfing Pattern Detection:**
- **Bullish Engulfing**: A green candle completely engulfs the previous red candle.
- **Bearish Engulfing**: A red candle completely engulfs the previous green candle.
2. **Volume Filter:**
- Signals are validated only if the current volume is higher than the 20-period Simple Moving Average (SMA) of volume.
3. **EMA Indicators:**
- Three EMAs are plotted: 50-period (blue), 89-period (orange), and 200-period (red).
- These EMAs help identify the trend direction and provide additional confirmation.
4. **Market Noise Filter:**
- Uses the Average True Range (ATR) to filter out insignificant price movements.
- A signal is considered valid only if the price movement (absolute difference between open and close) is greater than 0.5 times the 14-period ATR.
**Trading Signals:**
**Buy Signal**:
- Bullish Engulfing pattern + High volume (above SMA 20) + Significant price movement (filtered by ATR).
- Plotted as a green "BUY" label below the candle.
**Sell Signal**:
- Bearish Engulfing pattern + High volume (above SMA 20) + Significant price movement (filtered by ATR).
- Plotted as a red "SELL" label above the candle.
**Customization:**
- Users can adjust EMA lengths, volume SMA period, and ATR multiplier to suit their trading preferences.
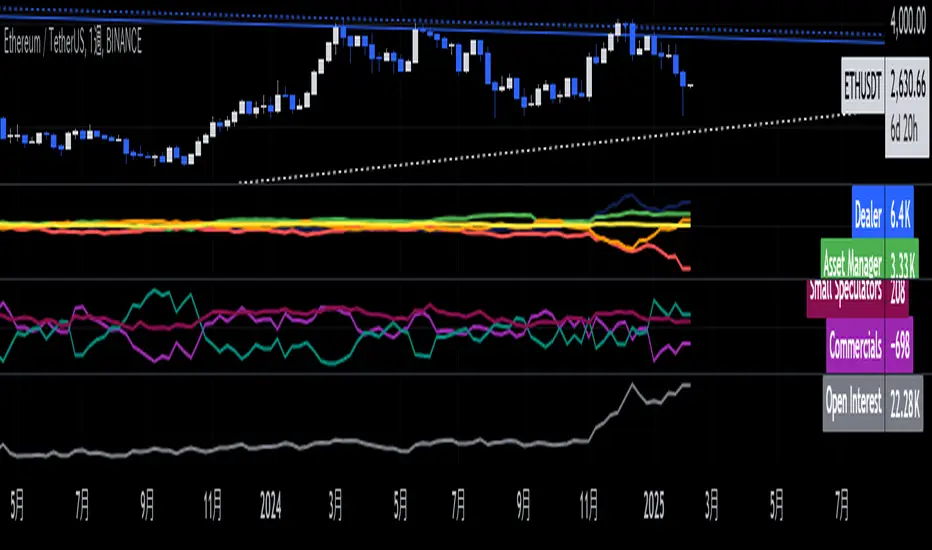
Ethereum COT [SAKANE]#Overview
Ethereum COT is an indicator that visualizes Ethereum futures market positions based on the Commitment of Traders (COT) report provided by the CFTC (Commodity Futures Trading Commission).
This indicator stands out from similar tools with the following features:
- **Flexible Data Switching**: Supports multiple COT report types, including "Financial," "Legacy," "OpenInterest," and "Force All."
- **Position Direction Selection**: Easily switch between long, short, and net positions. Net positions are automatically calculated.
- **Open Interest Integration**: View the overall trading volume in the market at a glance.
- **Comparison and Customization**: Toggle individual trader types (Dealer, Asset Manager, Commercials, etc.) on and off, with visually distinct color-coded graphs.
- **Force All Mode**: Simultaneously display data from different report types, enabling comprehensive market analysis.
These features make it a powerful tool for both beginners and advanced traders to deeply analyze the Ethereum futures market.
#Use Cases
1. **Analyzing Trader Sentiment**
- Compare net positions of various trader types (Dealer, Asset Manager, Commercials, etc.) to understand market sentiment.
2. **Identifying Trend Reversals**
- Detect early signs of trend reversals from sudden increases or decreases in long and short positions.
3. **Utilizing Open Interest**
- Monitor the overall trading volume represented by open interest to evaluate entry points or changes in volatility.
4. **Tracking Position Structures**
- Compare positions of leveraged funds and asset managers to analyze risk-on or risk-off environments.
#Key Features
1. **Report Type Selection**
- Financial (Financial Traders)
- Legacy (Legacy Report)
- Open Interest
- Force All (Display all data)
2. **Position Direction Selection**
- Long
- Short
- Net
3. **Visualization of Major Trader Types**
- Financial Traders: Dealer, Asset Manager, Leveraged Funds, Other Reportable
- Legacy: Commercials, Non-Commercials, Small Speculators
4. **Open Interest Visualization**
- Monitor the total open positions in the market.
5. **Flexible Customization**
- Toggle individual trader types on and off.
- Intuitive settings with tooltips for better usability.
#How to Use
1. Add the indicator to your chart and click the settings icon in the top-right corner.
2. Select the desired report type in the "Report Type" field.
3. Choose the position direction (Long/Short/Net) in the "Direction" field.
4. Toggle the visibility of trader types as needed.
#Notes
- Data is provided by the CFTC and is updated weekly. It is not real-time.
- Changes to the settings may take a few seconds to reflect.
Industry Indices ComparisonA dynamic industry sector performance comparison indicator that helps traders and investors track relative strength across different market sectors in real-time.
- Compares up to 5 industry sector ETFs against a benchmark index (default: SPY)
- Displays key metrics including:
* Performance % over selected timeframe
* Relative performance vs benchmark
* Trend direction (▲ up, ▼ down, − neutral)
* Volume in millions (M) of shares traded
- Configurable timeframes: 1D, 1W, 1M, and 3M comparisons
- Color-coded performance indicators (green for outperformance, red for underperformance)
- Customizable table position and text size for optimal chart placement
The indicator helps identify:
1. Sector rotation patterns through relative performance
2. Leading and lagging sectors vs the broader market
3. Volume trends across different sectors
For traders, if you are considering two equally good setups, then choosing the setup belonging to a currently strong sector could be beneficial.

Moving Volume DensityMoving Volume Density (MVD) is a custom TradingView indicator written in Pine Script™ (version 6) that blends volume analysis with price range data to offer a unique perspective on market dynamics. By measuring the total volume over a specified period and relating it to the price range during the same interval, this indicator provides valuable insights into the concentration of trading activity relative to price movement.
Key Features:
User-Defined Period: The indicator uses an input period (default 20 bars) to calculate both the total volume and the price range. This flexibility allows you to tailor the analysis to your preferred timeframe.
Volume Calculation: It computes the sum of the volume over the defined period, capturing the cumulative trading activity.
Price Range Determination: The indicator identifies the highest high and the lowest low within the period, calculating the price range (difference between the two). This range serves as the denominator in the density calculation.
Volume Density Computation: Volume Density is derived by dividing the total volume by the price range. This metric reveals how concentrated the volume is within the observed price movement. To prevent division errors, the calculation returns 'NA' when the price range is zero.
Visual Representation: The resulting Volume Density is plotted as a line on a separate sub-window, making it easy to compare with other indicators or overlay your analysis.
「Moving Volume Density (MVD) インジケーター」は、Pine Script™(バージョン6)で作成されたカスタムインジケーターです。出来高の分析と、指定期間内の高値・安値による価格レンジの情報を組み合わせることで、市場のダイナミクスに対する独自の視点を提供します。指定された期間内の合計出来高とその期間内の価格レンジの比率から、価格変動に対する出来高の集中度を示す指標となります。
主な特徴:
ユーザー定義の期間: インジケーターは、入力された期間(デフォルトは20本のバー)を基に、合計出来高と価格レンジ(最高値と最安値の差)の両方を計算します。これにより、ご自身の分析に合わせた柔軟な設定が可能です。
出来高の計算: 指定期間内の全出来高を合計することで、累積的な取引活動を把握します。
価格レンジの算出: 期間内の最高値と最安値を取得し、その差を価格レンジとして算出。このレンジは、出来高密度の計算における分母として使用されます。
出来高密度の計算: 合計出来高を価格レンジで割ることで、出来高がどれだけ価格変動内に集中しているかを示す「出来高密度」を求めます。なお、価格レンジがゼロの場合はゼロ除算を避けるため「NA」を返す設計となっています。
視覚的な表現: 計算結果はサブウィンドウにラインとしてプロットされ、他のインジケーターとの併用や比較が容易に行えます。

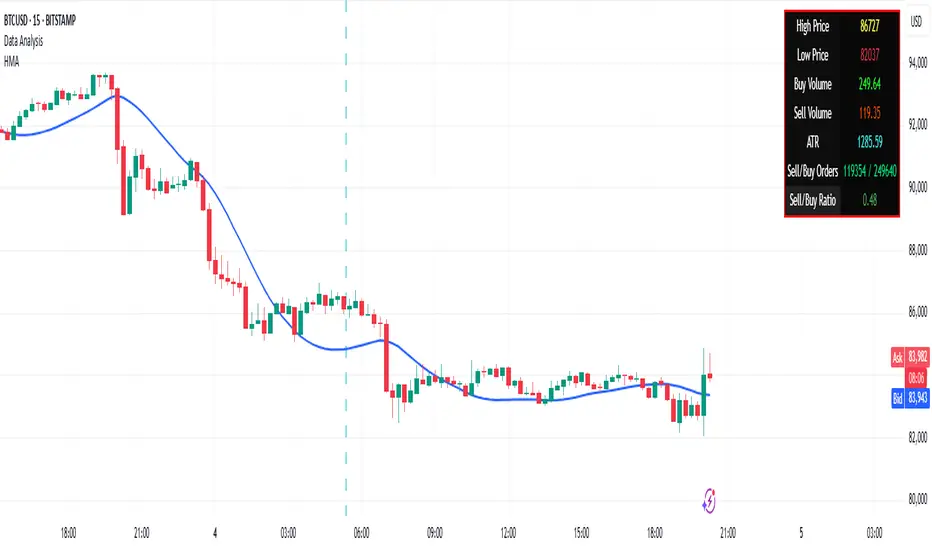
Volume Data Customized TimeframeThe "Volume Data Customized Timeframe" (VolData CTF) indicator provides traders with an enhanced volume analysis tool that aggregates buy and sell volume over a user-defined timeframe. It enables a comparative assessment of bullish and bearish volume trends, offering deeper insights into market sentiment. The indicator features a customizable display table with user-selectable themes and positioning, providing essential volume metrics for improved trading decisions.
1. Introduction:
The "Volume Data Customized Timeframe" indicator is designed to help traders analyze volume trends across different timeframes. It allows users to customize the period for volume calculations, view the ratio of selling to buying volume, and present the data in a user-friendly table format.
2. Features:
Selectable timeframe for volume analysis (default: chart timeframe)
Calculation of bullish (buy) and bearish (sell) volume
Customizable table size, theme, and positioning
Displays key volume metrics:
Total Buy Volume
Total Sell Volume
Sell/Buy Volume Ratio
Analysis period in minutes, days, weeks, or months
3. Indicator Inputs:
Average Volume Lookback (n): Number of bars used to calculate volume statistics.
Select Timeframe: Custom timeframe for volume calculations (leave empty to use the chart's timeframe).
Table Size: Choose from Small, Medium, or Big to adjust text size.
Table Theme: Choose between Light and Dark themes.
Table Position: Place the table in any corner of the chart (top-left, top-right, bottom-left, bottom-right).
4. How It Works:
The indicator retrieves volume data for the selected timeframe.
It aggregates bullish and bearish volume based on the lookback period.
The sell-to-buy volume ratio is calculated and color-coded (green for bullish dominance, red for bearish dominance).
The volume statistics are displayed in a customizable table for easy reference.
5. Interpretation:
Δ BUY VOL: Represents the total volume of bullish (up-closing) bars within the lookback period.
Δ SELL VOL: Represents the total volume of bearish (down-closing) bars within the lookback period.
Δ SELL/Δ BUY: The ratio of bearish to bullish volume; values above 1 indicate more selling pressure, while values below 1 indicate buying dominance.
Period (M/D/W/M): Displays the selected timeframe for volume aggregation.
Valorous VolumesIndicator to mark the significant Volumes:
HVE: Checks if the current volume sets a new overall record.
HVY: Checks if the current volume equals the highest volume over the past one year.
HVQ: Checks if the current volume equals the highest volume over the past three months.

Weighted Directional Movement IndexThe Weighted Directional Movement Index (Weighted-DMI) is an enhanced version of the traditional DMI indicator that incorporates various weighting methods to adjust how +DI and -DI are calculated. This allows traders to refine trend detection based on volume, volatility, or price position within Bollinger Bands.
The indicator can be used on any asset and any timeframe, making it versatile for stocks, forex, crypto, and commodities.
How to Use This Indicator:
Trend Reversals → When the blue line (+DI) crosses above the orange line (-DI), it signals a potential bullish trend.
Bearish Trend Shift → When -DI (orange) crosses above +DI (blue), it indicates a possible bearish trend.
Pullback & Re-Entry → If the lines briefly touch or converge and then separate again, it suggests a pullback and potential trend continuation.
This version of DMI allows you to apply different weightings to the trend calculation, helping filter out noise and improve accuracy.
1️⃣ Weighting Methods:
Users can select from multiple weighting options to refine trend detection based on different market conditions:
✅ None (Default DMI Calculation)
Uses the standard +DI and -DI values with no modifications.
✅ Volume Weighting
Adjusts DMI based on traded volume.
Higher volume days increase the weight of the directional movement, making strong-volume moves more impactful.
✅ Volume Delta Weighting
Uses a basic volume delta approximation ((close - open) * volume).
If the price closes higher, upward moves are weighted more.
If the price closes lower, downward moves get greater weighting.
This method can help highlight aggressive price movements with strong participation.
✅ ATR Ratio Weighting (Volatility-Adjusted)
Adjusts DMI based on how today’s ATR compares to its average ATR.
If volatility is higher than usual, the DI values are boosted, helping emphasize strong trends.
If volatility is low, weighting is reduced, helping avoid false signals in quiet markets.
✅ Bollinger Band Position Weighting
Adjusts DI values based on how far price is from the Bollinger Band midpoint.
If price is above the middle band, +DI is amplified and -DI is dampened (bullish bias).
If price is below the middle band, -DI is amplified and +DI is dampened (bearish bias).
This method is useful for mean-reversion strategies and identifying breakouts from Bollinger Band squeezes.
How This Can Be Useful for Traders:
Trend Followers can use crossovers (+DI/-DI) to confirm trend direction shifts.
Swing Traders can watch for pullbacks and re-entries when the lines touch and diverge again.
Volatility-Based Traders may prefer ATR Ratio weighting to emphasize trends during high-volatility conditions.
Breakout Traders might benefit from Bollinger Band weighting, identifying when price moves away from a consolidation zone.
Volume-Based Traders can use Volume or Volume Delta weighting to prioritize trends with strong participation.
Alerts Included
🚨 Bullish Trend Alert: Triggered when +DI crosses above -DI
🚨 Bearish Trend Alert: Triggered when -DI crosses above +DI
Indicator is much more accurate compared to the traditional Directional Movement Index if you apply the weighting. I personally find the Bollinger Band and then Volume weighting highly useful.
The indicator gives signals a lot earlier compared to other indicators, whilst remaining as accurate as possible.
Higher times frame such as the 15 minute and 1 hour I find work best.

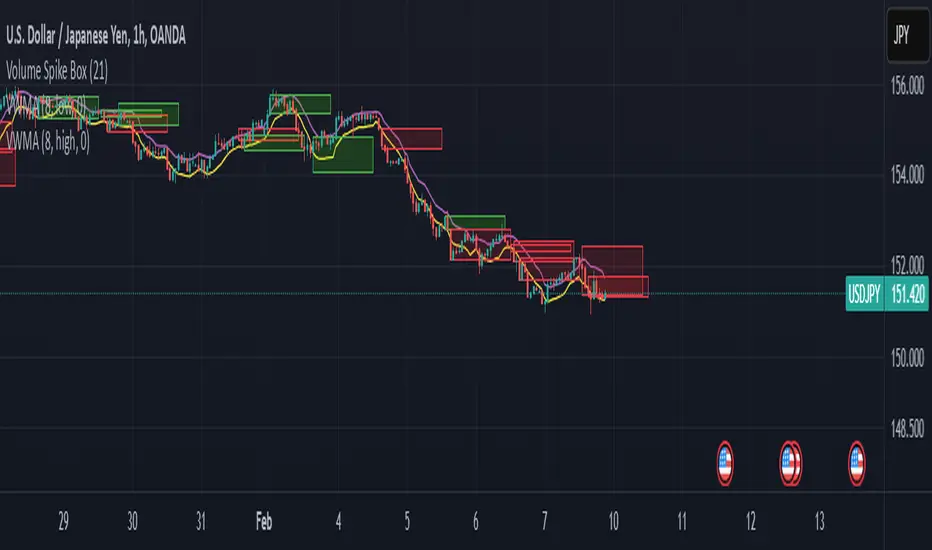
Volume Spike BoxThis indicator highlights the highest volume candlestick in a specified number of bars. It extends for the same length in the future as the specified number of bars for identifying potential support and resistance
Sideways Scalper Peak and BottomUnderstanding the Indicator
This indicator is designed to identify potential peaks (tops) and bottoms (bottoms) within a market, which can be particularly useful in a sideways or range-bound market where price oscillates between support and resistance levels without a clear trend. Here's how it works:
RSI (Relative Strength Index): Measures the speed and change of price movements to identify overbought (above 70) and oversold (below 30) conditions. In a sideways market, RSI can help signal when the price might be due for a reversal within its range.
Moving Averages (MAs): The Fast MA and Slow MA provide a sense of the short-term and longer-term average price movements. In a sideways market, these can help confirm if the price is at the upper or lower extremes of its range.
Volume Spike: Looks for significant increases in trading volume, which might indicate a stronger move or a potential reversal point when combined with other conditions.
Divergence: RSI divergence occurs when the price makes a new high or low, but the RSI does not, suggesting momentum is weakening, which can be a precursor to a reversal.
How to Use in a Sideways Market
Identify the Range: First, visually identify the upper resistance and lower support levels of the sideways market on your chart. This indicator can help you spot these levels more precisely by signaling potential peaks and bottoms.
Peak Signal :
When to Look: When the price approaches the upper part of the range.
Conditions: The indicator will give a 'Peak' signal when:
RSI is over 70, indicating overbought conditions.
There's bearish divergence (price makes a higher high, but RSI doesn't).
Volume spikes, suggesting strong selling interest.
Price is above both Fast MA and Slow MA, indicating it's at a potentially high point in the range.
Action: This signal suggests that the price might be at or near the top of its range and could reverse downwards. A trader might consider selling or shorting here, expecting the price to move towards the lower part of the range.
Bottom Signal:
When to Look: When the price approaches the lower part of the range.
Conditions: The indicator will give a 'Bottom' signal when:
RSI is below 30, indicating oversold conditions.
There's bullish divergence (price makes a lower low, but RSI doesn't).
Volume spikes, suggesting strong buying interest.
Price is below both Fast MA and Slow MA, indicating it's at a potentially low point in the range.
Action: This signal suggests that the price might be at or near the bottom of its range and could reverse upwards. A trader might consider buying here, expecting the price to move towards the upper part of the range.
Confirmation: In a sideways market, false signals can occur due to the lack of a strong trend. Always look for confirmation:
Volume Confirmation: A significant volume spike can add confidence to the signal.
Price Action: Look for price action like candlestick patterns (e.g., doji, engulfing patterns) that confirm the reversal.
Time Frame: Consider using this indicator on multiple time frames. A signal on a shorter time frame (like 15m or 1h) might be confirmed by similar conditions on a longer time frame (4h or daily).
Risk Management: Since this is designed for scalping in a sideways market:
Set Tight Stop-Losses: Due to the quick nature of reversals in range-bound markets, place stop-losses close to your entry to minimize loss.
Take Profit Levels: Set profit targets near the opposite end of the range or use a trailing stop to capture as much of the move as possible before it reverses again.
Practice: Before trading with real money, practice with this indicator on historical data or in a paper trading environment to understand how it behaves in different sideways market scenarios.
Key Points for New Traders
Patience: Wait for all conditions to align before taking a trade. Sideways markets require patience as the price might hover around these levels for a while.
Not All Signals Are Equal: Sometimes, even with all conditions met, the market might not reverse immediately. Look for additional context or confirmation.
Continuous Learning: Understand that this indicator, like any tool, isn't foolproof. Learn from each trade, whether it's a win or a loss, and adjust your strategy accordingly.
By following these guidelines

Normalized OBV with Smoothing OptionsThis script is designed to help traders identify potential long and short entry points using a midline cross strategy based on a Normalized On-Balance Volume (OBV) indicator.
🔹 How It Works
OBV measures volume flow: This indicator tracks whether volume is increasing on up or down moves to help confirm trend strength.
Normalization for consistency: Instead of raw OBV values, this script normalizes OBV over a customizable lookback period, making it easier to compare across different assets and timeframes.
Smoothing for clarity: Users can apply different smoothing methods (SMA, EMA, RMA, or TEMA) to filter out noise and make signals clearer.
⚡ Trading Signals
Midline Cross (50) → Primary Signal for Entries
When OBV crosses above 50, it suggests increasing bullish momentum → Potential Long Entry
When OBV crosses below 50, it signals increasing bearish momentum → Potential Short Entry
Extreme Zones for Confirmation
Above 70 (Overbought): Indicates potential exhaustion of buying pressure.
Below 30 (Oversold): Signals potential exhaustion of selling pressure.
🎯 Why Use This?
Helps identify momentum shifts early.
Works as an additional filter for trend confirmation.
Useful for day traders, swing traders, and algorithmic strategies.

Z PLUS table take profit & Stop lose ### General Description:
The **Z PLUS Take Profit & Stop Loss** indicator is designed to provide traders with a structured approach to setting take profit (TP) and stop loss (SL) levels. It integrates multiple technical analysis techniques, including moving averages, the Relative Strength Index (RSI), and the Average True Range (ATR), to generate signals for potential trade entries and exits.
Key features of this indicator include:
1. **Trend Detection** – Uses a moving average-based strategy combined with RSI confirmation to determine bullish or bearish trends. The system identifies trend reversals and signals potential long (buy) or short (sell) opportunities.
2. **ATR-Based Stop Loss** – Implements an adaptive stop-loss mechanism that adjusts dynamically based on market volatility. This ensures that stop losses are positioned in a way that minimizes premature exits while still protecting against excessive losses.
3. **Swing High & Swing Low Take Profit Levels** – Incorporates a swing high and swing low detection method to identify key levels for taking profits. These levels help traders optimize their risk-reward ratios.
4. **ADX for Trend Strength Confirmation** – Utilizes the Average Directional Index (ADX) to determine the strength of the trend and adjust stop-loss levels accordingly. The indicator differentiates between strong and weak trends to enhance decision-making.
5. **Visual Signals & Color Coding** – Provides visual cues such as colored stop-loss lines and plotted take-profit markers to enhance usability. The indicator dynamically updates these levels based on price movements.
6. **Flexible Configuration** – Allows users to modify key parameters such as ATR length, sensitivity factors, and profit target percentages to tailor the strategy to their specific trading style and market conditions.
This indicator is best suited for traders looking to improve their risk management strategies while maintaining a structured approach to profit-taking and stop-loss placement.

RVMM IndicatorRVMM Indicator
RVMM Indicator combines four indicators: RSI, VWAP, MFI, and Momentum to provide comprehensive technical analysis. This indicator helps traders identify potential market conditions based on the interaction of these indicators.
Components of the RVMM Indicator
1. RSI (Relative Strength Index)
RSI is a momentum indicator that measures the speed and change of price movements. RSI oscillates between 0 and 100 and is used to identify overbought and oversold conditions in the market.
Buy Level: Set at 30. When RSI falls below 30, the market is considered oversold, which may suggest a potential upward trend reversal.
Sell Level: Set at 70. When RSI rises above 70, the market is considered overbought, which may suggest a potential downward trend reversal.
2. VWAP (Volume Weighted Average Price)
VWAP is an indicator that combines price and volume to calculate the average price weighted by volume. VWAP is used to identify support and resistance areas and assess the strength of price movements.
Interpretation: If the price is above the VWAP line, the market is likely in an uptrend. If the price is below the VWAP line, the market is in a downtrend.
3. MFI (Money Flow Index)
MFI is a momentum indicator that considers both price and volume. MFI oscillates between 0 and 100 and is used to identify overbought and oversold conditions in the market.
Oversold Level: Set at 20. When MFI falls below 20, the market is considered oversold.
Overbought Level: Set at 80. When MFI rises above 80, the market is considered overbought.
4. Momentum
Momentum is an indicator that measures the speed of price changes. This indicator is used to identify the strength of a trend.
Interpretation: High momentum values indicate a strong uptrend, while low momentum values indicate a strong downtrend.
How to Use the RVMM Indicator
Interpreting Market Conditions:
RSI : Check RSI values below 30 to identify oversold conditions, and above 70 to identify overbought conditions.
VWAP : Observe whether the price is above or below the VWAP line to determine if the market is in an uptrend or downtrend.
MFI : Check if MFI is below 20 to identify oversold conditions, and above 80 to identify overbought conditions.
Momentum : Analyze momentum values to gauge the strength of the current trend.
Confirming Market Conditions:
Use VWAP, MFI, and Momentum to confirm market conditions identified by RSI.
If the price is above the VWAP line, and MFI and Momentum indicate the strength of the uptrend, the market may be in a bullish phase.
If the price is below the VWAP line, and MFI and Momentum indicate the strength of the downtrend, the market may be in a bearish phase.
Risk Management:
Set stop-loss and take-profit levels based on technical analysis and your trading preferences.
Monitor the market and adjust stop-loss and take-profit levels as market conditions change.
Example of Application
Here is an example of how to use the RVMM Indicator in practice:
Bullish Phase: When the price is above the VWAP line, RSI is below 30, and MFI and Momentum indicate the strength of the uptrend, the market is likely in a bullish phase.
Bearish Phase: When the price is below the VWAP line, RSI is above 70, and MFI and Momentum indicate the strength of the downtrend, the market is likely in a bearish phase.

Zanger Volume Ratio (ZVR)Zanger Volume Ratio (ZVR)
Credits:
Most of the underlying code and logic in this script have been adapted from the work originally published by The_Peaceful_Lizard
Overview
The Zanger Volume Ratio (ZVR) is a powerful indicator designed to reveal market dynamics by comparing current cumulative volume to an average determined over a historical look-back period. It uses the concept of relative volume to not only highlight unusual volume spikes, but also uses color to illustrate how today's trading compares to typical levels. This unique method of volume analysis was popularized by Dan Zanger - a trader known for turning $10,775 into $18,000,000 in less than two years - by identifying key shifts in market interest and volume behavior.
Key Features
Volume Pacing Analysis:
The script calculates a volume delta by comparing the cumulative volume at any given moment to an average derived over a user-defined lookback period (Default 20-day). The resulting percentage difference offers a clear visualization and insight into unusual volume activity.
Dynamic Visual Representation:
Choose between either “Columns” or “Area” plot styles to display the percent difference. Additionally, you have the option to switch between a standard plot or a background color display, with customizable transparency, ensuring the indicator fits seamlessly with your chart’s aesthetics.
Dashboard Integration:
A simple dashboard table is displayed on the chart, showcasing the current ZVR value in real-time. With user-configurable position, text size, alignment, and color options, this feature ensures that the key metric is always visible and easy to interpret.
Why Use the Zanger Volume Ratio?
The ZVR is more than just a volume indicator. It acts as a window into market sentiment by highlighting days when trading interest intensifies. Many traders believe that an unusually high volume ratio may confirm trend strength or signal a reversal, making the indicator a valuable tool when used in conjunction with other technical analysis methods.
Whether you’re monitoring stocks, commodities, or forex markets, the Zanger Volume Ratio offers an accessible yet sophisticated method to decode volume dynamics. Its practical design and real-time visual feedback provide traders of all experience levels with critical data to spot high-potential setups.
Chart Description
First Pane: normal Volume Indicator on the foreground, ZVR as Background colors
Second Pane: ZVR Indicator with Column Style (default)
First panel: normal volume indicator in foreground, ZVR as background colors
Second panel: ZVR indicator with column style (default)
Note: This indicator is intended for use on intraday charts only!

Liquidity ZonesLiquidity Zones Indicator
The Liquidity Zones indicator is a custom Pine Script™ tool designed to identify significant price levels where high trading volume has occurred. These zones often act as support or resistance levels, providing valuable insights for traders.
Key Features:
Window Size: The number of bars to consider for calculating the moving averages and identifying peaks.
Tolerance: The allowable percentage difference to consider peaks as unique.
Number of Peaks: The maximum number of significant peaks to identify.
Minimum Volume: The minimum volume threshold relative to the average volume to consider a peak.
Minimum Range: The minimum price range to consider a peak.
How It Works:
Input Parameters: The user can customize the window size, tolerance, number of peaks, minimum volume, and minimum range.
Moving Averages: The script calculates the simple moving average (SMA) of the volume and closing prices over the specified window.
Peak Identification:
For each bar, the script identifies the bar with the highest volume within the window.
It checks if the volume exceeds the minimum volume threshold.
It determines the peak price based on whether the bar closed higher or lower than it opened.
It ensures the price range of the bar exceeds the minimum range.
It checks if the peak is above the SMA of the closing prices.
It verifies the peak is unique within the specified tolerance.
Plotting Peaks: The identified peaks are plotted on the chart with lines and labels, color-coded based on whether the bar closed higher (green) or lower (red).
This indicator helps traders visualize key liquidity zones, aiding in making informed trading decisions.

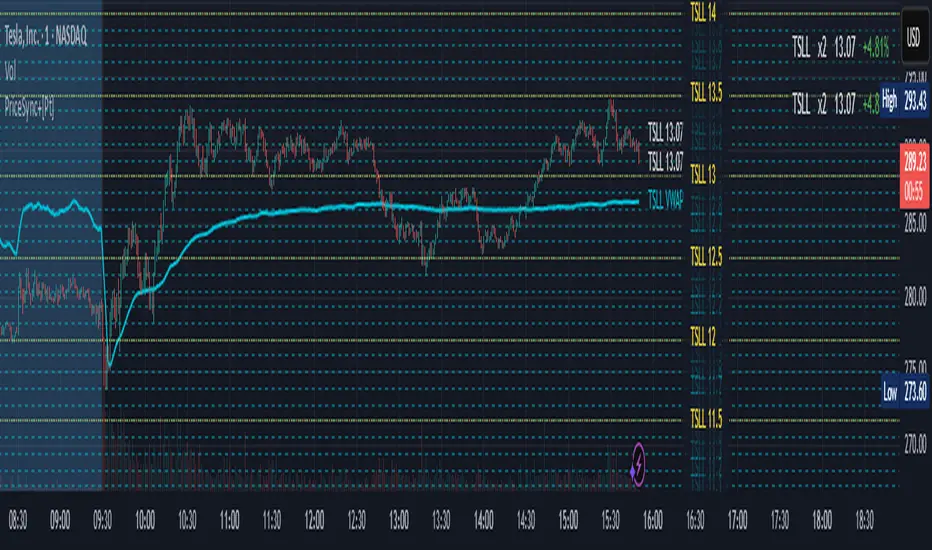
Price Sync Mapper+ [Pt]█ Description:
Price Sync Mapper is a robust TradingView indicator designed to plot correlated price levels of related assets onto the primary chart. This tool is particularly useful for traders who want to trade one asset while monitoring the price action and key levels on another correlated asset, such as leveraged ETFs, inverse ETFs , and other correlated trading pairs. By mapping the price levels of one asset onto another, traders can gain insights into relative price movements and potential trading opportunities.
█ Key Features:
► Multiple Asset Mapping: Supports mapping up to two different tickers onto the primary chart, each with customizable settings, including leverage and inverse properties.
► Dynamic Price Levels: Define the number of price levels to map based on the price movements of the correlated asset, with the scale defined by the multiplier setting.
► VWAP Integration: Option to display Volume Weighted Average Price (VWAP) lines for each mapped ticker, providing additional context on average trading prices. Users can also choose to smooth the VWAP line with a moving average.
► Custom Target Levels: Set and display custom price targets with detailed labels, allowing visualization of key price levels for trading strategies. Users can define labels, tickers, and offsets for up to 8 custom price targets.
► Flexible Update Frequency: Choose to update the indicator on every tick or at the close of each candle, providing flexibility based on trading style and preferences.
► Extended Hours Highlighting: Option to highlight extended trading hours sessions, helping to differentiate between regular and extended trading periods.
► Price Change Display: Displays the percentage price change for each mapped ticker, providing quick insights into the relative performance of correlated assets.
► Table Display: Option to show a table with the current prices, leverage factors, and percentage changes of the mapped tickers, enhancing overall usability and information accessibility. The table can be positioned at various locations on the chart and its font size can be customized.
█ Usage Examples:
► Example 1:
Map the price levels of the Direxion Daily TSLA Bull 2X Shares (TSLL) onto the primary chart of Tesla Inc. (TSLA). This allows traders to see how the leveraged ETF's price movements align with the underlying stock, providing insights into potential trading opportunities based on leverage effects.
► Example 2:
Trade ProShares UltraPro Short QQQ (SQQQ) price levels on Invesco QQQ Trust (QQQ). By mapping the inverse 3x leveraged ETF's price levels onto the underlying asset, traders can set their targets directly on the QQQ chart without flipping between charts and 'guess-timate' which level correspond to which level.
█ Cautionary Note:
Price mapping may not work properly during extended trading hours due to lack of price data, and different trading dynamics and volume.