Squeeze & Breakout Confirmation StrategyThis strategy focuses on identifying periods of low volatility (Bollinger Band Squeeze) and then confirming the direction of the subsequent breakout with momentum, volume, and candle strength.
Concepts Applied: Bollinger Bands (Squeeze), RSI (Momentum), Market Volume (Conviction), Candle Size (Strength)
Buy Signal:
Bollinger Band Squeeze: Look for a period where the Bollinger Bands contract significantly, indicating low volatility and consolidation. The bands should be very close to the price action.
RSI Breakout: After the squeeze, wait for the price to break decisively above the upper Bollinger Band. Simultaneously, the RSI should break above 60 (or even 70), indicating strong bullish momentum.
Volume Surge: The breakout candle should be accompanied by a significant increase in trading volume, ideally above its recent average, confirming strong buying interest.
Strong Bullish Candle: The breakout candle itself should be a large, bullish candle (e.g., a strong green candle with a small upper wick or a bullish engulfing pattern), demonstrating buyer conviction.
Sell Signal (Short):
Bollinger Band Squeeze: Look for a period where the Bollinger Bands contract significantly.
RSI Breakdown: After the squeeze, wait for the price to break decisively below the lower Bollinger Band. Simultaneously, the RSI should break below 40 (or even 30), indicating strong bearish momentum.
Volume Surge: The breakdown candle should be accompanied by a significant increase in trading volume, ideally above its recent average, confirming strong selling interest.
Strong Bearish Candle: The breakdown candle itself should be a large, bearish candle (e.g., a strong red candle with a small lower wick or a bearish engulfing pattern), demonstrating seller conviction.
Volume

OG MACD-Histogram 6/13/5 © 2025🧠 OG MACD Histogram
📈 Developed by: OG WEALTH
📜 Description for TradingView:
This custom MACD Histogram was developed by OG WEALTH to provide elite-level momentum clarity and intraday reversal precision. Unlike traditional MACD tools, the OG MACD Histogram includes:
🔍 Smoother signal line filters for reduced noise
🟢 Dynamic histogram coloring for trend shifts
🛠 Designed for scalping, swing trades, and trend continuation setups
✅ Color Logic:
Dark green: Momentum building (bullish)
Light green: Momentum fading (still bullish, weakening)
Dark red: Bearish pressure increasing
Light red: Bearish exhaustion
🎯 Best For:
Confirming continuation moves
Detecting early reversals during low volume pullbacks
Pairing with EMA stacks (8/21 or 9/20)
📘 How to Use:
Use with trend overlays, such as EMAs or VWAP.
Look for dark green bars rising = possible call setup.
Look for dark red bars rising = possible put setup.
Wait for the histogram color to flip to confirm a momentum shift.
⚠️ Pro Tip: Combine with OG Flow Signal or ATR Trail for sniper-grade entries.


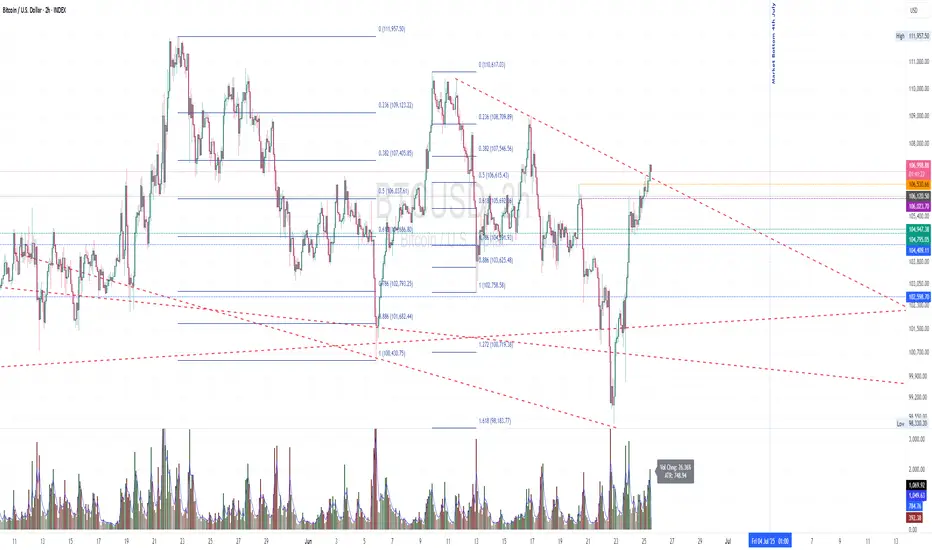
BTC Transaction Indicator Name: "Bitcoin On-Chain Volume & Dynamic Parabolic Curve Signals"
Purpose:
This indicator is designed for Bitcoin traders and long-term holders. It combines the analysis of Bitcoin's on-chain transaction volume with price action to generate "Whale" and "Bear" signals. Additionally, it features a unique dynamic parabolic curve that acts as a visual support line, adapting its visibility based on price interaction with a key Exponential Moving Average (EMA).
Key Components:
On-Chain Volume Analysis:
Utilizes Estimated Transaction Volume (ETRAV) data from the Bitcoin blockchain.
Calculates fast and slow Simple Moving Averages (SMAs) of this volume.
Identifies volume trends (up/down) and significant volume increases/decreases.
Employs fixed thresholds (2,500,000 for low volume and 25,000,000 for high volume) to define key activity levels, similar to how historical on-chain analysis defined accumulation and distribution zones.
Price Action Analysis:
Calculates fast and slow SMAs of the price.
Detects price trends (up/down), recoveries, and declines based on these price SMAs.
"Whale" and "Bear" Signals:
Whale Signals (Buy-side): Generated when there's an upward volume trend, significant volume increase, and a downward price trend followed by price recovery. These indicate potential accumulation phases.
Bear Signals (Sell-side): Generated when there's a downward volume trend, significant volume decrease, and an upward price trend followed by price decline. These indicate potential distribution phases.
Visuals: Both types of signals are plotted as small, colored circles directly on the price chart, with corresponding text labels ("Whale," "Buy," "Bear," "Sell," "Price Recovering," "Price Declining").
Dynamic Parabolic Curve:
Concept: A green parabolic (exponential) curve that serves as a dynamic visual support line.
Activation: The curve starts drawing automatically only when the price crosses over the EMA 500 (Exponential Moving Average of 500 periods). The curve's starting point is set at a user-defined percentage below the EMA 500 value at that exact crossover point.
Visibility: The curve remains visible and continues its trajectory only as long as the price stays above the EMA 500.
Deactivation: The curve disappears instantly if the price falls below or equals the EMA 500. It will only reappear if the price crosses above the EMA 500 again.
Customization: The curve's steepness (Tasa Crecimiento Curva) and its initial distance from the EMA 500 (Inicio Curva % por debajo de EMA500) are adjustable.
Dynamic Label: A "Parabólico" text label is plotted near the center of the active curve segment, with an adjustable vertical offset to ensure it stays visually appealing below the curve.
What is PLOTTED on the chart:
The small, colored circle signals for Whale/Buy and Bear/Sell activity.
The green dynamic parabolic curve.
What is NOT PLOTTED:
EMA 200, EMA 500 lines (though they are calculated internally for logic).
Raw volume data or volume Moving Averages (these are only used for signal calculation, not plotted).
Ideal for:
Bitcoin traders and investors focused on long-term trends and cycle analysis, who want visual cues for accumulation/distribution phases based on on-chain activity, complemented by a unique, dynamically appearing parabolic support curve.
Important Notes:
Relies on the availability of external on-chain data (QUANDL:BCHAIN) within TradingView.
Functions best on a daily timeframe for optimal on-chain data relevance.


NASDAQ Reaper📈 NASDAQ Reaper – The Ultimate Wall Street Killer
The NASDAQ Reaper is a highly advanced Smart Money Concepts (SMC) + Price Action based indicator, engineered for traders who demand accuracy, precision, and real-time edge in the NASDAQ (NQ) market.
This tool was crafted for serious traders looking to dominate the charts with institutional-grade logic, featuring:
✅ Smart Buy/Sell Zones
✅ Opening Range Breakout (ORB) Detection
✅ Volume Confirmation for Strong Entries
✅ Real-Time Entry & Exit Signals
✅ Trend & Momentum Alignment (Multi-Timeframe Logic)
✅ Trailing TP & SL with Visual Feedback
✅ Backtest Module for Strategy Validation
💡 Designed to filter noise and highlight only high-probability setups, NASDAQ Reaper helps you stay one step ahead of retail traders and ride the moves the smart money makes.
🔔 Works best on:
• 5M, 15M, and 30M charts
• London and New York sessions
• Scalping or intraday swing strategy
Whether you're aiming for 50+ tick scalps or sniper entries aligned with trend reversals, this is your secret weapon to level up your trading game.

CM Volume Projection Indicator with ATRCM Volume Projection Indicator
Description:
Elevate your trading analysis with the CM Volume Projection Indicator, a pioneering tool crafted for Trading View charts. This closed-source indicator redefines volume analysis by delivering dynamic, real-time volume forecasts, offering traders a nuanced understanding of market momentum across diverse timeframes and assets.
Key Features:
Dynamic Volume Projection: Utilizes a proprietary algorithm to generate both original and adjusted volume projections, blending current bar elapsed time with historical averages. This creates a tailored forecast that adapts to market conditions, surpassing the limitations of static volume bars.
Percentage-Based Time Adjustment: Incorporates a customizable time factor based on the percentage of remaining candle duration (default 16.67%), enabling precise scaling across timeframes. This innovative approach minimizes overestimation by adjusting projections dynamically as the candle nears completion.
Volume Change Percentage: Introduces a unique metric by comparing current volume to the proportional volume at the same elapsed time in the previous candle, capturing intrabar momentum shifts that traditional indicators, reliant on full candle data, overlook.
Adaptive Spike Factor: Enhances responsiveness by adjusting projections based on volume spikes relative to a moving average, while stabilizing low-volume periods, ensuring reliability in volatile markets.
Fully Customizable Settings: Offers user-controlled adjustments via the strategy bar—including historical averaging period, minimum adjustment factor, spike threshold, moving average type (SMA or EMA), cap threshold percentage, and scaling factor—allowing tailored application without script access.
Visual Customization: Provides color-coded bars and labels for clear interpretation, with optional debug and elapsed time displays for advanced analysis.
How It Works and Adds Value:
The CM Volume Projection Indicator combines a linear scaling of previous candle volume (proportional to elapsed time) with a dynamic cap based on the remaining time percentage, refined by a squared time factor and volatility adjustments. This synergy creates an original intrabar forecasting model that:
Forecasts in Real-Time: Provides forward-looking projections, aiding anticipation of volume trends within the current candle, adaptable to any timeframe.
Delivers Intrabar Precision: Tracks momentum shifts by comparing elapsed-time volumes, offering a granularity static indicators like OBV or volume bars cannot match.
Adapts Across Timeframes: Uses percentage-based caps to ensure consistency, reducing misleading spikes during volatile periods, a step beyond traditional moving average-based tools.
Empowers Strategy: Integrates current volume, moving averages, and adaptive adjustments into a versatile metric, giving traders a strategic edge in diverse market conditions.
Ideal For:
Day traders and scalpers seeking real-time volume insights across short timeframes.
Swing traders analyzing momentum shifts within candles on various durations.
Technical analysts customizing indicators for diverse assets and market environments.
This indicator enhances market analysis as a valuable additional tool, success depends on your strategy and risk management. Explore its potential by adjusting settings via the strategy bar to suit your trading style and leverage its innovative projections in today’s dynamic markets.
Today's Turnover (VWAP × Vol) in CrVWAP (ta.vwap) gives the volume-weighted average price for the current day.
Daily volume is fetched via request.security(..., "D", volume), even if you’re on an intraday chart.
Dividing by 1e7 turns the raw share count into crores.
Multiplying VWAP by that crores-volume gives today’s turnover in “crore-rupees.”
A single label is drawn above the last bar at high + (ticksOffset * mintick).

CVD - Cumulative Volume Delta CandlesCumulative Volume Delta with CVD level Alerts for finding Absorption - statistically the strongest CVD divergence.
Select your CVD levels in Settings > Inputs ("Upper Y Scale Alert Level" / "Lower Y Scale Alert Level") then right click on the green/red levels to create an alert for when CVD crosses.
If CVD hits a new high/low without price doing the same, there is Absorption
Reach out on X @cvolumeprofile to find out on which charts this works best
CVD by @cvolumeprofile also shows candle by candle divergences - highlighted with a green background. This is when a market goes down on more buyers or when a market goes up on more sellers - often signalling market inflection points

NEIROCTO Impulse Watcher (Alert Ready)//@version=5
indicator("NEIROCTO Trap Watcher (Downside Alert)", overlay=true)
// === Условия ===
rsi = ta.rsi(close, 14)
rsi_down = rsi < ta.sma(rsi, 5)
volatility = math.abs(close - close ) / close * 100
volatility_trigger = volatility > 3
volume_sma = ta.sma(volume, 20)
volume_up = volume > volume_sma
// === Сигнал ===
condition = rsi < 40 and rsi_down and volatility_trigger and volume_up
// === Графика ===
bgcolor(condition ? color.new(color.red, 85) : na)
plotshape(condition, title="DROP Signal", location=location.abovebar, color=color.red, style=shape.labeldown, text="⚠️")
// === Алерт ===
alertcondition(condition, title="⚠️ NEIROCTO: Возможен откат!", message="⚠️ NEIROCTO: RSI ↓, Волатильность >3%, объёмы растут. Возможен откат!")

NEIROCTO Impulse Watcher (Alert Ready)//@version=5
indicator("NEIROCTO Combo Watcher (Pump vs Dump)", overlay=true)
// === RSI и его производные ===
rsi = ta.rsi(close, 14)
rsi_sma = ta.sma(rsi, 5)
rsi_up = rsi > rsi_sma
rsi_down = rsi < rsi_sma
// === Волатильность ===
volatility = math.abs(close - close ) / close * 100
volatility_trigger = volatility > 3
// === Объёмы ===
volume_sma = ta.sma(volume, 20)
volume_up = volume > volume_sma
// === Условие пампа ===
pump_condition = rsi > 45 and rsi_up and volatility_trigger and volume_up
// === Условие отката ===
dump_condition = rsi < 40 and rsi_down and volatility_trigger and volume_up
// === Фон ===
bgcolor(pump_condition ? color.new(color.green, 85) : na)
bgcolor(dump_condition ? color.new(color.red, 85) : na)
// === Метки ===
plotshape(pump_condition, title="🚀 PUMP Signal", location=location.belowbar, color=color.green, style=shape.labelup, text="🚀")
plotshape(dump_condition, title="⚠️ DUMP Signal", location=location.abovebar, color=color.red, style=shape.labeldown, text="⚠️")
// === Алерты ===
alertcondition(pump_condition, title="🚀 NEIROCTO: Возможен памп!", message="🚀 RSI ↑, Волатильность >3%, Объёмы высокие — возможен памп!")
alertcondition(dump_condition, title="⚠️ NEIROCTO: Возможен откат!", message="⚠️ RSI ↓, Волатильность >3%, объёмы растут — возможен откат!")

VPOC [cem_trades]This indicator highlights the price level with the highest traded volume within a defined session — known as the Volume Point of Control (VPOC). It's a powerful tool for identifying key support and resistance zones. Fully customizable with session times, timezones, and trading hours (RTH/ETH), making it suitable for both day and swing trading. More information at cem_trades.

NEIROCTO Impulse Watcher (Alert Ready)//@version=5
indicator("NEIROCTO Combo Watcher (Pump vs Dump)", overlay=true)
// === RSI и его производные ===
rsi = ta.rsi(close, 14)
rsi_sma = ta.sma(rsi, 5)
rsi_up = rsi > rsi_sma
rsi_down = rsi < rsi_sma
// === Волатильность ===
volatility = math.abs(close - close ) / close * 100
volatility_trigger = volatility > 3
// === Объёмы ===
volume_sma = ta.sma(volume, 20)
volume_up = volume > volume_sma
// === Условие пампа ===
pump_condition = rsi > 45 and rsi_up and volatility_trigger and volume_up
// === Условие отката ===
dump_condition = rsi < 40 and rsi_down and volatility_trigger and volume_up
// === Фон ===
bgcolor(pump_condition ? color.new(color.green, 85) : na)
bgcolor(dump_condition ? color.new(color.red, 85) : na)
// === Метки ===
plotshape(pump_condition, title="🚀 PUMP Signal", location=location.belowbar, color=color.green, style=shape.labelup, text="🚀")
plotshape(dump_condition, title="⚠️ DUMP Signal", location=location.abovebar, color=color.red, style=shape.labeldown, text="⚠️")
// === Алерты ===
alertcondition(pump_condition, title="🚀 NEIROCTO: Возможен памп!", message="🚀 RSI ↑, Волатильность >3%, Объёмы высокие — возможен памп!")
alertcondition(dump_condition, title="⚠️ NEIROCTO: Возможен откат!", message="⚠️ RSI ↓, Волатильность >3%, объёмы растут — возможен откат!")

Stochastic Money Flow IndexThe Stochastic Money Flow Index (or Stochastic MFI ), is a momentum indicator that combines the Money Flow Index (MFI) and the Stochastic Oscillator to identify overbought and oversold conditions in a market.
It is a variation of the classic Stochastic RSI that uses the MFI rather than the Relative Strength Index (RSI) in its calculation. While the RSI focuses solely on price momentum, the MFI is a volume-weighted indicator, meaning it incorporates both price and volume data.
The Stochastic MFI is intended to provide a more precise and sensitive reading of the MFI by measuring the level of the MFI relative to its range over a specific period.
Settings
Stochastic Settings
%K Length : The number of periods used to calculate the Stochastic. (Default: 14)
%K Smoothing : The SMA length used to 'smooth' the %K line. (Default: 3)
%D Smoothing : The SMA length used to 'smooth' the %D line. (Default: 1)
Money Flow Index Settings
MFI Length : The number of periods used to calculate the Money Flow Index. (Default: 14)
MFI Source : The source used to calculate the Money Flow Index. (Default: close)
Additional Settings
Show Overbought/Oversold Gradients? : Toggle the display of overbought/oversold gradients. (Default: true)

RSI Rising Over 50this is part of some pine script testing I'm doing to begin both dabbling in trading and the UI.

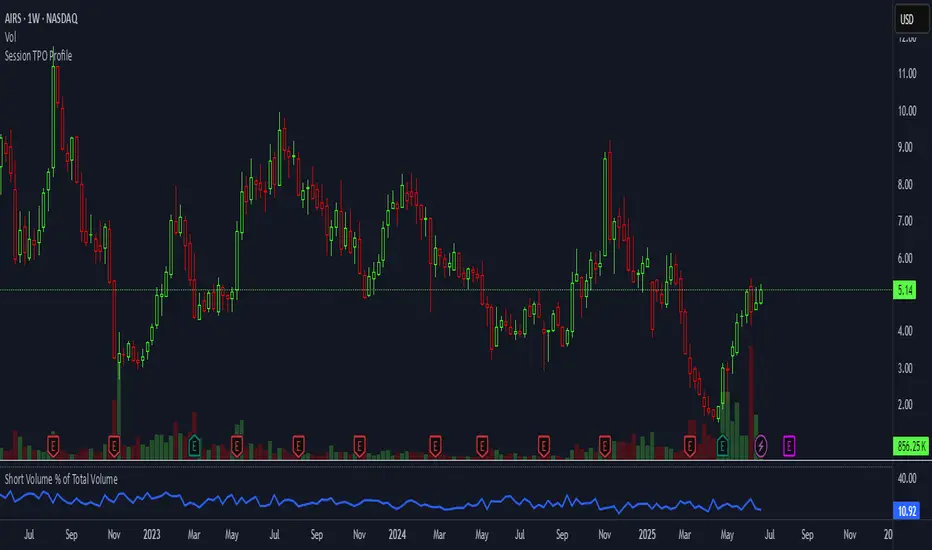
Short Volume % of Total VolumeShort Volume % of Total Volume
This indicator plots the daily short volume as a percentage of total volume for a specific U.S. stock. The short volume is sourced from FINRA’s reported short sale data and is compared against the stock’s total trading volume for the same day.
📊 Use Cases:
Monitor short-selling pressure over time.
Identify spikes in short volume % that may signal increased bearish positioning.
Use in conjunction with price action to gauge sentiment shifts or potential short squeezes.
⚠️ Note: FINRA data reflects activity from FINRA-regulated trading venues only and may not represent full market-wide short activity.
FINRA Short Volume (Daily)FINRA Short Volume (Daily)
This indicator displays the daily short sale volume reported by FINRA for a specific U.S. stock.
🔍 Key Features:
Pulls official FINRA short volume using FINRA: _SHORT_VOLUME
Updates daily, regardless of chart timeframe
Useful for tracking short-selling activity over time
📈 Use Cases:
Identify spikes in short volume that may precede price volatility
Monitor persistent shorting pressure
Combine with price action or other sentiment indicators for squeeze potential
⚠️ Note: This data only includes short sales reported to FINRA — it may not reflect total market-wide short interest. For broader context, use this with other data sources like short interest as a % of float or borrow rates.

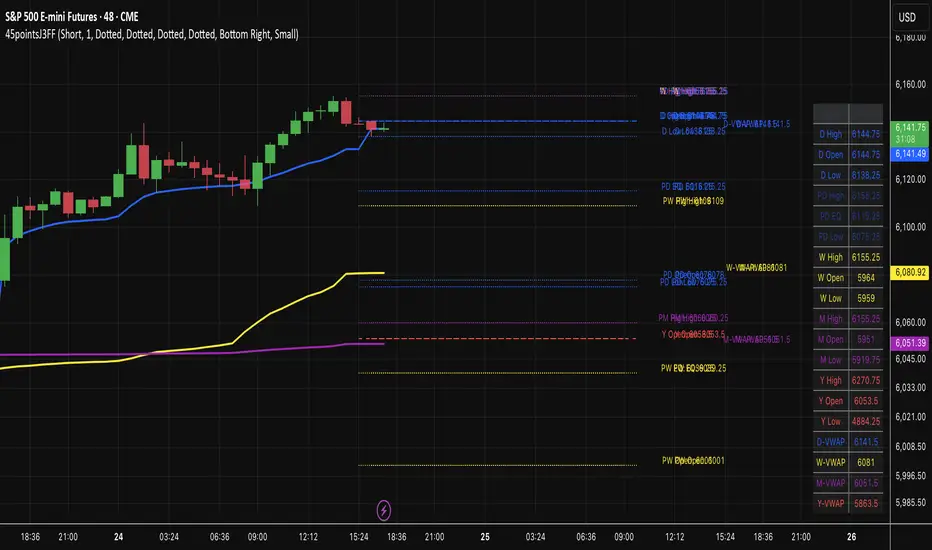
45pointsJ3FF Enhanced# 45pointsJ3FF Enhanced Pine Script Indicator
This is a comprehensive multi-timeframe support and resistance indicator for TradingView that displays key price levels and VWAP (Volume Weighted Average Price) across different time periods.
## 🎯 **Core Functionality**
The indicator plots critical price levels from multiple timeframes simultaneously on your chart, helping traders identify key support/resistance zones and volume-based price levels.
## 📊 **Key Levels Displayed**
### **Multi-Timeframe Levels:**
- **Daily**: Open, High, Low + Previous Day levels
- **Weekly**: Open, High, Low + Previous Week levels
- **Monthly**: Open, High, Low + Previous Month levels
- **Yearly**: Open, High, Low + Previous Year levels
### **Equilibrium Levels:**
- **50% Retracement** levels for previous periods (midpoint between high and low)
- Helps identify potential reversal zones
### **VWAP Levels:**
- **Daily VWAP**: Volume-weighted average for current day
- **Weekly VWAP**: Custom calculation for current week
- **Monthly VWAP**: Custom calculation for current month
- **Yearly VWAP**: Custom calculation for current year
## ⚙️ **Customization Options**
### **Display Controls:**
- **Individual toggles** for each timeframe (Daily/Weekly/Monthly/Yearly)
- **Previous period toggles** to show/hide historical levels
- **Line extension options**: Short, Right, Both
- **Adjustable line width** (1-3 pixels)
### **Visual Customization:**
- **Custom colors** for each timeframe
- **Individual line styles** (Solid, Dashed, Dotted) for each timeframe
- **Price labels** can be toggled on/off for lines and VWAPs
### **Price Table Features:**
- **Comprehensive side table** showing all active level prices
- **4 position options**: Top/Bottom + Left/Right corners
- **3 size options**: Small, Normal, Large
- **Color-coded entries** matching chart lines
- **Auto-filtering**: Only shows enabled levels
## 🔧 **Technical Implementation**
### **VWAP Calculations:**
- **Daily**: Uses built-in `ta.vwap()` function
- **Weekly/Monthly/Yearly**: Custom accumulative calculations using volume-weighted price averaging
- **Timeframe Detection**: Higher timeframe VWAPs only show on intraday charts
### **Higher Timeframe Data:**
- Uses `request.security()` to fetch OHLC data from higher timeframes
- **Lookahead enabled** for real-time updates
- **Previous period data** accessed using ` ` historical referencing
### **Drawing System:**
- **Dynamic line drawing** with customizable extension
- **Smart labeling system** with price formatting
- **Tick-rounded prices** for clean display
- **Performance optimized** with conditional drawing
## 📈 **Trading Applications**
### **Support & Resistance:**
- **Previous day/week/month highs and lows** act as key S/R levels
- **Opening levels** often serve as pivot points
- **Equilibrium levels** (50% retracements) are common reversal zones
### **VWAP Trading:**
- **Daily VWAP**: Intraday trend direction and mean reversion
- **Higher timeframe VWAPs**: Longer-term trend bias
- **Multiple VWAP confluence** creates stronger levels
### **Multi-Timeframe Analysis:**
- **Level confluence**: Multiple timeframes aligning creates stronger zones
- **Trend context**: Higher timeframe levels provide broader market context
- **Entry/Exit planning**: Previous period levels help plan trades
## 🎨 **Visual Organization**
### **Color Coding:**
- **Blue**: Daily levels (default)
- **Yellow**: Weekly levels (default)
- **Purple**: Monthly levels (default)
- **Red**: Yearly levels (default)
- **Transparency**: Previous period levels shown in lighter shades
### **Line Styles:**
- **Solid lines**: Current period highs/lows
- **Dashed lines**: Opening levels
- **Dotted lines**: Previous period levels
- **Thick lines**: VWAP plots (2px width)
## 🔍 **Unique Features**
1. **Custom VWAP calculations** for weekly/monthly/yearly periods
2. **Intelligent table display** that only shows active levels
3. **Comprehensive customization** without overwhelming interface
4. **Performance optimized** with conditional rendering
5. **Professional presentation** with watermark and clean styling
This indicator is particularly valuable for traders who use multiple timeframe analysis and want a clean, organized way to visualize key price levels and volume-based averages all in one tool.
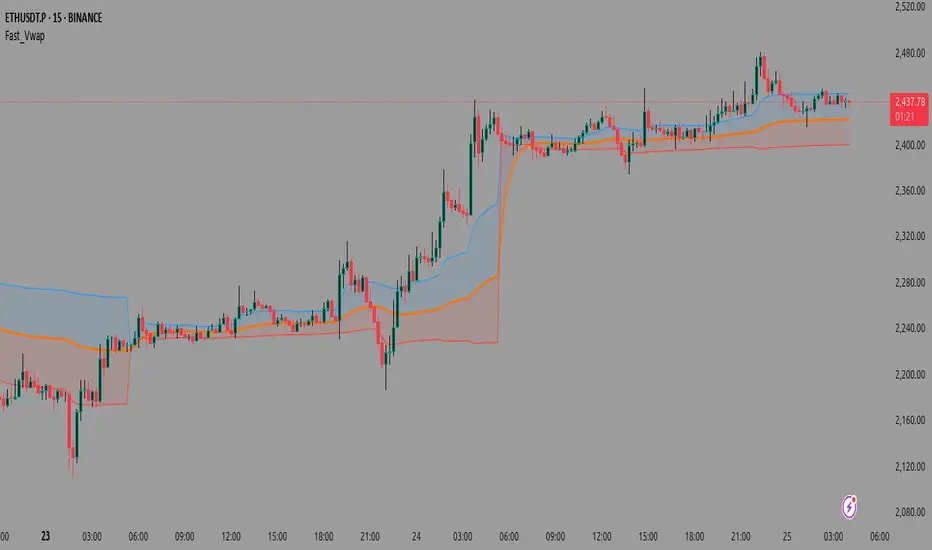
Fast_VwapThis is a Pine Script indicator that calculates and displays Volume Weighted Average Price (VWAP) with several advanced features, including multiple anchoring methods, deviation bands, and optional machine learning enhancements.
Core Components
1. VWAP Calculation
The indicator calculates VWAP using the standard formula:
text
VWAP = Σ(Price × Volume) / Σ(Volume)
Where price can be customized (default is HLC3 - the average of high, low, and close).
2. Anchoring Methods
The indicator offers four ways to reset/start the VWAP calculation:
Session: Resets at the start of each new trading day (most common)
Lowest Low: Resets when a new 10-bar low occurs
Highest High: Resets when a new 10-bar high occurs
Fixed Length: Resets after a specified number of bars (default 20)
3. Deviation Bands
The indicator can show standard deviation bands around the VWAP:
Upper band = VWAP + (Standard Deviation × Multiplier)
Lower band = VWAP - (Standard Deviation × Multiplier)
4. Machine Learning Enhancements
Two optional ML methods can be applied to smooth the VWAP:
Simple Average: Uses an EMA (Exponential Moving Average) of the VWAP
KNN (K-Nearest Neighbors): A simplified implementation that looks at recent values to adjust the current VWAP
How It Works
Inputs: The user can configure all parameters including price source, anchoring method, band settings, and ML options.
Anchoring: The script first determines when to reset the VWAP calculation based on the selected anchoring method.
VWAP Calculation: Using the anchoring points, it calculates the cumulative price×volume and total volume to compute the VWAP and standard deviation bands.
ML Processing: If enabled, the raw VWAP value is smoothed using either a simple EMA or a KNN algorithm that looks at the most similar recent values.
Visualization: The final VWAP line is plotted along with optional deviation bands and colored fills between the bands and VWAP line.
Use Cases
Intraday Trading: When anchored to session, helps identify fair value during the trading day
Swing Trading: When using fixed length or high/low anchoring, can identify support/resistance
Trend Confirmation: Deviation bands help identify overbought/oversold conditions relative to volume-weighted price
The combination of traditional VWAP with machine learning smoothing makes this a unique tool that can potentially reduce noise while maintaining the volume-weighted price information that makes VWAP valuable.
A deviation band is a statistical tool that creates upper and lower boundaries around a central line (in this case, the VWAP) based on how much prices typically vary from that average.
How It Works
Standard Deviation Calculation
The indicator calculates how much prices deviate from the VWAP:
Measures the "spread" or volatility of prices around the VWAP
Uses the mathematical formula for standard deviation
Creates bands at a specific distance from the VWAP line
What Deviation Bands Tell You
Statistical Significance
~68% of price action typically stays within 1 standard deviation
~95% stays within 2 standard deviations
When price touches the bands, it's statistically "unusual"
Trading Signals
Price hits upper band: Potentially overbought, consider selling
Price hits lower band: Potentially oversold, consider buying
Price stays within bands: Normal price action
Price breaks outside bands: Strong momentum move
Dynamic Adjustment
High volatility periods: Bands automatically widen
Low volatility periods: Bands automatically narrow
Volume changes: Affects both VWAP and band calculations
Orange Line (Default)
What it is: The main VWAP line with machine learning enhancement
Purpose: This is the core signal line - the Volume Weighted Average Price that's been processed through your selected ML method (Simple Average, KNN, or None)
Blue Line (Default)
What it is: Upper deviation band
Purpose: Shows potential resistance level - when price reaches this band, it may indicate overbought conditions
Red Line (Default)
What it is: Lower deviation band
Purpose: Shows potential support level - when price reaches this band, it may indicate oversold conditions
High–Low Range % Rolling Countshows the average daily % range of a fund.
note/disclaimer - I'm new to trading, Pinescripts and tradingview. If using this, exercise caution.

DTC_SVVolume is the footprint of smart money.
This indicator helps you track it with surgical precision. DTC_SV is a powerful, all-in-one volume intelligence tool built for traders who rely on volume expansion, institutional candle footprints, and relative strength logic.
Inspired by the Traders Reality framework, this script detects and color-codes vector candles (high-volume momentum candles), provides real-time stats in a clean dashboard, and offers bar-by-bar context for smart money involvement.
🧠 Core Features
📊 Smart Vector Candle Detection
Automatically highlights candles with 1.5x or 2x relative volume.
Dynamic color coding (Green, Red, Blue, Purple) to indicate type and strength.
🟦 Live Volume Histogram with MA
Volume bars show strength and weakness with clarity.
20-period volume moving average line included for trend context.
💬 Volume Labels on Bars
Real-time labels on each vector candle showing absolute volume and % above average.
Helps you see the punch behind every candle.
📈 Advanced Dashboard Panel (Top/Bottom Corner)
Stay data-aware without clutter. The live table shows:
✅ RVOL % – Relative Volume of the current bar.
📈 Daily Trend – Based on position vs 10 & 20 EMA (from daily timeframe).
🔍 Distance to Daily EMA 10/20 – % deviation from mean.
♻️ Avg Recovery of Last 5 Vectors – A key signal for mean reversion plays.
📊 Session RVOL – How current volume stacks up within today’s session.
🧮 Avg Volume of Last 10 Vector Candles – Measures momentum strength.
🔁 Today vs Previous Day Total Volume – Real-time market participation pulse.
🚀 Use Cases
Identify true institutional candles during fake retail moves.
Measure when liquidity is being injected, not just price pushing.
Gauge whether current moves are sustainable or manipulated.
Time your entries using volume spikes + price action confluence.
Track vector candle recovery zones and exhaustion potential.

Rolling VWAP LevelsRolling VWAP Levels Indicator
Overview
Dynamic horizontal lines showing rolling Volume Weighted Average Price (VWAP) levels for multiple timeframes (7D, 30D, 90D, 365D) that update in real-time as new bars form.
Who This Is For
Day traders using VWAP as support/resistance
Swing traders analyzing multi-timeframe price structure
Scalpers looking for mean reversion entries
Options traders needing volatility bands for strike selection
Institutional traders tracking volume-weighted fair value
Risk managers requiring dynamic stop levels
How To Trade With It
Mean Reversion Strategies:
Buy when price is below VWAP and showing bullish divergence
Sell when price is above VWAP and showing bearish signals
Use multiple timeframes - enter on shorter, confirm on longer
Target opposite VWAP level for profit taking
Breakout Trading:
Watch for price breaking above/below key VWAP levels with volume
Use 7D VWAP for intraday breakouts
Use 30D/90D VWAP for swing trade breakouts
Confirm breakout with move beyond first standard deviation band
Support/Resistance Trading:
VWAP levels act as dynamic support in uptrends
VWAP levels act as dynamic resistance in downtrends
Multiple timeframe VWAP confluence creates stronger levels
Use standard deviation bands as additional S/R zones
Risk Management:
Place stops beyond next VWAP level
Use standard deviation bands for position sizing
Exit partial positions at VWAP levels
Monitor distance table for overextended moves
Key Features
Real-time Updates: Lines move and extend as new bars form
Individual Styling: Custom colors, widths, styles for each timeframe
Standard Deviation Bands: Optional volatility bands with custom multipliers
Smart Labels: Positioned above, below, or diagonally relative to lines
Distance Table: Shows percentage distance from each VWAP level
Alert System: Get notified when price crosses VWAP levels
Memory Efficient: Automatically cleans up old drawing objects
Settings Explained
Display Group: Show/hide labels, font size, line transparency, positioning
Individual VWAP Groups: Color, line width (1-5), line style for each timeframe
Standard Deviation Bands: Enable bands with custom multipliers (0.5, 1.0, 1.5, 2.0, etc.)
Labels Group: Position (8 options including diagonal), custom text, price display
Additional Info: Distance table, alert conditions
Technical Implementation
Uses rolling arrays to maintain sliding windows of price*volume data. The core calculation function processes both VWAP and standard deviation efficiently. Lines are created dynamically and updated every bar. Memory management prevents object accumulation through automatic cleanup.
Best Practices
Start with 7D and 30D VWAP for most strategies
Add 90D/365D for longer-term context
Use standard deviation bands when volatility matters
Position labels to avoid chart clutter
Enable distance table during high volatility periods
Set alerts for key VWAP level breaks
Market Applications
Forex: Major pairs during London/NY sessions
Stocks: Large cap names with good volume
Crypto: Bitcoin, Ethereum, major altcoins
Futures: ES, NQ, CL, GC with continuous volume
Options: Use SD bands for strike selection and volatility assessment

MA of TurnoverThis indicator helps in low liquity markets.
Very simple formula: Volume MA * price * %
Last day results is max suggested entry value.
