IOS XAUUSD Intraday Edge SignalsIOS XAUUSD Intraday Edge Signals
Premium Multi-Factor Indicator for Gold Scalpers
Author: Ivan Olivier Schmid
Telegram: @schmidmobile
What the Indicator Does
IOS XAUUSD Intraday Edge Signals blends institutional-grade price references with fast momentum timing to deliver clear, one-sided Long or Short entries on the 1- and 5-minute XAUUSD chart.
Core modules
Anchored VWAP (daily reset) – defines fair value & bias
Price > VWAP ⇒ bullish bias - Price < VWAP ⇒ bearish bias
ADX + DI Filter – measures trend strength & direction
Long: ADX > 15 and +DI > –DI
Short: ADX > 15 and –DI > +DI*
Stochastic RSI Trigger – times momentum reversals
Long: %K crosses %D up below 20
Short: %K crosses %D down above 80*
ATR Engine – auto SL/TP & risk templates
SL = 1.5 × ATR - TP = RR × SL (default RR = 2:1)
Signal Cool-down – minimum bars between signals; prevents spam
Dashboard – live status of all filters and last signal
Key Features
Zero conflicting arrows – never Long and Short at the same time
Adaptive thresholds – tighten or relax ADX, RSI or cool-down in seconds
Visual risk management – SL/TP labels appear automatically
Alert-ready – one-click alerts for Long and Short events, ideal for webhooks
Session presets – ready-made settings for Asia, Europe and US trading hours
Recommended Session Presets
Asia Session (00:00 – 06:00 UTC)
ADX threshold: 12
Signal cool-down: 2 bars
ATR multiplier (SL): 1.3
Risk/Reward: 1.5 : 1
Lower volatility – narrower stops, faster exits
Europe Session (06:00 – 12:00 UTC)
ADX threshold: 15
Signal cool-down: 3 bars
ATR multiplier (SL): 1.5
Risk/Reward: 2 : 1
Highest liquidity – baseline defaults
US Session (12:00 – 20:00 UTC)
ADX threshold: 18
Signal cool-down: 3 – 4 bars
ATR multiplier (SL): 1.7
Risk/Reward: 2 : 1
Stronger spikes – slightly wider stops
How to apply a preset
Open the Inputs tab after adding the script.
Adjust ADX Threshold, Signal Cool-down, ATR Multiplier and Risk/Reward as shown above.
(Optional) Enable the time filter and set Start / End Hour for the chosen session.
Quick-Start Guide
Add to chart on XAUUSD 1- or 5-minute timeframe.
Wait for a single green (Long) or red (Short) arrow.
Calculate position size: Risk % ÷ (Entry price – SL).
Close trade at TP or trail once price moves +1 × ATR in your favor.
Tip: Combine the arrows with major support/resistance or order-flow levels for higher conviction.
Best-Practice Checklist
Back-test or replay 20 trading days before going live.
Avoid trading during high-impact US news (NFP, CPI, FOMC).
Do not set ADX below 10 – invites range noise.
Keep cool-down ≥ 2 bars to curb over-trading.
Disclaimer
IOS XAUUSD Intraday Edge Signals is provided for educational purposes only. Trading leveraged products involves substantial risk and may not suit every investor. Past performance is no guarantee of future results. Trade only with capital you can afford to lose and follow your own risk management rules.
Happy trading and see you on Telegram!
XAUUSD

My scriptTrend gold signal Ema strategy
The system finds the best entries for a trade. Use in gold, all numbers have been customized for it.
Functional
T2 trend gold is the second version of my trading system. Be sure to check out the first part! This system gives a signal earlier.
Key signals
Buy -----> Blue triangle to buy
Sell -----> Red triangle to sell
Remarks
I personally tested this system on my own trading and it helps me find entries for deals. The main thing is, if consolidation has begun, turn off the system, because the trading range is small at this moment, use oscillators

Trend Impulse Channels (Zeiierman)Jun 8
Support & Resistance Aries
This indicator automatically identifies support and resistance levels based on the highest and lowest closing prices within a configurable period.
How it works:
The user sets a calculation period (default is 20 candles).
The indicator plots:
Green line = Support: lowest closing price within the period.
Red line = Resistance: highest closing price within the period.
Adjustable parameter:
Calculation Period (1 to 200): defines how many candles are used to find the price extremes.
Purpose:
Helps users quickly visualize dynamic support and resistance zones that adjust as price evolves, making it easier to identify areas for potential entries, exits, and stop placements.
Important:
This indicator should not be used as a standalone buy or sell signal, nor as a trend confirmation tool on its own.
It is recommended to use it in combination with other technical analysis tools such as MACD, RSI, Volume, Moving Averages, among others, for a more complete market view.
Disclaimer:
Investing involves financial risk. Be cautious with both profits and losses. Always define a stop loss to avoid larger losses if the trend reverses.
One of the golden rules in trading is: a trader should not lose more than 3% to 5% of their capital per trade. Protecting your capital should always be the priority.

XAUUSD 5m Aggressive Buy/Sell Signals v2This indicator is designed to help identify potential short-term entry points for XAUUSD on the 5-minute timeframe.
It highlights aggressive buy and sell opportunities with clear on-chart markers and background cues for visual clarity.
Alerts are also integrated to notify traders in real-time when a potential signal occurs.
⚠️ Disclaimer : This tool is for informational and educational purposes only and is not financial advice. Always conduct your own analysis before making any trading decisions.

Gold Power Hours Strategy📈 Gold Power Hours Trading Strategy
Trade XAUUSD (Gold) or XAUEUR during the most volatile hours of the New York session, using momentum and trend confirmation, with session-specific risk/reward profiles.
✅ Strategy Rules
🕒 Valid Trading Times ("Power Hours"):
Trades are only taken during high-probability time windows on Tuesdays, Wednesdays, and Thursdays , corresponding to key New York session activity:
Morning Session:
08:00 – 11:00 (NY time)
Afternoon Session:
12:30 – 16:00
19:00 – 22:00
These times align with institutional activity and economic news releases.
📊 Technical Indicators Used:
50-period Simple Moving Average (SMA50):
Identifies the dominant market trend.
14-period Relative Strength Index (RSI):
Measures market momentum with session-adjusted thresholds.
🟩 Buy Signal Criteria:
Price is above the 50-period SMA (bullish trend)
RSI is greater than:
60 during Morning Session
55 during Afternoon Session
Must be during a valid day (Tue–Thu) and Power Hour session
🟥 Sell Signal Criteria:
Price is below the 50-period SMA (bearish trend)
RSI is less than:
40 during Morning Session
45 during Afternoon Session
Must be during a valid day and Power Hour session
🎯 Trade Management Rules:
Morning Session (08:00–11:00)
Stop Loss (SL): 50 pips
Take Profit (TP): 150 pips
Risk–Reward Ratio: 1:3
Afternoon Session (12:30–16:00 & 19:00–22:00)
Stop Loss (SL): 50 pips
Take Profit (TP): up to 100 pips
Risk–Reward Ratio: up to 1:2
⚠️ TP is slightly reduced in the afternoon due to typically lower volatility compared to the morning session.
📺 Visuals & Alerts:
Buy signals: Green triangle plotted below the bar
Sell signals: Red triangle plotted above the bar
SMA50 line: Orange
Valid session background: Light pink
Alerts: Automatic alerts for buy/sell signals

XAUUSD M5 Pullback BUYSELL/TPSL [Condark]English: Input Settings Explanation
Strategy Settings (การตั้งค่ากลยุทธ์)
Timeframe คุมเทรนด์ (Trend Control Timeframe): The higher timeframe used to determine the main trend direction. Default is "15" (15 minutes).
EMA Length (EMA Length for Trend): The length of the Exponential Moving Average on the higher timeframe. A higher value means a slower, more stable trend line. Default is 50.
EMA สำหรับ Pullback (M5) (EMA for Pullback): The length of the EMA on the current chart (M5) that the price is expected to pull back to. Default is 21.
TDI Settings (การตั้งค่า TDI)
RSI Period: The lookback period for the RSI calculation, which forms the basis of the TDI's green line. Default is 13.
Signal Line Period (เส้นแดง): The period for the Simple Moving Average of the RSI line, creating the TDI's red "Signal Line". Default is 7.
Additional Filters Settings (การตั้งค่า Filters เพิ่มเติม)
เปิด/ปิด Proximity Filter (Enable/Disable Proximity Filter): A switch to turn the filter on or off. When on, it only allows trades that occur close to the higher timeframe's EMA.
ระยะห่างที่ยอมรับได้ (ATR Multiplier) (Acceptable Distance): Defines "how close" the entry must be to the M15 EMA. The distance is calculated as this number multiplied by the current ATR value. A smaller number means the entry must be very close. Default is 2.5.
เปิด/ปิด ADX/DI Filter (Enable/Disable ADX/DI Filter): A switch to turn the trend strength filter on or off.
ADX Trend Level (ต้องสูงกว่า): The minimum ADX value required to consider the market as "trending". A trade will only be taken if the ADX is above this level. Default is 20.
เปิด/ปิด ATR Volatility Filter (Enable/Disable ATR Volatility Filter): A switch to turn the volatility filter on or off. When on, it prevents trades if the market volatility is too low. Default is off.
ATR Filter MA Length: The period for the moving average of the ATR. A trade is only allowed if the current ATR is higher than its moving average.
TP/SL Settings (การตั้งค่า TP/SL)
ATR Length: The lookback period for the Average True Range (ATR) calculation, used to determine the size of the TP and SL. Default is 14.
ตัวคูณ Stop Loss (จาก ATR) (Stop Loss Multiplier): This number is multiplied by the ATR value to set the Stop Loss distance from the entry price. Default is 1.5.
ตัวคูณ Take Profit (จาก ATR) (Take Profit Multiplier): This number is multiplied by the ATR value to set the Take Profit distance from the entry price. Default is 2.5.
Table Settings (การตั้งค่าตาราง)
ตำแหน่งตาราง (Table Position): Allows you to choose where the performance summary table is displayed on the chart (e.g., top-right, bottom-left).
ภาษาไทย: คำอธิบายการตั้งค่า (Settings)
การตั้งค่ากลยุทธ์ (Strategy Settings)
Timeframe คุมเทรนด์: ไทม์เฟรมที่ใช้ในการกำหนดทิศทางของเทรนด์หลัก ค่าเริ่มต้นคือ "15" (15 นาที)
EMA Length: ความยาวของเส้น EMA ในไทม์เฟรมที่ใช้คุมเทรนด์ ยิ่งค่ามากเส้นเทรนด์จะยิ่งช้าและนิ่งขึ้น ค่าเริ่มต้นคือ 50
EMA สำหรับ Pullback (M5): ความยาวของเส้น EMA ในกราฟปัจจุบัน (M5) ซึ่งเป็นเส้นที่คาดหวังให้ราคาย่อตัวกลับมาหา ค่าเริ่มต้นคือ 21
การตั้งค่า TDI (TDI Settings)
RSI Period: จำนวนแท่งเทียนย้อนหลังที่ใช้ในการคำนวณ RSI ซึ่งเป็นพื้นฐานของเส้นสีเขียวใน TDI ค่าเริ่มต้นคือ 13
Signal Line Period (เส้นแดง): จำนวนแท่งเทียนที่ใช้ในการคำนวณเส้นค่าเฉลี่ย (SMA) ของ RSI เพื่อสร้างเป็นเส้น Signal Line (สีแดง) ของ TDI ค่าเริ่มต้นคือ 7
การตั้งค่า Filters เพิ่มเติม (Additional Filters Settings)
เปิด/ปิด Proximity Filter: ปุ่มสำหรับเปิดหรือปิดฟิลเตอร์ เมื่อเปิดใช้งาน จะอนุญาตให้เทรดเฉพาะเมื่อจุดเข้าอยู่ใกล้กับเส้น EMA ของ M15 เท่านั้น
ระยะห่างที่ยอมรับได้ (ATR Multiplier): กำหนดว่าจุดเข้าต้อง "ใกล้แค่ไหน" กับเส้น EMA M15 โดยระยะห่างจะคำนวณจากค่านี้คูณกับค่า ATR ปัจจุบัน ยิ่งค่าน้อยแปลว่าต้องยิ่งใกล้มาก ค่าเริ่มต้นคือ 2.5
เปิด/ปิด ADX/DI Filter: ปุ่มสำหรับเปิดหรือปิดฟิลเตอร์ความแรงของเทรนด์
ADX Trend Level (ต้องสูงกว่า): ค่า ADX ขั้นต่ำที่บ่งบอกว่าตลาดกำลัง "มีเทรนด์" การเทรดจะเกิดขึ้นต่อเมื่อค่า ADX สูงกว่าระดับนี้ ค่าเริ่มต้นคือ 20
เปิด/ปิด ATR Volatility Filter: ปุ่มสำหรับเปิดหรือปิดฟิลเตอร์ความผันผวน เมื่อเปิดใช้งาน จะป้องกันการเทรดหากตลาดมีความผันผวนต่ำเกินไป (ค่าเริ่มต้นคือปิด)
ATR Filter MA Length: จำนวนแท่งเทียนที่ใช้คำนวณเส้นค่าเฉลี่ยของ ATR การเทรดจะเกิดขึ้นต่อเมื่อค่า ATR ปัจจุบันสูงกว่าค่าเฉลี่ยของมัน
การตั้งค่า TP/SL (TP/SL Settings)
ATR Length: จำนวนแท่งเทียนย้อนหลังที่ใช้ในการคำนวณ Average True Range (ATR) เพื่อนำไปกำหนดขนาดของ TP และ SL ค่าเริ่มต้นคือ 14
ตัวคูณ Stop Loss (จาก ATR): ตัวเลขนี้จะถูกนำไปคูณกับค่า ATR เพื่อกำหนดระยะ Stop Loss จากราคาเข้า ค่าเริ่มต้นคือ 1.5
ตัวคูณ Take Profit (จาก ATR): ตัวเลขนี้จะถูกนำไปคูณกับค่า ATR เพื่อกำหนดระยะ Take Profit จากราคาเข้า ค่าเริ่มต้นคือ 2.5
การตั้งค่าตาราง (Table Settings)
ตำแหน่งตาราง: ให้คุณสามารถเลือกตำแหน่งที่จะแสดงตารางสรุปผลการดำเนินงานบนหน้าจอได้ (เช่น มุมบนขวา, มุมล่างซ้าย)

Automated Scalping Signals with TP/SL Indicator [QuantAlgo]🟢 Overview
The Automated Scalping Signals with Take Profit & Stop Loss Indicator is a multi-timeframe trading system that combines market structure analysis with directional bias filtering to identify potential scalping opportunities. It detects Points of Interest (POI) including Fair Value Gaps (FVG) and Order Blocks (OB) while cross-referencing entries with higher timeframe exponential moving average positioning to create systematic entry conditions.
The indicator features adaptive timeframe calculations that automatically scale analysis periods based on your chart timeframe, maintaining consistent analytical relationships across different trading sessions. It provides integrated trade management with stop loss calculation methods, configurable risk-reward ratios, and real-time performance tracking through dashboard displays showing trade statistics, bias direction, and active position status.
This advanced system is designed for low timeframe trading, typically performing optimally on 1 to 15-minute charts across popular instruments such as OANDA:XAUUSD , CME_MINI:MES1! , CME_MINI:ES1! , CME_MINI:MNQ1! , CBOT_MINI:YM1! , CBOT_MINI:MYM1! , BYBIT:BTCUSDT.P , BYBIT:ETHUSDT.P , or any asset and timeframe of your preference.
🟢 How It Works
The indicator operates using a dual-timeframe mathematical framework where higher timeframe exponential moving averages establish directional bias through cross-over analysis, while simultaneously scanning for specific market structure patterns on the POI timeframe. The timeframe calculation engine uses multiplication factors to determine analysis periods, ensuring the bias timeframe provides trend context while the POI timeframe captures structural formations.
The structural analysis begins with FVG detection, which systematically scans price action to identify imbalances where gaps exist between consecutive candle ranges with no overlapping wicks. When such gaps are detected, the algorithm measures their size against minimum thresholds to filter out insignificant formations. Concurrently, OB recognition analyzes three-candle sequences, examining specific open/close relationships that indicate potential institutional accumulation zones. Once these structural patterns are identified, the algorithm cross-references them against the higher timeframe bias direction, creating a validation filter that only permits entries aligned with the prevailing EMA cross-over state. When price subsequently intersects these validated POI zones, entry signals generate with the system calculating entry levels at zone midpoints, then applying the selected stop loss methodology combined with the configured risk-reward ratio to determine take profit placement.
To mirror realistic trading conditions, the indicator incorporates configurable slippage calculations that account for execution differences between intended and actual fill prices. When trades reach their take profit or stop loss levels, the algorithm applies slippage adjustments that worsen the exit prices in a conservative manner - reducing take profit fills and increasing stop loss impact. This approach ensures backtesting results reflect more realistic performance expectations by accounting for spread costs, market volatility during execution, and liquidity constraints that occur in live trading environments.
It also has a performance dashboard that continuously tracks and displays comprehensive trading metrics:
1/ Bias TF / POI TF: Displays the calculated timeframes used for bias analysis and POI detection, showing the actual periods (e.g., "15m / 5m") that result from the multiplier settings to confirm proper adaptive timeframe selection
2/ Bias Direction: Shows current market trend assessment (Bullish, Bearish, or Sideways) derived from EMA cross-over analysis to indicate which trade directions align with prevailing momentum
3/ Data Processing: Indicates how many price bars have been analyzed by the system, helping users verify if complete historical data has been processed for comprehensive strategy validation
4/ Total Trades: Displays the cumulative number of completed trades plus any active positions, providing volume assessment for statistical significance of other metrics
5/ Wins/Losses: Shows the raw count of profitable versus unprofitable trades, offering immediate insight into strategy effectiveness frequency
6/ Win Rate: Reveals the percentage of successful trades, where values above 50% generally indicate effective entry timing and values below suggest strategy refinement needs
7/ Total R-Multiple: Displays cumulative risk-reward performance across all trades, with positive values demonstrating profitable system operation and negative values indicating net losses requiring analysis
8/ Average R Win/Loss: Shows average risk-reward ratios for winning and losing trades separately, where winning averages approaching the configured take profit ratio indicate minimal slippage impact while losing averages near -1.0 suggest effective stop loss execution
9/ TP Ratio / Slippage: Displays the configured take profit ratio and slippage settings with calculated performance impact, showing how execution costs affect actual versus theoretical returns
10/ Profit Factor: Calculates the ratio of total winning amounts to total losing amounts, where values above 1.5 suggest robust profitability, values between 1.0-1.5 indicate modest success, and values below 1.0 show net losses
11/ Maximum Drawdown: Tracks the largest peak-to-trough decline in R-multiple terms, with smaller negative values indicating better capital preservation and risk control during losing streaks
🟢 How to Use
Start by applying the indicator to your chart and observe its performance across different market conditions to understand how it identifies bias direction and POI formations. Then navigate to the settings panel to configure the Bias Timeframe Multiplier for trend context sensitivity and POI Timeframe Multiplier for structural analysis frequency according to your trading preference and objectives.
Next, fine-tune the EMA periods in Bias Settings to control trend detection sensitivity and select your preferred POI types based on your analytical preference. Proceed to configure your Risk Management approach by selecting from the available stop loss calculation methods and setting the Take Profit ratio that aligns with your risk tolerance and profit objectives. Complete the setup by customizing Display Settings to control table visibility and trade visualization elements, adjusting UI positioning and colors for optimal chart readability, then activate Alert Conditions for automated notifications on trade entries, exits, and bias direction changes to support systematic trade management.
🟢 Examples
OANDA:XAUUSD
CME_MINI:MES1!
CME_MINI:ES1!
CME_MINI:MNQ1!
CBOT_MINI:YM1!
BYBIT:BTCUSDT.P
BINANCE:SOLUSD
*Disclaimer: Past performance is not indicative of future results. None of our statements, claims, or signals from our indicators are intended to be financial advice. All trading involves substantial risk of loss, not just upside potential. Users are highly recommended to carefully consider their financial situation and risk tolerance before trading.

RSI Multi-Timeframe Dashboard by giua64)### Summary
This is an advanced dashboard that provides a comprehensive overview of market strength and momentum, based on the Relative Strength Index (RSI) analyzed across 6 different timeframes simultaneously (from 5 minutes to the daily chart).
The purpose of this script is to offer traders an immediate and easy-to-read summary of market conditions, helping to identify the prevailing trend direction, overbought/oversold levels, and potential reversals through divergence detection. All of this is available in a single panel, eliminating the need to switch timeframes on your main chart.
### Key Features
* **Multi-Timeframe Analysis:** Simultaneously monitors the 5m, 15m, 30m, 1H, 4H, and Daily timeframes.
* **Scoring System:** Each timeframe is assigned a score based on multiple RSI conditions (e.g., above/below 50, overbought/oversold status, direction) to quantify bullish or bearish strength.
* **Aggregated Signal:** The dashboard calculates a total percentage score and provides a clear summary signal: **LONG**, **SHORT**, or **WAIT**.
* **Divergence Detection:** Automatically identifies Bullish and Bearish divergences between price and RSI for each timeframe.
* **Non-Repainting Option:** In the settings, you can choose to base calculations on the close of the previous candle (`Use RSI on Closed Candle`). This ensures that past signals (like status and score) do not change, providing more reliable data for analysis.
* **Fully Customizable:** Users can modify the RSI period, overbought/oversold thresholds, divergence detection settings, and the appearance of the table.
### How to Read the Dashboard
The table consists of 6 columns, each providing specific information:
* **% (Total Score):**
* **Header:** Shows the overall strength as a percentage. A positive value indicates bullish momentum, while a negative value indicates bearish momentum. The background color changes based on intensity.
* **Rows:** Displays the numerical score for the individual timeframe.
* **RSI:**
* **Header:** The background color indicates the average of all RSI values. Green if the average is > 50, Red if < 50.
* **Rows:** Shows the real-time RSI value for that timeframe.
* **Signal (Status):**
* **Header:** This is the final operational signal. It turns **🟢 LONG** when bullish strength is high, **🔴 SHORT** when bearish strength is high, and **⚪ WAIT** in neutral conditions.
* **Rows:** Describes the RSI status for that timeframe (e.g., Bullish, Bearish, Overbought, Oversold).
* **Dir (Direction):**
* **Header:** Displays an arrow representing the majority direction across all timeframes.
* **Rows:** Shows the instantaneous direction of the RSI (↗️ for rising, ↘️ for falling).
* **Diverg (Divergence):**
* Indicates if a bullish (`🟢 Bull`) or bearish (`🔴 Bear`) divergence has been detected on that timeframe.
* **TF (Timeframe):**
* Indicates the reference timeframe for that row.
### Advantages and Practical Use
This tool was created to solve a common problem: the need to analyze multiple charts to understand the bigger picture. With this dashboard, you can:
1. **Confirm a Trend:** A predominance of green and a "LONG" signal provides strong confirmation of bullish sentiment.
2. **Identify Weakness:** Red signals on higher timeframes can warn of an impending loss of momentum.
3. **Spot Turning Points:** A divergence on a major timeframe can signal an excellent reversal opportunity.
### Originality and Acknowledgements
This script is an original work, written from scratch by giua64. The idea was to create a comprehensive and visually intuitive tool for RSI analysis.
Any feedback, comments, or suggestions to improve the script are welcome!
**Disclaimer:** This is a technical analysis tool and should not be considered financial advice. Always do your own research and backtest any tool before using it in a live trading environment.
Script open-source
In pieno spirito TradingView, il creatore di questo script lo ha reso open-source, in modo che i trader possano esaminarlo e verificarne la funzionalità. Complimenti all'autore! Sebbene sia possibile utilizzarlo gratuitamente, ricorda che la ripubblicazione del codice è soggetta al nostro Regolamento.
giua64
borsamercati.it – Educational tools by giua64
Anche su:
Declinazione di responsabilità
Le informazioni ed i contenuti pubblicati non costituiscono in alcun modo una sollecitazione ad investire o ad operare nei mercati finanziari. Non sono inoltre fornite o supportate da TradingView. Maggiori dettagli nelle Condizioni d'uso.

Market Killer & Scalper [SUKH-X] [Only 1% can understand it]Advanced XAUUSD Scalper Pro - Complete Trading System
🎯 Overview
The Advanced XAUUSD Scalper Pro is a comprehensive Pine Script indicator specifically designed for scalping XAUUSD (Gold/USD) on 5-minute timeframes. This professional-grade tool combines multiple technical analysis methods to provide high-accuracy entry and exit signals for short-term traders.
🔧 Core Features
Dynamic Support & Resistance System
Automatic Pivot Detection : Identifies key pivot highs and lows based on customizable strength settings
Visual S&R Boxes : Color-coded boxes highlighting support (green) and resistance (red) zones
Adaptive Levels : Maintains up to 10 dynamic S&R levels that update in real-time
Breakout Detection : Alerts when price breaks through significant levels with volume confirmation
Advanced Breakout Analysis [ /i]
Threshold-Based Detection : Customizable breakout percentage thresholds (default 0.02%)
Volume Confirmation : Optional volume spike validation for stronger signals
Consolidation Zones : Identifies sideways markets before potential breakouts
Multi-Timeframe Support : Works across different timeframes with adaptive parameters
### **Reversal Signal System**
- **RSI Integration**: 14-period RSI with customizable overbought (70) and oversold (30) levels
- **Stochastic Oscillator**: Dual %K and %D lines for momentum confirmation
- **Candlestick Patterns**: Incorporates bullish/bearish candlestick analysis
- **Divergence Detection**: Identifies potential trend reversals at key levels
### **Scalping Optimization**
- **Dual EMA System**: Fast EMA (8) and Slow EMA (21) for trend direction
- **ATR-Based Calculations**: Dynamic stop-loss and take-profit levels using Average True Range
- **Trend Strength Filter**: Background coloring indicates strong uptrends (green) and downtrends (red)
- **Noise Reduction**: Filters out false signals in choppy market conditions
## 📊 **Visual Elements**
### **Signal Types**
- **🟢 Green Triangle Up**: Long entry signal with confluence of bullish factors
- **🔴 Red Triangle Down**: Short entry signal with bearish confirmation
- **🟡 Yellow X**: Exit signals for both long and short positions
- **Blue/Orange Lines**: Fast and slow EMAs for trend visualization
### **Information Dashboard**
- **Real-Time Statistics**: Live price, ATR, RSI, trend direction, and volume status
- **S&R Level Counter**: Shows active support and resistance levels
- **Consolidation Indicator**: Identifies low-volatility periods
- **Market Condition**: Current trend strength and direction
## ⚙️ **Customizable Parameters**
### **Support & Resistance Settings**
- S&R Period: 5-100 (default: 20)
- S&R Strength: 1-5 (default: 2)
- Maximum S&R Levels: 3-10 (default: 5)
- Visual box display toggle
### **Breakout Configuration**
- Breakout threshold: 0.01%-0.1% (default: 0.02%)
- Volume confirmation on/off
- Minimum consolidation bars: 5-50 (default: 10)
### **Reversal Settings**
- RSI period: 2-50 (default: 14)
- Overbought/oversold levels: customizable
- Stochastic %K and %D periods
### **Scalping Parameters**
- Fast EMA: 3-20 (default: 8)
- Slow EMA: 10-50 (default: 21)
- ATR period and multiplier for risk management
## 🚀 **Best Practices**
### **Optimal Setup**
- **Timeframe**: 5-minute charts (can be adapted for 1m, 3m, 15m)
- **Instrument**: XAUUSD (Gold/USD) - specifically optimized for gold volatility
- **Session**: Best during London and New York overlaps
- **Market Conditions**: Most effective in trending and breakout scenarios
### **Risk Management**
- Use ATR multiplier (1.5x default) for stop-loss placement
- Take profit at 2:1 or 3:1 risk-reward ratios
- Enable volume confirmation for higher-probability trades
- Monitor news events that affect gold prices
### **Signal Interpretation**
- **Strong Signals**: Multiple confirmations (trend + S&R + momentum)
- **Weak Signals**: Single indicator signals during consolidation
- **Exit Strategy**: Use yellow X markers or when price hits opposite EMA
## 📈 **Performance Features**
### **Accuracy Enhancements**
- **Multi-Confirmation System**: Requires multiple technical factors to align
- **False Signal Filtering**: Reduces noise through trend and volume filters
- **Adaptive Levels**: S&R levels update based on recent price action
- **Market Structure Analysis**: Considers overall market context
### **Alert System**
- **Entry Alerts**: Long and short signal notifications
- **Exit Alerts**: Position closure recommendations
- **Level Alerts**: S&R breakout notifications
- **Custom Messages**: Detailed alert information including price and ATR
## 🎨 **Visual Customization**
- Toggle all visual elements on/off
- Customizable colors and transparency
- Adjustable line widths and styles
- Statistics table positioning
- Background coloring for trend identification
## 📋 **Technical Requirements**
- Pine Script v5 compatible
- Maximum 500 boxes and lines for optimal performance
- Real-time data feed recommended
- Works on TradingView Pro, Pro+, and Premium plans
## 🔍 **Unique Selling Points**
1. **XAUUSD Specific**: Optimized parameters for gold's unique volatility patterns
2. **Scalping Focus**: Designed for quick entries and exits with minimal lag
3. **Complete System**: Combines trend, momentum, and S&R analysis
4. **Professional Grade**: Institutional-quality technical analysis
5. **User-Friendly**: Intuitive visual signals with comprehensive customization
## ⚠️ **Disclaimer**
This indicator is a technical analysis tool designed to assist in trading decisions. It should not be used as the sole basis for trading decisions. Always combine with proper risk management, fundamental analysis, and market awareness. Past performance does not guarantee future results. Trading gold (XAUUSD) involves substantial risk and may not be suitable for all investors.
## 🏷️ **Tags**
`XAUUSD` `Gold` `Scalping` `Support` `Resistance` `Breakout` `Reversal` `EMA` `RSI` `Stochastic` `ATR` `Volume` `Alerts` `5min` `Intraday`

Gold DynamicThis is a custom-made TradingView indicator designed to visualize "sequential price levels" based on a user-defined step value, dynamically centered around the current gold price. It draws horizontal lines at multiples of a chosen step value (e.g., 7) both above and below the current price.
Key Features:
Dynamic Price Levels: Lines are calculated relative to the live price, providing relevant support/resistance or structural levels for the current market context.
Customizable Step Value: Easily adjust the Sequence Step Value (e.g., 7, 10, 14) from the indicator settings to align with your trading theory.
Adjustable Line Count: Control the Number of Lines ABOVE Current Price and Number of Lines BELOW Current Price to show as many or as few levels as desired.
Extended Lines: Horizontal lines extend indefinitely to both the left (historical data) and right (future projection) for comprehensive visualization.
Clear Price Labels: Each line displays its exact price value, positioned at the far right of the chart for quick reference.
Customizable Appearance: Modify line color, width, and style (solid, dotted, dashed) to suit your charting preferences.
Exact Values: All displayed price labels are rounded to whole numbers for clear, precise visualization without decimal values.
This indicator is ideal for traders looking to apply a fixed-step price theory to their gold analysis.

Overlay Candles with MultiplierCompare Price Movements Between Two Symbols Visually
This indicator overlays the price action of a secondary symbol on your current chart, allowing you to directly compare the relative movement of two instruments — for example, Gold (XAUUSD) and Silver (XAGUSD).
By applying a customizable multiplier to the overlayed symbol's price data, the indicator scales the second symbol to fit your chart, making it easier to visually identify correlations, divergences, or relative strength between the two assets.
You can choose between candle or line display styles for the overlay, and easily switch between two distinct color schemes for better clarity and personal preference.
Use Cases:
Compare precious metals like Gold and Silver side-by-side.
Visualize correlations between related forex pairs or indices.
Monitor relative price movement for pairs trading or spread strategies.

CHN BUY SELL with EMA 200Overview
This indicator combines RSI 7 momentum signals with EMA 200 trend filtering to generate high-probability BUY and SELL entry points. It uses colored candles to highlight key market conditions and displays clear trading signals with built-in cooldown periods to prevent signal spam.
Key Features
Colored Candles: Visual momentum indicators based on RSI 7 levels
Trend Filtering: EMA 200 confirms overall market direction
Signal Cooldown: Prevents over-trading with adjustable waiting periods
Clean Interface: Simple BUY/SELL labels without clutter
How It Works
Candle Coloring System
Yellow Candles: Appear when RSI 7 ≥ 70 (overbought momentum)
Purple Candles: Appear when RSI 7 ≤ 30 (oversold momentum)
Normal Candles: All other market conditions
Trading Signals
BUY Signal: Triggered when closing price > EMA 200 AND yellow candle appears
SELL Signal: Triggered when closing price < EMA 200 AND purple candle appears
Signal Cooldown
After a BUY or SELL signal appears, the same signal type is suppressed for a specified number of candles (default: 5) to prevent excessive signals in ranging markets.
Settings
RSI 7 Length: Period for RSI calculation (default: 7)
RSI 7 Overbought: Threshold for yellow candles (default: 70)
RSI 7 Oversold: Threshold for purple candles (default: 30)
EMA Length: Period for trend filter (default: 200)
Signal Cooldown: Candles to wait between same signal type (default: 5)
How to Use
Apply the indicator to your chart
Look for yellow or purple colored candles
For LONG entries: Wait for yellow candle above EMA 200, then enter BUY when signal appears
For SHORT entries: Wait for purple candle below EMA 200, then enter SELL when signal appears
Use appropriate risk management and position sizing
Best Practices
Works best on timeframes M15 and higher
Suitable for Forex, Gold, Crypto, and Stock markets
Consider market volatility when setting stop-loss and take-profit levels
Use in conjunction with proper risk management strategies
Technical Details
Overlay: True (plots directly on price chart)
Calculation: Based on RSI momentum and EMA trend analysis
Signal Logic: Combines momentum exhaustion with trend direction
Visual Feedback: Colored candles provide immediate market condition awareness

Adaptive Multi-TF Indicator Table with Presets giua64📌 Script Name:
Adaptive Multi-Timeframe Indicator Table with Presets — giua64
📄 Description:
This script displays an adaptive multi-timeframe dashboard that summarizes the signals of three key technical indicators:
Moving Averages (MAs), Relative Strength Index (RSI), and MACD.
It provides a fast and visually intuitive overview of market conditions across five timeframes (5m, 15m, 30m, 1h, 4h), helping traders quickly identify potential directional biases (e.g., bullish, bearish, or neutral) based on either predefined presets or fully manual settings.
🧰 Preset Configurations:
You can choose between four trading styles, each with optimized indicator parameters:
Scalping
• MAs: 5 / 10 (Fast), 20 / 50 (Slow)
• RSI: 7 periods | Overbought: 70 | Oversold: 30
• MACD: 5 / 13 | Signal: 3
Intraday
• MAs: 9 / 21 (Fast), 50 / 100 (Slow)
• RSI: 14 periods | Overbought: 60 | Oversold: 40
• MACD: 12 / 26 | Signal: 9
Swing
• MAs: 10 / 20 (Fast), 50 / 200 (Slow)
• RSI: 14 periods | Overbought: 65 | Oversold: 35
• MACD: 12 / 26 | Signal: 9
Manual
• Full custom control over all indicator settings.
🛠️ All settings can be customized manually from the options panel, including the exact MA periods, RSI thresholds, and MACD structure.
🧠 How It Works:
For each timeframe, the script evaluates:
MA crossover status (two levels):
The first symbol refers to the crossover of the fast MAs
The second symbol refers to the crossover of the slow MAs
🟢 = Bullish crossover
🔴 = Bearish crossover
➖ = Flat or no clear signal
RSI Direction:
↑ = RSI above upper threshold (potential overbought)
↓ = RSI below lower threshold (potential oversold)
→ = RSI in neutral range
MACD Line vs Signal Line:
↑ = MACD line is above signal line (bullish)
↓ = MACD line is below signal line (bearish)
→ = Flat or neutral signal
Each signal is assigned a numerical score. These are aggregated per timeframe to compute a combined score that reflects the directional bias for that specific time window.
🧠 Adaptive Logic by Asset:
This script is designed to be universally compatible across all asset types — including forex, crypto, stocks, indices, and commodities.
Thanks to its multi-timeframe nature and flexible indicator presets, the script automatically adjusts its behavior based on the asset selected, ensuring relevant analysis without requiring manual recalibration.
🧾 Summary Table Output:
At the bottom of the dashboard, a combined sentiment is displayed for:
3TF → 5m, 15m, 30m
4TF → Adds 1h
5TF → Adds 4h
Each row shows:
Signal → LONG / SHORT / NEUTRAL
Confidence (%) → Based on score aggregation and signal consistency
📌 Customization Options:
Table Position: Left, Right, or Center
Text Size: Small, Normal, or Large
Full Manual Configuration: All MA, RSI, and MACD parameters can be adjusted as needed
⚠️ Disclaimer:
This script is for educational and analytical purposes only.
It does not constitute financial advice or guarantee any trading results.
Always do your own research and apply responsible risk management.

CANX Gold (XAUUSD) $5 Psychological Levels© CanxStixTrader
FOR GOLD ONLY
--------------------------------
This is a vary simple yet powerful indicator based on the psychological levels that retail traders use to trade gold and institutions in turn target these levels.
--------------------------------
HOW TO USE
Once the trend has been determined then this simple indicator can be used to target the pull backs for the sniper entries you want.
-TIP, pair with other indicators for optimal entries and trend identification. We recommend the 1 minute time frame for entries and a momentum indicator for extra confirmation.
--------------------------------
The indicator draws lines every 50 pips or $5 on the chart and is customizable to your preference.
Like always, Keep it simple!
© CanxStixTrader

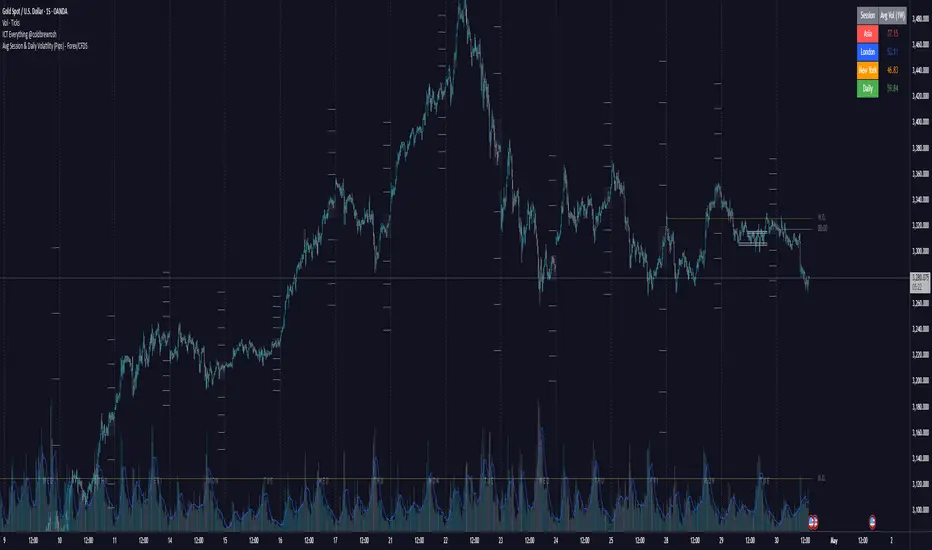
Avg Session & Daily Volatility (Pips) - Forex/CFDS🔍 Overview
The Avg Session & Daily Volatility (Pips) indicator measures the average High–Low range (volatility) of three major Forex sessions—Asia, London, New York—and the entire trading day, then displays the results in a compact overlay table.
⚙️ Key Features
Session Windows
Asia: Default 23:00 – 07:00 server time
London: 07:00 – 16:00
New York: 13:00 – 22:00
Daily Range
– Tracks the full High–Low from midnight to midnight.
Flexible Lookback
– Choose 1W / 2W / 4W / 8W (≈ 5 / 10 / 20 / 40 trading days)
Pip Conversion
Forex Pairs: 1 pip = 0.0001 → (ticks / mintick) / 10
XAU/USD (Gold): 1 pip = 1 USD → direct price difference
Custom Styling
– Pick your own colors per session & daily
– Table position: Left/Center/Right × Top/Middle/Bottom
📈 Benefits & Use Cases
Optimal Stop-Loss & Take-Profit
Gauge each session’s typical movement to size SL/TP appropriately.
Intraday Performance Check
Compare your real-time trade swings against historical averages.
Risk Management
Align position sizes with average volatility to control risk.
Multi-Asset Support
Works seamlessly for major Forex pairs and Gold (XAU/USD) thanks to smart pip logic.
🚀 How It Works
Session Scanning – Continuously tracks the session’s high and low.
Array Storage – At session close, calculates range in pips and pushes it into a rolling buffer.
Averaging – Computes the arithmetic mean of the last N values (your chosen lookback).
Visualization – Paints the four averages in a neat 2×5 table overlay.
👍 Pro Tips
Check Your Time Zone – Make sure chart timezone matches your broker’s session times.
Tweak Lookback – Use shorter windows (1W) to react quickly; longer (4–8W) to smooth out outliers.
Combine Indicators – Pair with volume or trend tools for deeper insights.
Happy Trading,
Riseofatrader
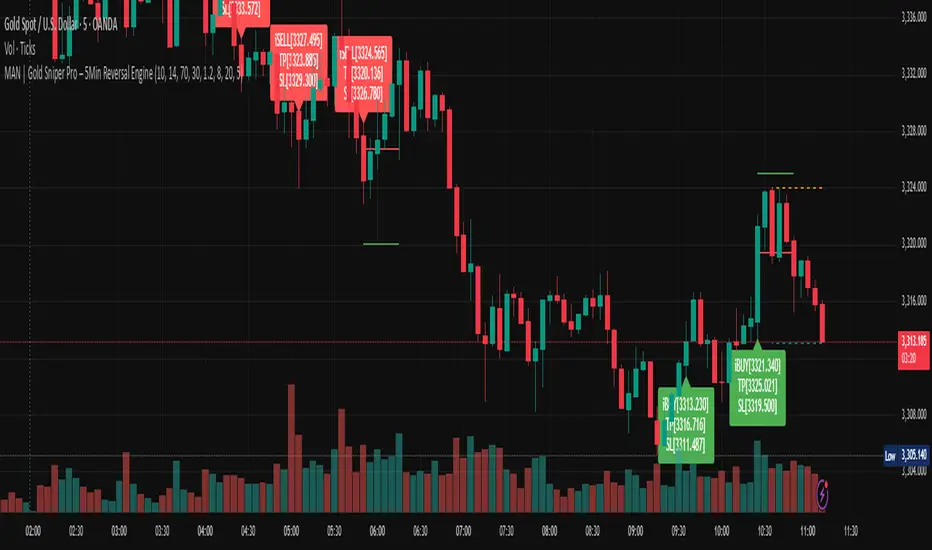
MAN | Gold Sniper Pro – 5Min Reversal EngineThis advanced scalping indicator is designed for high-precision entries and exits on the 5-minute timeframe, combining price action, volume analytics, and momentum filtering.
🔍 Core Features:
Price Action Engine: Detects powerful bullish and bearish engulfing patterns, enhanced with ATR-based body size filters to avoid weak signals.
Dynamic Support/Resistance Zones: Automatically tracks recent high/low zones to confirm trade validity and prevent chasing trades.
Smart RSI Filter: Filters trades based on momentum to avoid buying overbought or selling oversold conditions.
Volume Spike + OBV Filter: Confirms entries with strong volume spikes and OBV (On-Balance Volume) alignment, improving signal quality.
Time-based Session Filter: Optional filter to restrict signals to high-liquidity market hours (configurable).
Auto TP/SL Levels: Calculates Take Profit and Stop Loss dynamically using ATR multipliers, with customizable multipliers per timeframe.
Clear Entry Labels + Optional TP/SL Lines: Visual labels for each signal, with the option to show SL/TP as horizontal lines for precision monitoring.
Real-time Alerts: Set alerts for BUY and SELL conditions — stay informed and trade instantly.
📈 Recommended Usage:
Optimized for Gold (XAUUSD) on the 5-minute chart, but configurable for any fast-moving asset.
Ideal for scalpers and intraday traders seeking high-quality, low-latency entries with built-in protection mechanisms.
Works well in trending or range-bound conditions, thanks to volume and price action synergy.
⚙️ Customizable Parameters:
RSI length & thresholds
ATR-based SL/TP multipliers
Volume spike threshold
Session window
TP/SL visibility toggle
🟢 Built by traders, for traders.
Sharpen your edge with this smart, visual, and momentum-aware scalping tool.
Gold/Silver RatioOverview
This indicator displays the Gold/Silver Ratio by dividing the price of gold (XAUUSD) by the price of silver (XAGUSD) on the same timeframe. It is a widely used tool in macroeconomic and precious metals analysis, helping traders and investors evaluate the relative value of gold compared to silver.
📈 What it does
Plots the ratio between gold and silver prices as a line on the chart.
Displays two key horizontal levels:
Overbought level at 90 (dashed red line).
Oversold level at 70 (dashed green line).
Highlights the chart background to show extreme conditions:
Red shading when the ratio exceeds 90 (gold is likely overvalued relative to silver).
Green shading when the ratio drops below 70 (silver is likely overvalued relative to gold).
🧠 How to Use
When the ratio exceeds 90, it suggests that gold may be overbought or silver may be undervalued. Historically, these have been good times to consider shifting exposure from gold to silver.
When the ratio falls below 70, it may indicate silver is overbought or gold is undervalued.
This tool is best used in conjunction with technical analysis, macroeconomic trends, or RSI/Bollinger Bands applied to the ratio.
⚙️ Inputs
This version of the script uses OANDA's XAUUSD and XAGUSD pairs for spot gold and silver prices. You may edit the request.security() calls to change data sources (e.g., FXCM, FOREXCOM, or CFD tickers from your broker).
✅ Best For:
Macro traders
Commodity investors
Ratio and spread traders
Long-term portfolio reallocators

RSI MTF CorrelationRSI MTF Correlation
This indicator detects unusual movement between RSI values on the current timeframe and a higher timeframe (multi-timeframe), generating volatility alerts or identifying potential market phase shifts.
Applying for FX:XAUUSD and BINANCE:BTCUSD.P
How To Read Data
How To Use
When RSI volatility across multiple timeframes behaves abnormally, bar colors shift from gray to orange, blue, or purple, indicating increasing levels of volatility.
Once volatility returns to a normal state (gray), it may signal a potential reversal trade opportunity.
Alert is available in the indicator.
How to Trade
Set alerts using the built-in functions of this indicator, or monitor the chart manually.
When abnormal RSI volatility occurs, bar colors will shift from gray to orange, blue, or purple, reflecting increasing levels of volatility.
Wait until a green or red bar appears to trigger a trade:
Green bar: signals a potential buy setup
Red bar: signals a potential sell setup
Stop-Loss (SL): place below the nearest swing low (for buy) or above the nearest swing high (for sell), typically 20–30 pips.
Take-Profit (TP): follow a Risk-to-Reward ratio of 1:1, 1:2, or ideally 1:5 or higher depending on market structure.
Breakeven adjustment is optional and can be applied according to your trading style and market conditions.
Notice:
Follow the higher timeframe trend for more reliable signals.
Strictly adhere to risk and money management principles.
If you experience 2–3 consecutive stop-losses, this may indicate a trend shift or an unclear market condition. In such cases, wait for a new trend to form before re-entering.
How It Works
Under normal market conditions, RSI movements across different timeframes show a relatively correlated pattern.
When this correlation breaks (abnormal RSI volatility), it often signals a possible trend shift in the lower timeframe.
To preserve the dominant trend, the higher timeframe typically pulls the lower one back in line, resulting in sharp V-shaped price movements (flash dumps/pumps).
This behavior helps us identify and isolate abnormal corrections, enabling high-probability trade setups.
However, in some cases, a genuine trend reversal in the lower timeframe can be strong enough to impact the higher timeframe. This may lead to invalidation of trade setups (i.e., stop-loss hits).
We acknowledge this risk and manage it through R:R (risk-to-reward) ratio strategies and robust capital management.
Happy trading ❤️.

RiskCalc FX & GoldRiskCalc FX & Gold is a multi-market position sizing tool designed to help you manage risk quickly and accurately. With this script, simply enter your account capital, the percentage of risk you wish to take, and your stop in ticks. Depending on the selected market—Forex or XAUUSD—the script automatically adjusts its calculations:
Forex: Assumes 1 lot equals 100,000 units.
XAUUSD: Assumes 1 lot equals 100 ounces.
The script calculates your risk in dollars and, using a fixed value of 1 USD per tick per lot, determines the ideal position size in both lots and total contracts. Results are displayed in a clear, centralized table at the top of the chart for real-time decision-making.
Perfect for traders operating across multiple markets who need an automated and consistent approach to risk management.

XAUMOvisionXAUMOvision: T he XAU/USD Composite Correlation Indicator with Weighted Spillover & Dynamic Lines
XAUMOvision is a custom-built trading indicator designed to track the intricate relationship between XAU/USD (Gold) and key economic factors: DXY (US Dollar Index), US Treasury Yields, S&P 500, and Crude Oil. By blending correlation metrics with weighted spillover effects, XAUMOvision offers actionable insights to refine your Gold trading strategy.
Core Features of XAUMOvision
1. Correlation (CC)
Definition: Measures how closely two assets move together over a given period.
Calculation: Pearson Correlation is used to assess Gold's relationship with:
DXY: Negative correlation—when DXY rises, Gold typically falls.
US Treasury Yields: Negative correlation—higher yields reduce Gold’s appeal.
S&P 500: Opposite movement, as Gold acts as a safe-haven.
Crude Oil: Positive correlation—both often rise during inflationary pressures.
2. Weighted Spillover
What It Does: Quantifies how movements in each asset (DXY, Yields, etc.) influence Gold.
Weighting: User-defined values (e.g., DXY weight = 0.4) scale each factor’s impact.
Result: A total spillover score reveals bullish or bearish sentiment for XAU/USD.
3. Composite Bias Line
Purpose: Consolidates spillover impacts into a single sentiment indicator.
Readings:
Strong Bullish: Composite Bias > 0.5.
Neutral: Close to 0.
Strong Bearish: Composite Bias < -0.5.
Output: A directional bias to guide your trading decisions.
4. Traffic Signal Line
Visual Cues:
Green: Strong Bullish Signal.
Red: Strong Bearish Signal.
Gray: Neutral—avoid trading.
Utility: A quick, color-coded overview of market conditions.
Using XAUMOvision Effectively
When to Use
During high volatility or major news events (e.g., CPI, interest rate decisions).
To understand macroeconomic forces driving Gold’s price action.
Recommended Timeframes
4-Hour: Ideal for swing traders seeking medium-term setups.
Daily: Perfect for macro trend analysis.
Weekly: Suitable for long-term investors aligning with broader trends.
---------------------------------------------------------------------------------
Practical Example
Monday, January 13, 2025 (Neutral Market)
Market Behavior: Gold stagnated (-0.96%), with low volume (681.13K).
Indicator Insights:
Composite Spillover: -0.92 (mild bearish pressure).
Traffic Signal Line: Gray—stay out of the market.
Bias Line: Weak Bearish (-1), signaling no strong trend.
Result: XAUMOvision kept traders from entering a choppy, low-volume market.
Wednesday, January 15, 2025 (CPI-Driven Rally)
CPI Release: Core CPI softer than expected (0.2% vs. 0.3%), weakening the DXY and Yields. Gold surged.
Indicator Insights:
Composite Spillover: +0.57 (strong bullish sentiment).
Traffic Signal Line: Green—clear buy signal.
Bias Line: Strong Bullish (+2), confirming the trend.
Result: Traders aligned with institutional flows and profited from the CPI-driven rally.
--------------------------------------------------------------------------------
Why XAUMOvision Stands Out
Avoids Bad Trades: Neutral signals and low-volume days keep you sidelined during indecisive markets.
Pinpoints Big Moves: Green signals during high-impact events help you capitalize on major trends.
Volume Validation: Confirms institutional activity to distinguish real trends from fakeouts.
Conclusion: Trade Like a Pro
XAUMOvision blends macroeconomic analysis with real-time technical indicators, ensuring you stay ahead of market moves. Whether navigating neutral markets or CPI-driven surges, this tool provides clarity and confidence in your trading decisions. For swing traders and macro enthusiasts, XAUMOvision is the ultimate weapon in Gold trading.

Fractal levels Gold [AstroHub]This indicator detects key fractal points on a price chart and visually marks them with shapes and levels. It helps traders identify potential reversal zones and dynamic support/resistance levels, enhancing market analysis.
Key Features:
Fractal Detection:
The indicator identifies top and bottom fractals using a 5-bar pattern.
A top fractal forms when the middle bar has a higher high compared to the two bars on either side.
A bottom fractal forms when the middle bar has a lower low compared to the two bars on either side.
Fractal Filtering:
The indicator can filter out "pristine" fractals (uninterrupted fractal patterns) based on custom conditions, making it more selective and reducing false signals.
Fractal Plotting:
are plotted as downward triangles.
are plotted as upward triangles.
Users can choose to display or hide fractal points and their corresponding labels.
Fractal Levels:
The indicator automatically plots fractals' levels on the chart, marking potential resistance and support zones.
Fractal levels change dynamically as new fractals are identified.
Customizable Display Options:
Show or hide fractals and levels with adjustable settings.
Choose whether to apply filtering for pristine fractals.
Display the pivot labels to easily track fractal positions.
How It Works:
The indicator uses a simple approach to recognize top and bottom fractals . When a valid fractal is detected, it highlights it on the chart and plots the corresponding price level.
By default, top fractals are shown above the bars (red color), and bottom fractals are shown below the bars (green color).
Fractal levels represent potential reversal points and can act as dynamic support and resistance zones.
Best Use:
The indicator is particularly useful in identifying reversal points and trend changes, helping traders to spot key price levels.
It can be used across various timeframes and markets, particularly for trend-following or reversal strategies.
Customizable Settings:
Show Pivots: Toggle the display of pivot points.
Show Pivot Labels: Display labels for pivot levels.
Show Fractals: Toggle fractal points on the chart.
Show Fractal Levels: Show or hide the levels corresponding to the detected fractals.
Filter for Pristine Fractals: Enable this option to filter out non-pristine fractals for higher accuracy.
Conclusion:
This indicator provides clear, actionable fractal signals, helping traders easily identify critical levels for entry and exit. With customizable settings and visual cues, it's suitable for both novice and expe

Conditional Volatility Explosion/ContractionThis indicator identifies zones of potential volatility expansion by analyzing the contraction and expansion of volatility bands, which are conditioned by the relationship of the price to moving averages
Volatility Squeeze: When the bands contract, it indicates a potential buildup in market tension, often preceding a significant price movement.
Volatility Expansion: When the bands expand, it signals the release of built-up tension, often resulting in increased volatility.
Trend Confirmation: The bands are active only when the price aligns with the moving average condition, helping to filter out less relevant signals during non-trending markets.
Upper Band: Displays as a red band when the volatility condition is met.
Represents the upper boundary of potential price action during high volatility.
Lower Band: Displays as a green band when the volatility condition is met.
Represents the lower boundary of potential price action during high volatility.
Fill Areas: The areas between the EMA and the bands are filled with transparent colors:
Red for the upper fill.
Green for the lower fill.
These highlights help visualize zones of potential volatility explosion.

Marcel's Dynamic Profit / Loss Calculator for GoldOverview
This Dynamic Risk / Reward Tool for Gold is designed to help traders efficiently plan and manage their trades in the volatile gold market. This script provides a clear visualisation of trade levels (Entry, Stop Loss, Take Profit) while dynamically calculating potential profit and loss. It ensures gold traders can assess their positions with precision, saving time and improving risk management.
Key Features
1. Trade Level Visualisation:
Plots Entry (Blue), Stop Loss (Red), and Take Profit (Green) lines directly on the chart.
Helps you visualise and confirm trade setups quickly which is good for scalping and day trades.
2. Dynamic Risk and Reward Calculations:
Calculates potential profit and loss in real time based on user-defined inputs such as position size, leverage, and account equity.
Displays a summary panel showing risk/reward metrics directly on the chart.
3. Customisable Settings:
Allows you to adjust key parameters like account equity, position size, leverage, and specific price levels for Entry, Stop Loss, and Take Profit.
Defaults are dynamically generated for convenience but remain fully adjustable for flexibility.
How It Works
The script uses gold-specific conventions (e.g., 1 lot = 100 ounces, 1 pip = 0.01 price change) to calculate accurate risk and reward metrics.
It dynamically positions Stop Loss and Take Profit levels relative to the entry price, based on user-defined or default offsets.
A real-time summary panel is displayed in the bottom-right corner of the chart, showing:
Potential Profit: The monetary value if the Take Profit is hit.
Potential Lo
ss: The monetary value if the Stop Loss is hit.
How to Use It
1. Add the script to your chart on a gold trading pair (e.g., XAUUSD).
2. Input your:
Account equity.
Leverage.
Position size (in lots).
Desired En
try Price (default: current close price).
3. Adjust the Stop Loss and Take Profit levels to your strategy, or let the script use default offsets of:
500 pips below the Entry for Stop Loss.
1000 pips above the Entry for Take Profit.
4. Review the plotted levels and the summary panel to confirm your trade aligns with your risk/reward goals.
Why Use This Tool?
Clarity and Precision:
Provides clear trade visuals and financial metrics for confident decision-making.
Time-Saving:
Automates the calculations needed to evaluate trade risk and reward.
Improved Risk Management:
Ensures you never trade without knowing your exact potential loss and gain.
This script is particularly useful for both novice and experienced traders looking to enhance their risk management and trading discipline in the Gold market. Enjoy clearer trades at speed.
