Dual-Phase Trend Regime Strategy [Zeiierman X PineIndicators]This strategy is based on the Dual-Phase Trend Regime Indicator by Zeiierman.
Full credit for the original concept and logic goes to Zeiierman.
This non-repainting strategy dynamically switches between fast and slow oscillators based on market volatility, providing adaptive entries and exits with high clarity and reliability.
Core Concepts
1. Adaptive Dual Oscillator Logic
The system uses two oscillators:
Fast Oscillator: Activated in high-volatility phases for quick reaction.
Slow Oscillator: Used during low-volatility phases to reduce noise.
The system automatically selects the appropriate oscillator depending on the market's volatility regime.
2. Volatility Regime Detection
Volatility is calculated using the standard deviation of returns. A median-split algorithm clusters volatility into:
Low Volatility Cluster
High Volatility Cluster
The current volatility is then compared to these clusters to determine whether the regime is low or high volatility.
3. Trend Regime Identification
Based on the active oscillator:
Bullish Trend: Oscillator > 0.5
Bearish Trend: Oscillator < 0.5
Neutral Trend: Oscillator = 0.5
The strategy reacts to changes in this trend regime.
4. Signal Source Options
You can choose between:
Regime Shift (Arrows): Trade based on oscillator value changes (from bullish to bearish and vice versa).
Oscillator Cross: Trade based on crossovers between the fast and slow oscillators.
Trade Logic
Trade Direction Options
Long Only
Short Only
Long & Short
Entry Conditions
Long Entry: Triggered on bullish regime shift or fast crossing above slow.
Short Entry: Triggered on bearish regime shift or fast crossing below slow.
Exit Conditions
Long Exit: Triggered on bearish shift or fast crossing below slow.
Short Exit: Triggered on bullish shift or fast crossing above slow.
The strategy closes opposing positions before opening new ones.
Visual Features
Oscillator Bands: Plots fast and slow oscillators, colored by trend.
Background Highlight: Indicates current trend regime.
Signal Markers: Triangle shapes show bullish/bearish shifts.
Dashboard Table: Displays live trend status ("Bullish", "Bearish", "Neutral") in the chart’s corner.
Inputs & Customization
Oscillator Periods – Fast and slow lengths.
Refit Interval – How often volatility clusters update.
Volatility Lookback & Smoothing
Color Settings – Choose your own bullish/bearish colors.
Signal Mode – Regime shift or oscillator crossover.
Trade Direction Mode
Use Cases
Swing Trading: Take entries based on adaptive regime shifts.
Trend Following: Follow the active trend using filtered oscillator logic.
Volatility-Responsive Systems: Adjust your trade behavior depending on market volatility.
Clean Exit Management: Automatically closes positions on opposite signal.
Conclusion
The Dual-Phase Trend Regime Strategy is a smart, adaptive, non-repainting system that:
Automatically switches between fast and slow trend logic.
Responds dynamically to changes in volatility.
Provides clean and visual entry/exit signals.
Supports both momentum and reversal trading logic.
This strategy is ideal for traders seeking a volatility-aware, trend-sensitive tool across any market or timeframe.
Full credit to Zeiierman.
Zeiierman

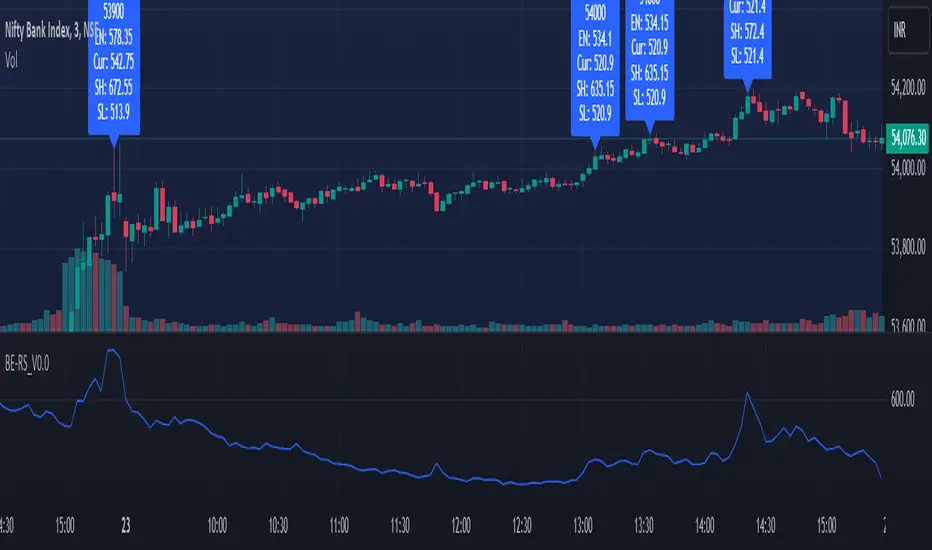
Rolling Straddle PremiumScript is Basically intended to provide insight's on the Rolling Straddle premium for the selected index based on the input settings.
Important thing to consider for the script to work seamlessly:
Specify the LTP in the input field (need not be very accurate)
Specify the Expiry Date for the Option Strike.
Ensure Profile matches to the chart script (Index Script)
Note: Zones marked in Blue, is the max level that indicator can track the option prices. beyond which it may fail to track, during such time consider reloading the indicator with Latest LTP .
Labels on the chart indicate that If i had shorted the Straddle, what would be my current position of that Straddle. however the rational behind shorting is only the pivot high points (not sure if this is right or wrong! )
Note On Labels: Labels are delayed basis the pivot point candles specified in the indicator settings.
EN: Entry Price (Straddle Premium) of the Strike Specified.
Cur: Current Price ( Current Straddle Premium ) of the Strike Specified.
SH: Max Straddle Premium ( Increase in Premium ) since position is active.
SL: Min Straddle Premium ( Premium Erosion ) since position is active.
Implied Orderblock Breaker (Zeiierman)█ Overview
The Implied Order Block Breaker (Zeiierman) is a tool designed to identify enhanced order blocks with imbalances. These enhanced order blocks represent areas where there is a rapid price movement. Essentially, this indicator uses order blocks and suggests that a swift price movement away from these levels, breaking the current market structure, could indicate an area that the market has not correctly valued. This technique offers traders a unique method to identify potential market inefficiencies and imbalances, serving as a guide for potential price revisits.
The indicator doesn't scan for imbalances in the traditional sense — where there's an absence of trades between two price levels — but instead, it identifies quick movements away from key levels that suggest where an imbalance might exist. Relying on crossovers and cross-unders in conjunction with pivot points and examining the high/low within the same period provides an innovative method for traders to spot these potentially undervalued or overvalued areas in the market. These inferred imbalances can be crucial for traders looking for price levels where the market might make significant moves.
█ How It Works
Bullish
Crossover: The closing price of a bar crosses above a pivot high, which is an indication that buyers are in control and pushing the price upwards.
New Low Within Period: There is a lower low within the same period as the pivot high. This suggests that after setting a high, the market pulled back to set a new low, potentially leaving a price gap on the way up as the price quickly recovers.
Bearish
Crossunder: The closing price of a bar crosses under a pivot low, indicating that sellers are taking control and driving the price down.
New High Within Period: There is a higher high within the same period as the pivot low. This condition suggests that the market rallied to a new high before falling back below the pivot low, potentially leaving a gap on the way down.
█ How to Use
The enhanced order blocks are often revisited, and the price may aim to 'fill' the potential imbalance created by the rapid price movement, thereby presenting traders with potential entry or exit points. This approach aligns with the idea that imbalances are frequently revisited by the market, and when combined with the context of Order Blocks, it provides even more confluence.
Example
Here, if the price drops rapidly after setting a new high—crossing under the pivot low—it may skip over certain price levels, creating a 'gap' that signifies an area where the price might have been overvalued (imbalance), which the market may revisit for a potential price correction or revaluation.
█ Settings
Period: Determines the number of bars used for identifying pivot highs and lows. A higher value gives more significant but less frequent signals, while a lower value increases sensitivity but might give more false positives.
Pivot Surrounding: Specifies the number of candles to analyze around a pivot point. Increasing this value broadens the analysis range, potentially capturing more setups but possibly including less significant ones.
-----------------
Disclaimer
The information contained in my Scripts/Indicators/Ideas/Algos/Systems does not constitute financial advice or a solicitation to buy or sell any securities of any type. I will not accept liability for any loss or damage, including without limitation any loss of profit, which may arise directly or indirectly from the use of or reliance on such information.
All investments involve risk, and the past performance of a security, industry, sector, market, financial product, trading strategy, backtest, or individual's trading does not guarantee future results or returns. Investors are fully responsible for any investment decisions they make. Such decisions should be based solely on an evaluation of their financial circumstances, investment objectives, risk tolerance, and liquidity needs.
My Scripts/Indicators/Ideas/Algos/Systems are only for educational purposes!

Golden Swap (Zeiierman)█ Overview
The Golden Swap indicator, as designed by Zeiierman, focuses on identifying reversal points around the key levels indicated by the indicator. This pattern works by analyzing the relationship between current and past price movements, considering factors like price symmetry, baseline boundaries, and precision pin bar formations. It can offer insights into potential market reversals, allowing for more precise entries and exits.
█ How It Works
Golden Swap Long
In a market with bullish momentum, we expect the price to dip a bit before it continues to rise again. This dip is like a small retreat in an overall march upwards. So, the pattern aims to assess whether the current period's dip is relatively shallow, indicating that the overall bullish momentum remains robust despite temporary price fluctuations.
Golden Swap Short
In a market with bearish momentum (indicating selling pressure or bearish sentiment), we may still see the price rise a bit before continuing its drop. This temporary rise is like a slight bounce in an overall downward movement. In simpler terms, even when the price bounces up a bit, it's not strong enough to overcome the recent pressure of selling. The sellers are still dominating, and the price will likely continue to drop.
█ The signal is reinforced by symmetry, BaselineBound criteria, and a bearish Precision PinBar.
⚪ Symmetry in Price Movements: The pattern uses the Symmetry Precision filter to analyze the symmetry of recent price movements. This helps in determining the likelihood of a reversal. A high degree of symmetry suggests a more reliable reversal signal.
⚪ BaselineBound Criteria: This component involves the BaselineBound Threshold, which acts as a filter to validate the strength of the potential reversal. Bullish and bearish conditions are assessed based on how the current close price compares to a calculated range around the high and low of the previous period.
⚪ Precision PinBar Analysis: The pattern also incorporates the Precision PinBar filter, which evaluates the characteristics of the recent price bars. A Precision PinBar is a candlestick with a small body and a long tail, indicating a potential reversal.
⚪ Display of Key Levels: The indicator can show Open, High, and Low levels for selected timeframes, helping traders identify key price points.
█ How to Use
The Golden Swap pattern is a valuable confirmation tool, particularly around key levels or session highs and lows. It highlights instances where a previous high or low has been respected, followed by a price reversal—flipping back up in an upward trend (Golden Swap Long) or flipping back down in a downward trend (Golden Swap Short). When this pattern emerges near a key level, it strongly suggests that the price will continue moving in the direction indicated by the current trend.
Consider it akin to a minor liquidity hunt above the previous high or below the previous low. The presence of the Golden Swap pattern, especially when aligned with other indicators and filters, enhances its reliability as a signal for the continuation of the prevailing market trend.
█ Settings
Timeframe Selection: Choose from various timeframes for signal calculation.
Filter Adjustments: Fine-tune the Symmetry Precision, BaselineBound Threshold, and Precision PinBar settings to filter signals according to specific criteria.
Display Options for Key Levels: Enable or disable the display of key price levels and select timeframes for these levels.
█ Related script using the same pattern filtering techniques
-----------------
Disclaimer
The information contained in my Scripts/Indicators/Ideas/Algos/Systems does not constitute financial advice or a solicitation to buy or sell any securities of any type. I will not accept liability for any loss or damage, including without limitation any loss of profit, which may arise directly or indirectly from the use of or reliance on such information.
All investments involve risk, and the past performance of a security, industry, sector, market, financial product, trading strategy, backtest, or individual's trading does not guarantee future results or returns. Investors are fully responsible for any investment decisions they make. Such decisions should be based solely on an evaluation of their financial circumstances, investment objectives, risk tolerance, and liquidity needs.
My Scripts/Indicators/Ideas/Algos/Systems are only for educational purposes!

RSI with Self-Adjusting Linear Regression Bands (Expo)RSI with Self-Adjusting Linear Regression Bands (Expo) makes use of RSI and Linear Regression to create an RSI that follows the current trend. The indicator has an upper and lower self-adjusting Linear Regression Band that act as RSI boundaries.
HOW TO USE
The indicator can be used in multiple ways, for instance, to find overbought and oversold areas. Or to identify trends as well as pullbacks in trends.
INDICATOR IN ACTION
This indicator is a modification of RafaelZioni's work "Linear Regression Trend bands"
Credit to: RafaelZioni
I hope you find this indicator useful , and please comment or contact me if you like the script or have any questions/suggestions for future improvements. Thanks!
I will continually work on this indicator, so please share your experience and feedback as it will enable me to make even better improvements. Thanks to everyone that has already contacted me regarding my scripts. Your feedback is valuable for future developments!
-----------------
Disclaimer
Copyright by Zeiierman.
The information contained in my scripts/indicators/ideas does not constitute financial advice or a solicitation to buy or sell any securities of any type. I will not accept liability for any loss or damage, including without limitation any loss of profit, which may arise directly or indirectly from the use of or reliance on such information.
All investments involve risk, and the past performance of a security, industry, sector, market, financial product, trading strategy, or individual’s trading does not guarantee future results or returns. Investors are fully responsible for any investment decisions they make. Such decisions should be based solely on an evaluation of their financial circumstances, investment objectives, risk tolerance, and liquidity needs.
My scripts/indicators/ideas are only for educational purposes!

High & Low Of Custom Session - OpeningRange Breakout (Expo)High & Low Of Custom Session - OpeningRange Breakout (Expo) prints the high and the low of a custom session.
I use the indicator to trade the re-test of opening range (high/low) as well as breakouts from the opening range. The same logic can be applied to the session you have chosen.
HOW TO USE
1. Use the indicator to trade the re-tests of the session range.
2. Use the indicator to trade breakouts of session range.
INDICATOR IN ACTION
1-min chart
I hope you find this indicator useful , and please comment or contact me if you like the script or have any questions/suggestions for future improvements. Thanks!
I will continually work on this indicator, so please share your experience and feedback as it will enable me to make even better improvements. Thanks to everyone that has already contacted me regarding my scripts. Your feedback is valuable for future developments!
-----------------
Disclaimer
Copyright by Zeiierman.
The information contained in my scripts/indicators/ideas does not constitute financial advice or a solicitation to buy or sell any securities of any type. I will not accept liability for any loss or damage, including without limitation any loss of profit, which may arise directly or indirectly from the use of or reliance on such information.
All investments involve risk, and the past performance of a security, industry, sector, market, financial product, trading strategy, or individual’s trading does not guarantee future results or returns. Investors are fully responsible for any investment decisions they make. Such decisions should be based solely on an evaluation of their financial circumstances, investment objectives, risk tolerance, and liquidity needs.
My scripts/indicators/ideas are only for educational purposes!

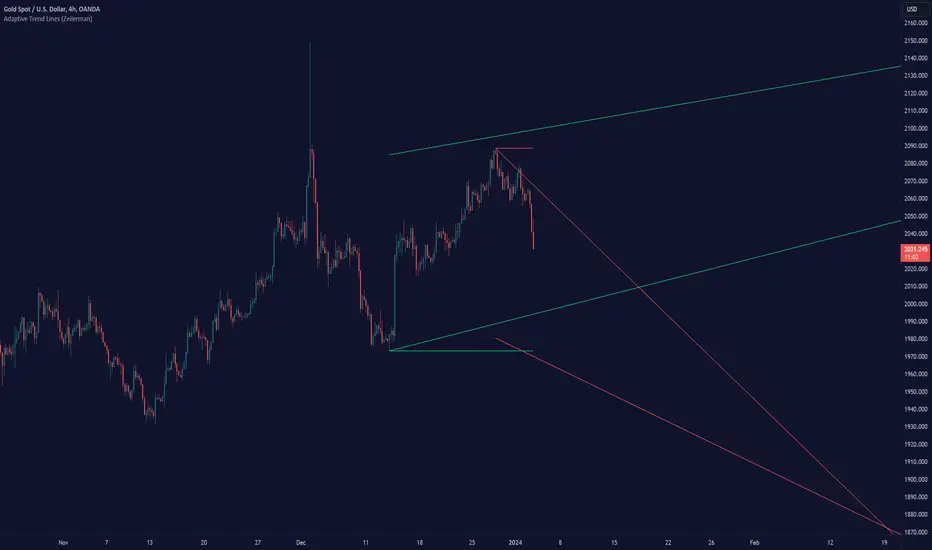
Adaptive Trend Lines (Expo)Adaptive Trend Lines (Expo) identifies the current trend direction within the selected lookback period. The idea behind the indicator is that the trend lines should self adjust to the constantly changing market. The indicator adjusts itself to the market by using tr (true range) and stdev (standard deviation) as dynamic variables.
The indicator displays positive- and negative trend channels.
HOW TO USE
1. Use the indicator to identify the trend direction.
I hope you find this indicator useful , and please comment or contact me if you like the script or have any questions/suggestions for future improvements. Thanks!
I will continually work on this indicator , so please share your experience and feedback as it will enable me to make even better improvements. Thanks to everyone that has already contacted me regarding my scripts. Your feedback is valuable for future developments!
-----------------
Disclaimer
Copyright by Zeiierman.
The information contained in my scripts/indicators/ideas does not constitute financial advice or a solicitation to buy or sell any securities of any type. I will not accept liability for any loss or damage, including without limitation any loss of profit, which may arise directly or indirectly from the use of or reliance on such information.
All investments involve risk, and the past performance of a security, industry, sector, market, financial product, trading strategy, or individual’s trading does not guarantee future results or returns. Investors are fully responsible for any investment decisions they make. Such decisions should be based solely on an evaluation of their financial circumstances, investment objectives, risk tolerance, and liquidity needs.
My scripts/indicators/ideas are only for educational purposes!
GreedZone indicator - Contrarian Indicator"Be fearful when others are greedy, and greedy when others are fearful" - Warren Buffett. Greedzone is a contrarian indicator that gives us an indication when greed begins to take over in the market. Traders should be prepared for increased volatility and good trading opportunities.
The Greedzone is visualized with green candlesticks above the price.
HOW TO USE
1. Use the indicator to identify when investors are greedy.
2. Use the indicator to identify potential reversal points.
INDICATOR IN ACTION
1 hour chart
5 min chart
I hope you find this indicator useful , and please comment or contact me if you like the script or have any questions/suggestions for future improvements. Thanks!
I will continually work on this indicator, so please share your experience and feedback as it will enable me to make even better improvements. Thanks to everyone that has already contacted me regarding my scripts. Your feedback is valuable for future developments!
-----------------
Disclaimer
Copyright by Zeiierman.
The information contained in my scripts/indicators/ideas does not constitute financial advice or a solicitation to buy or sell any securities of any type. I will not accept liability for any loss or damage, including without limitation any loss of profit, which may arise directly or indirectly from the use of or reliance on such information.
All investments involve risk, and the past performance of a security, industry, sector, market, financial product, trading strategy, or individual’s trading does not guarantee future results or returns. Investors are fully responsible for any investment decisions they make. Such decisions should be based solely on an evaluation of their financial circumstances, investment objectives, risk tolerance, and liquidity needs.
My scripts/indicators/ideas are only for educational purposes!

Fearzone (Expo) - Contrarian Indicator"Be fearful when others are greedy, and greedy when others are fearful" - Warren Buffett. Fearzone is a contrarian indicator that gives us an indication when fear begins to take over in the market. Traders should be prepared for increased volatility and good trading opportunities.
The Fearzone is visualized with red candlesticks below the price.
This version of the FearZone indicator is slightly different from the one ©kruskakli has published.
HOW TO USE
1. Use the indicator to identify when investors are fearful.
2. Use the indicator to identify potential reversal points.
INDICATOR IN ACTION
1 hour chart
5 min chart
I hope you find this indicator useful , and please comment or contact me if you like the script or have any questions/suggestions for future improvements. Thanks!
I will continually work on this indicator, so please share your experience and feedback as it will enable me to make even better improvements. Thanks to everyone that has already contacted me regarding my scripts. Your feedback is valuable for future developments!
-----------------
Disclaimer
Copyright by Zeiierman.
The information contained in my scripts/indicators/ideas does not constitute financial advice or a solicitation to buy or sell any securities of any type. I will not accept liability for any loss or damage, including without limitation any loss of profit, which may arise directly or indirectly from the use of or reliance on such information.
All investments involve risk, and the past performance of a security, industry, sector, market, financial product, trading strategy, or individual’s trading does not guarantee future results or returns. Investors are fully responsible for any investment decisions they make. Such decisions should be based solely on an evaluation of their financial circumstances, investment objectives, risk tolerance, and liquidity needs.
My scripts/indicators/ideas are only for educational purposes!
