TradingView Pine Screener: key features and requirements
Pine Screener is a tool for scanning your watchlists with Pine scripts. With it, you can quickly scan, compare, and find symbols for trading and investing.
CONTENTS:
- What is the Pine Screener
- Pine Screener main features
- How to use the Pine Screener
- Pine Screener requirements
What is the Pine Screener
Pine Screener is designed to give you a market overview and provide symbol comparison. To use it to its full potential, we recommend you learn how to use the watchlists.
After you create your custom symbol watchlists, you're then able to scan assets and financial metrics in the watchlists with the Screener. This allows you to find promising assets to trade and include in your trading and investing portfolio.
You can work with a full set of symbols regardless of the symbol type. The Pine Screener can scan a full watchlist containing stocks, crypto symbols, bonds, and other assets.
Pine Screener main features
All your watchlists are available to you as a source of symbols for working in the screener. They can be:
- Custom: With symbols added by you manually
- Sparks: Curated watchlists with stocks, crypto, and more
As an indicator for searching symbols that interest you, you can use any indicators from your favorites. These can include:
- Your personal Pine script
- Built-in technical indicators
- Community indicators from the public library
After you've applied filters, the result will be a set of symbols corresponding to the specified filtering parameters.
You can also analyze the values of the plots of your studies for each symbol in the table and sort the values by the selected plot.
How to use the Pine Screener
Pine screener is available through the product menu. From the Home page, go to the "Products," then choose "Screeners" and select "Pine."
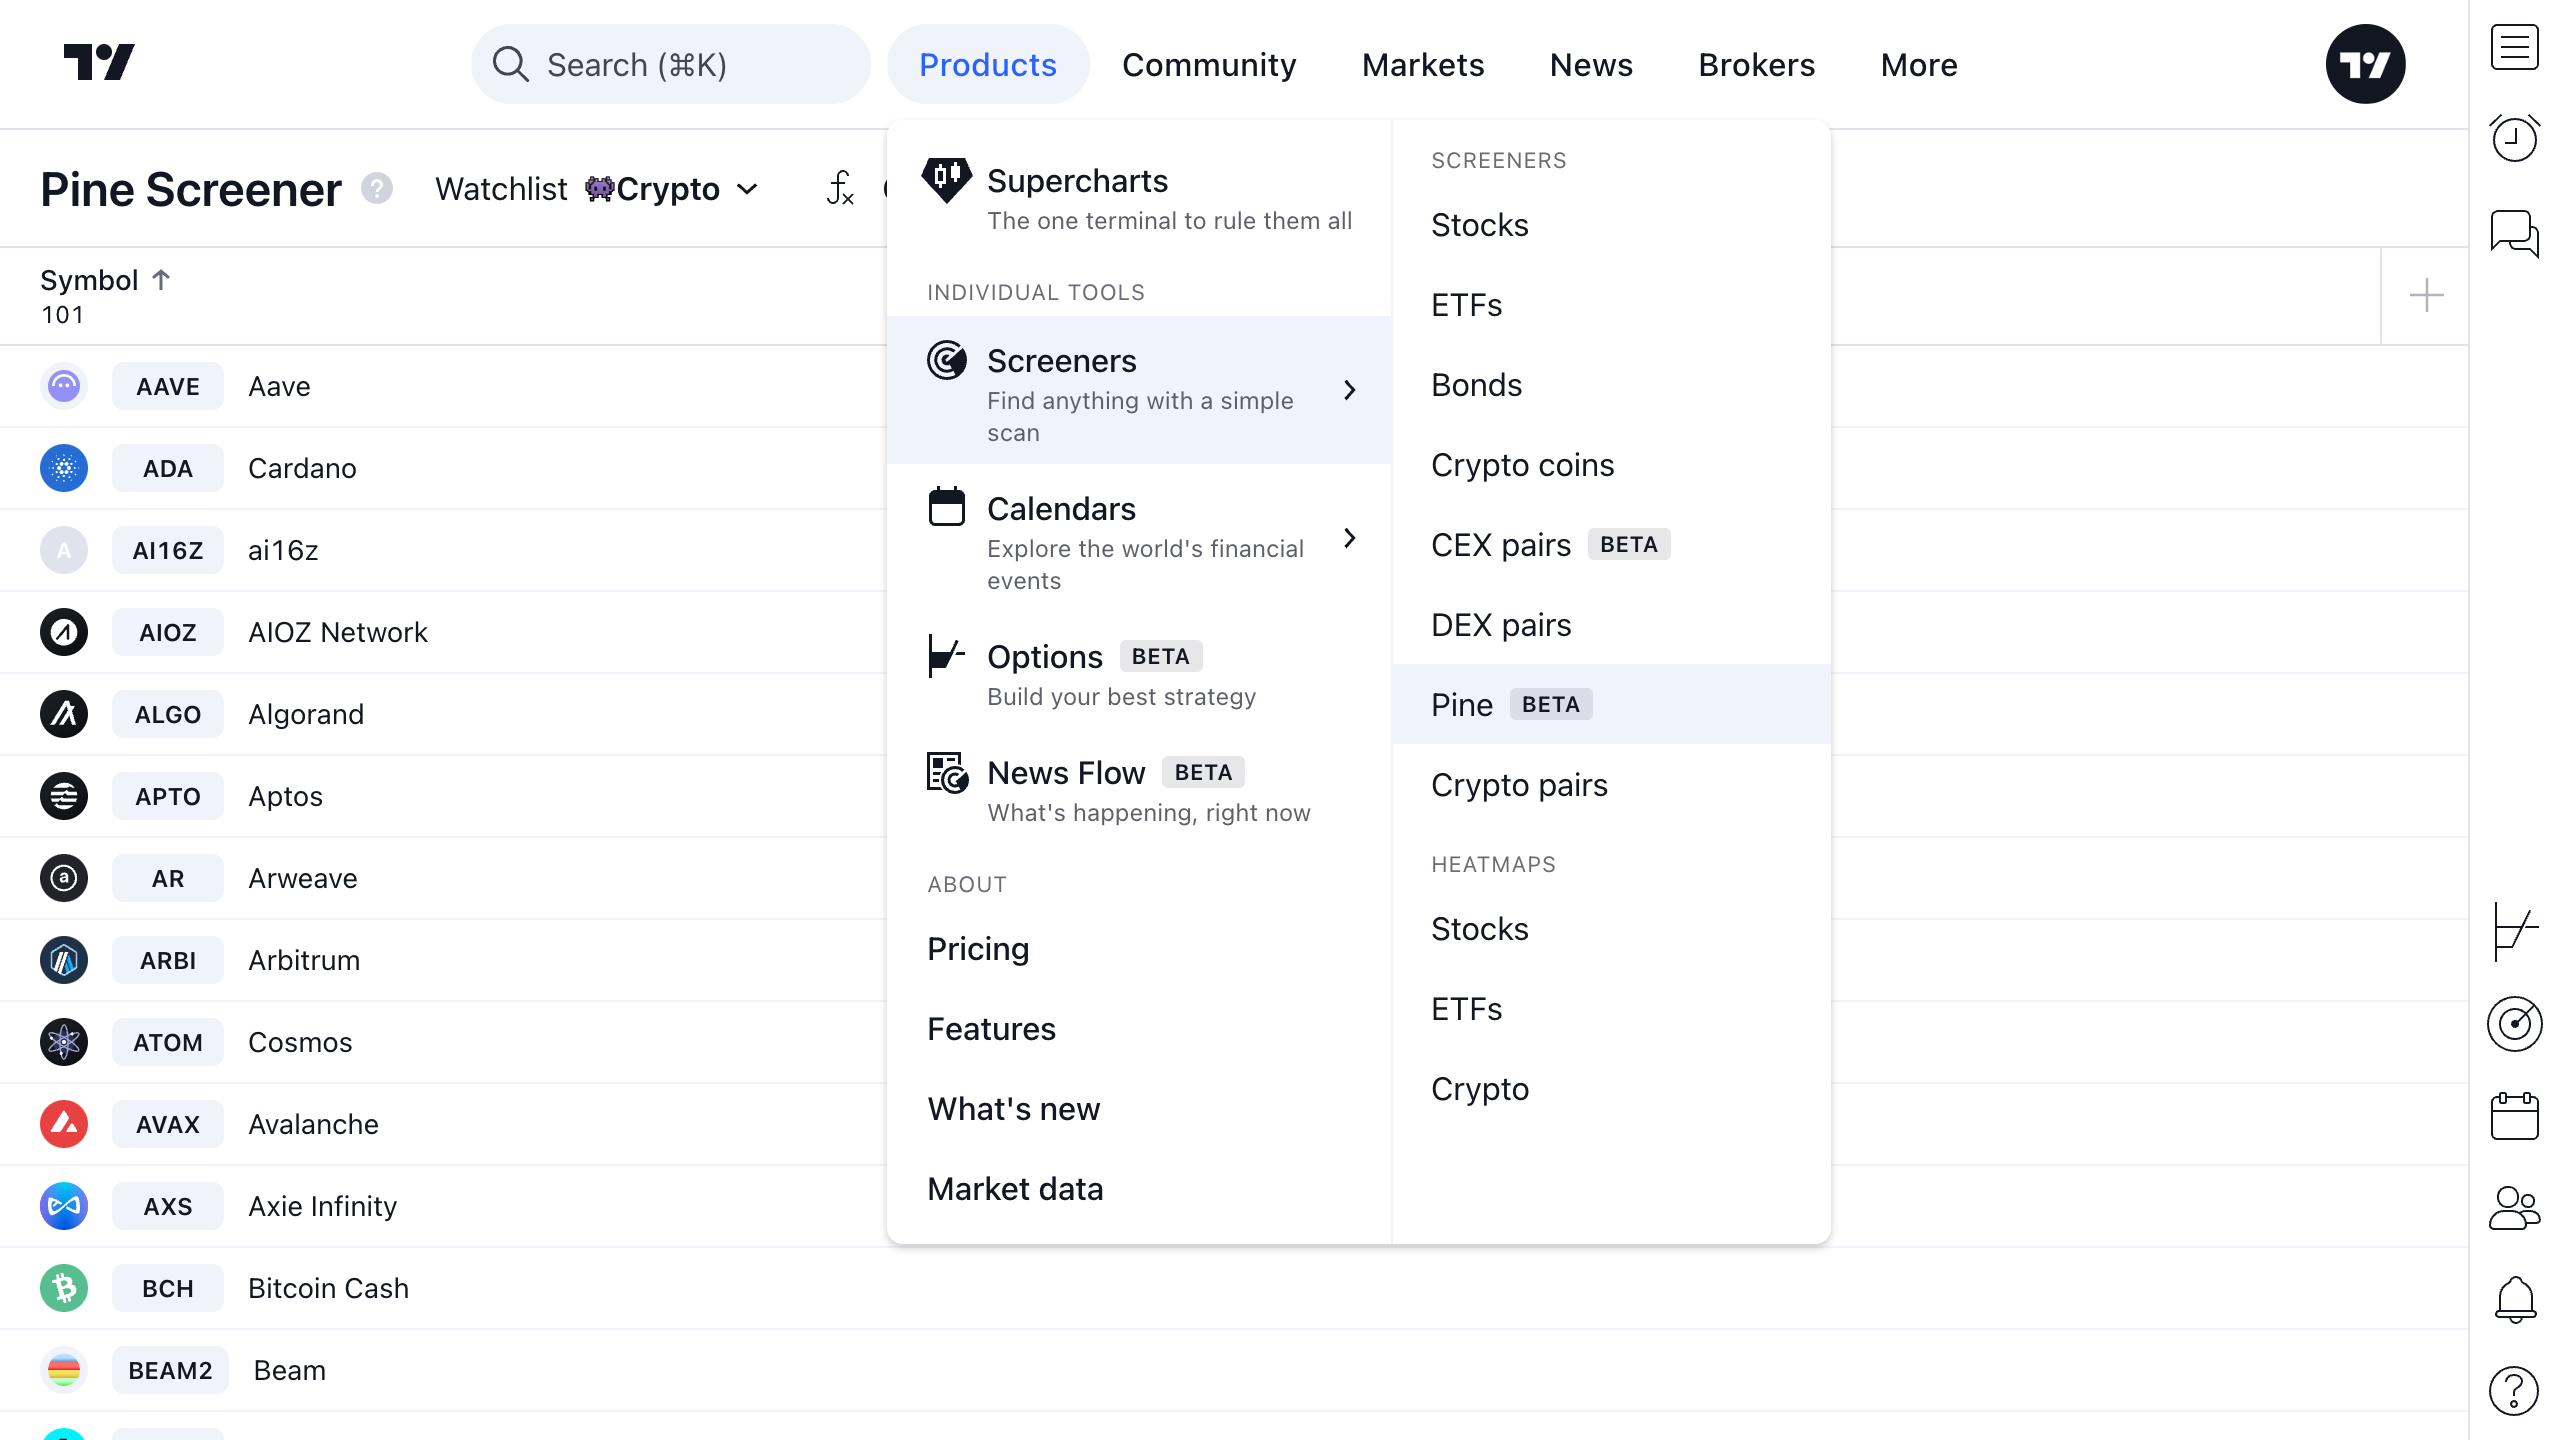
Also, you can access the Pine Screener from your Supercharts. For that, find the "Screeners" icon on the right toolbar of the Supercharts and select Pine Screener.
In short, to work with the Pine Screener:
- Select the watchlist
- Select an indicator
- Set the filtering criteria for the selected indicator
- Scan

Selecting a watchlist
By default, the product page will open with the watchlist you are currently on in the right panel. But you can select any of your custom and curated watchlists.
If the selected list has symbols, the table with all of them will be loaded immediately.

Selecting an indicator
By default, you don't have any script selected. You can choose a script for scanning in the menu from the indicator dropdown.
! Note: You can only use indicators that are in your favorites. If you don't find an indicator in the Pine Screener indicator menu, return to the Supercharts and check whether this indicator is in your favorites.
After an indicator is selected, it's then loaded in the default state with:
- The default studies inputs
- A default 1-day time interval
Studies settings and time intervals can be changed in the indicator dropdown.
When the selected indicator is loaded, the following conditions are applied:
- The first ten plots are added for subsequent filter configuration
- These plots are added to the table as columns
- Two alert conditions from the script are added
- The option to add additional filters or columns will appear
- The "Scan" button will appear
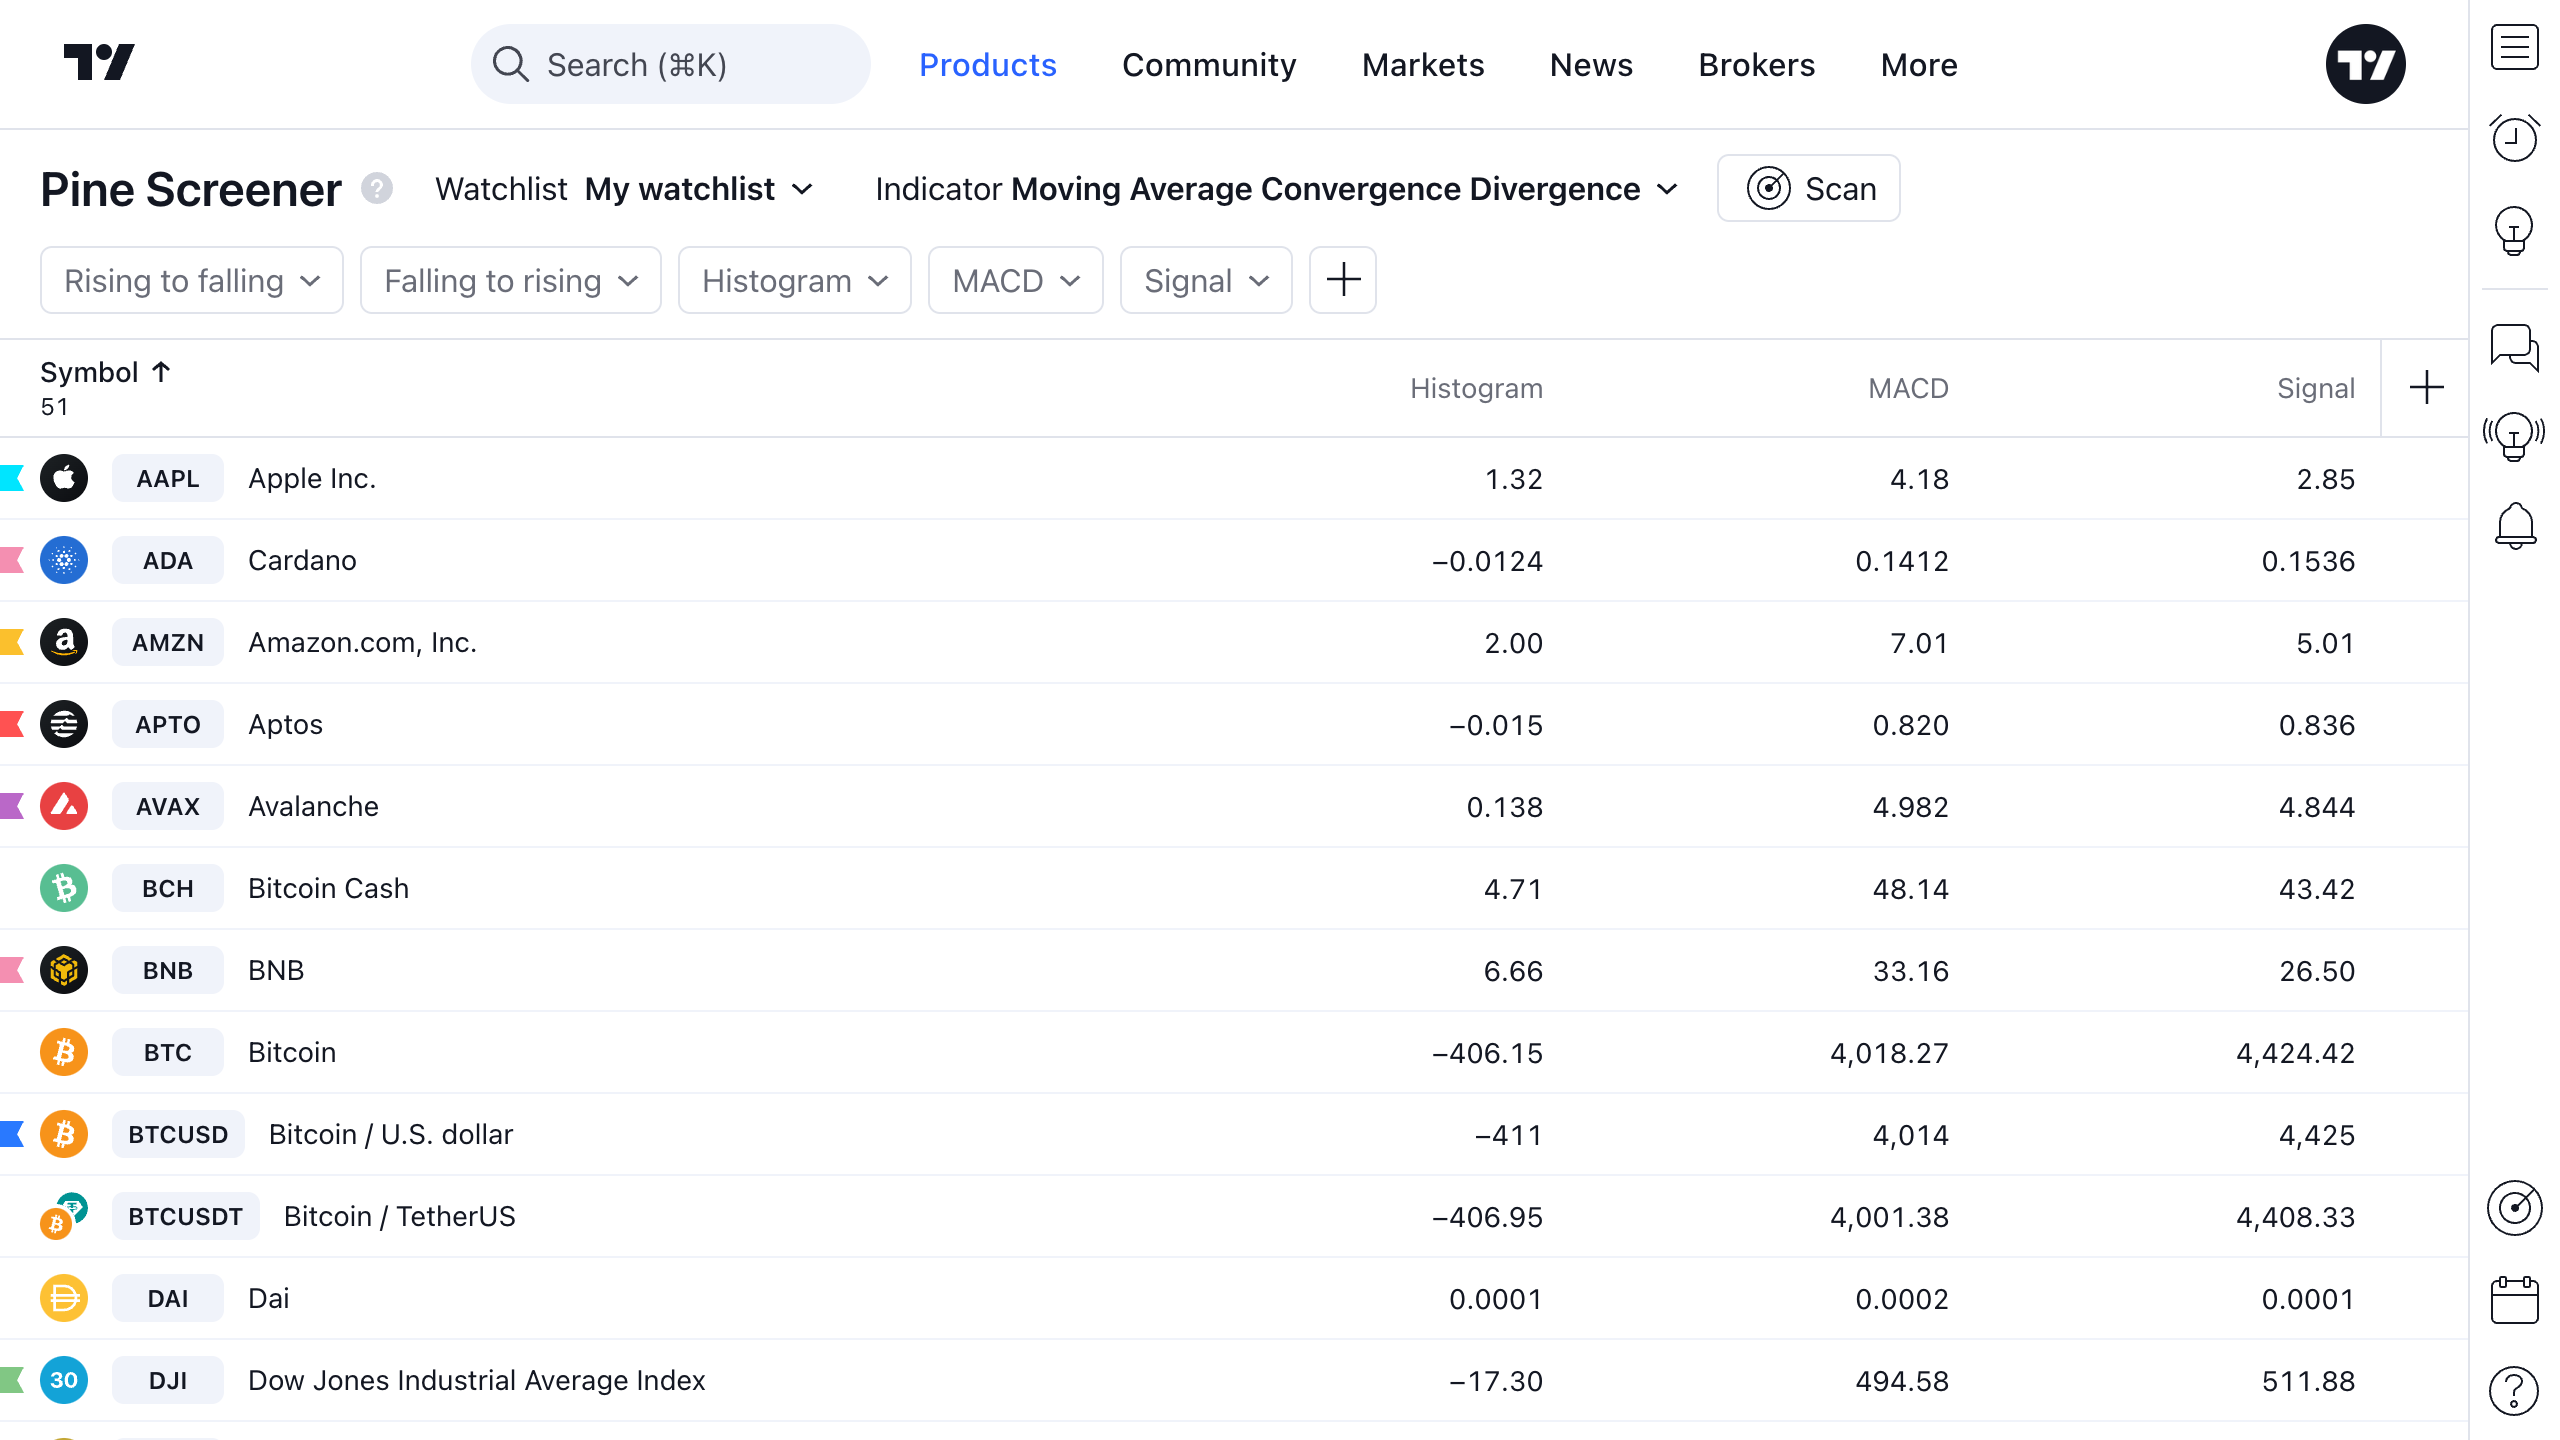
Setting up filtration
As a "blank" for filters, you can use both the plots and alert conditions. You can choose them in the upper toolbar when the script is launched.
As filters, you can use:
- Indicator plots
- Indicator alert conditions

If you want to use the indicator plot as a filter, you need to set the condition and the filter target value.

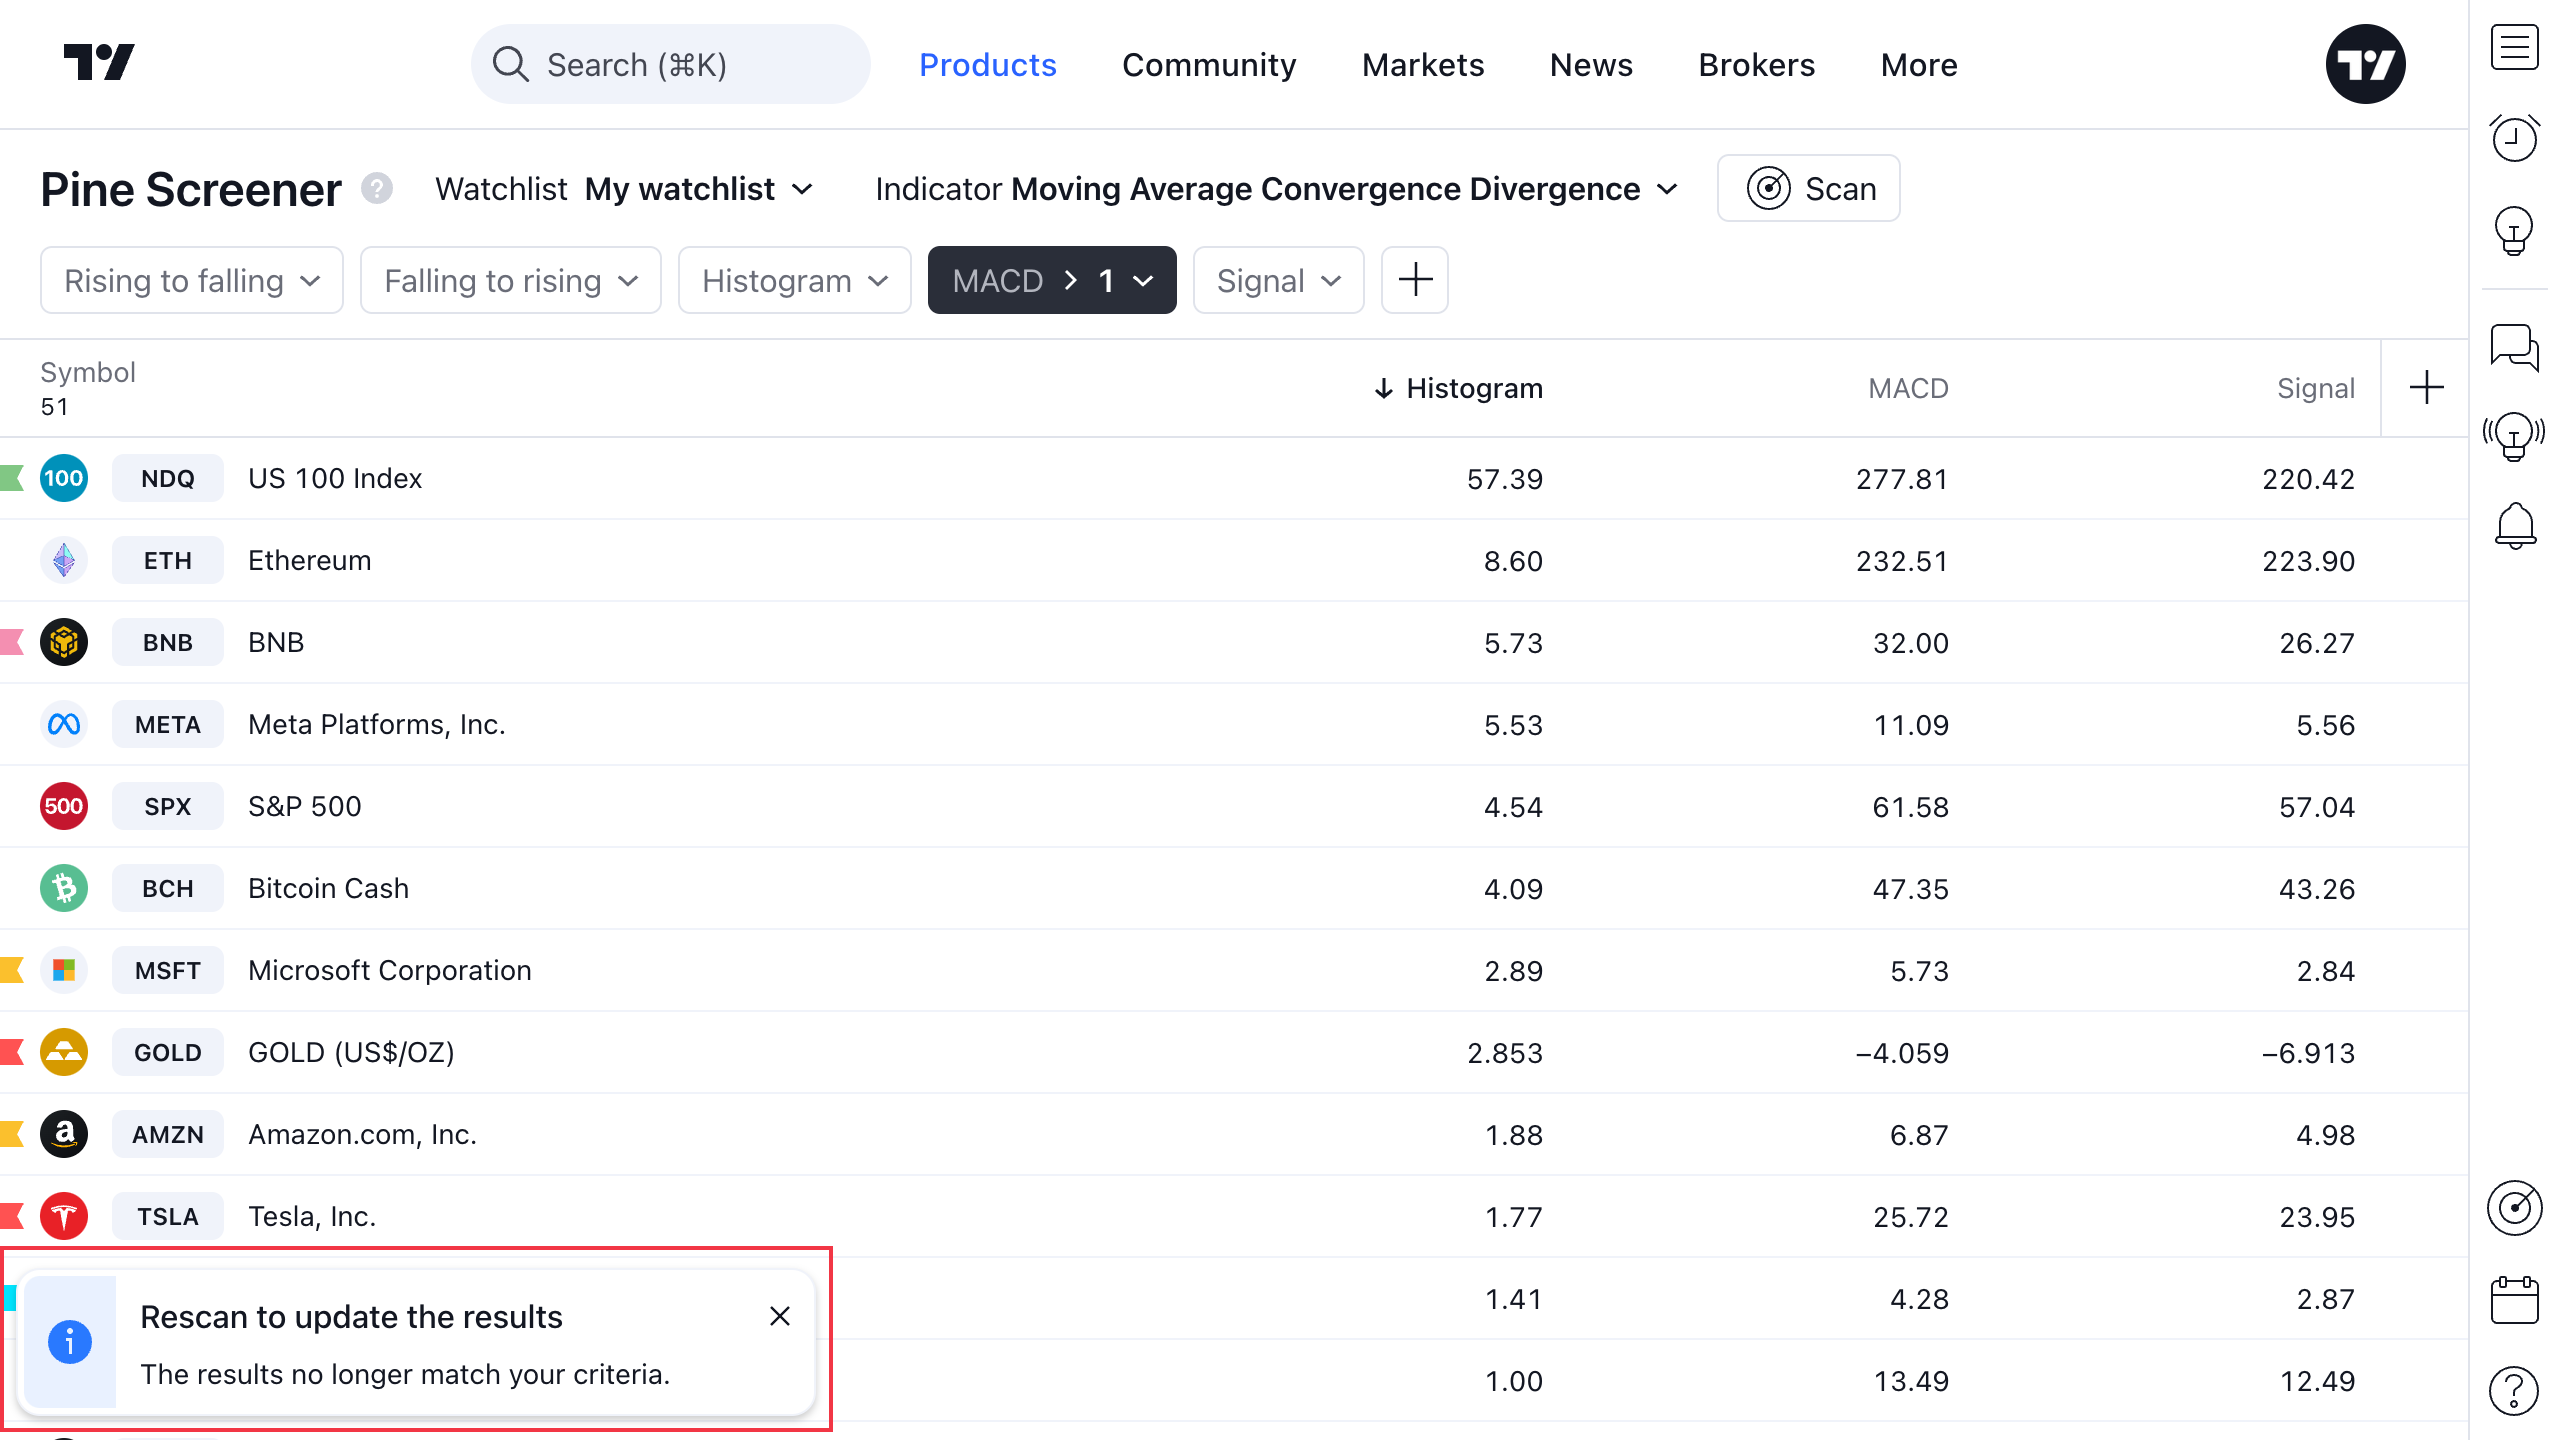
Scan
You can scan after you've chosen an indicator.
When launched, you'll see the scan bar. When it's complete, an update bar with stats will appear. After that you can work with the table.

You need to restart the scan if, after the previous scan, you changed one of the following:
- Watchlist
- Studies
- Current studies inputs
- Studies timeframe
- Filter set or states
Pine Screener requirements
- You can use only one indicator per screen
- The indicator must output at least one plot or alert condition from the plot() or alertcondition() functions to be used as the screening filters
- Only the plots of the selected indicator can be used as columns
- The Indicator-on-Indicator feature is not supported
- Custom timeframes are not supported. The supported timeframes are: minutes (1, 5, 15, 30), hours (1, 2, 4), 1 day, 1 week, and 1 month
- The Pine Screener supports all `request.*()` functions, with the following limitations:
- No more than five separate `request.*()` calls can be used inside of the scanned script
- The requested timeframe must be in the list of the supported timeframes. The valid Pine string identifiers of these timeframes are: "1", "5", "15", "30", "60", "120", "240", "1D", "1W", and "1M"
- You can scan only one screen at a time: if you already have a scan running in one tab, then another browser tab cannot run another scan
- The Pine Screener supports most input.*() functions and allows you to change values in these inputs via the "Settings" dialog. The following functions are not supported: input.timeframe(), input.symbol(), input.time(). If a script uses these input functions, the Pine Screener ignores the input value that the user selects, and uses its default value instead
- The indicator performs calculations on only the last 500 bars on the chart
- Using custom alert conditions is not compatible with scripts of Pine versions 3 and earlier. Using scripts of Pine v4 and higher is recommended
The bottom line
Pine Screener is a comprehensive tool to sort out your symbols before starting narrower analysis of them.
You can use it with other TradingView tools for both technical and fundamental analysis and access them from your Supercharts.
If you have your custom indicators created with Pine Script®, you can include them in the screener and see how your favorite assets look from the perspective of your unique trading view.
Also read: