What are line with markers charts
Line with markers chart is a type of line chart, but unlike the original chart, line with markers is built on distinct dots (markers) at each data point on the line. It is commonly used to track the price movement of assets over time while emphasizing specific data points for better clarity.
CONTENTS:
What are line with markers charts
This chart type is similar to standard line charts only in that markers draw attention to specific price levels at each data point, helping traders quickly spot price levels.
By default, line charts use close prices, which are connected in a single line. In such a case, markers are close prices.
Line with markers vs lines
Even though these two chart types seem "the same but just with markers," this small tweak can greatly change your view on the chart and data points. As Supercharts are not limited to assets' prices — for instance, you can view interest rates, inflation rates, or bond yields — in some cases, markers can be very helpful in pin-pointing these values.

Line with markers
- Emphasizes both trends and individual data points
- May serve better than lines to outline key event points in time
- As well as standard line charts, good for both trend identification and chart patterns recognition
- More suited for detailed reports, than standard lines
Lines
- More emphasize chart patterns then individual points
- More smooth presentation of data
- More suited for dashboards, than line with markers
- May lack precision
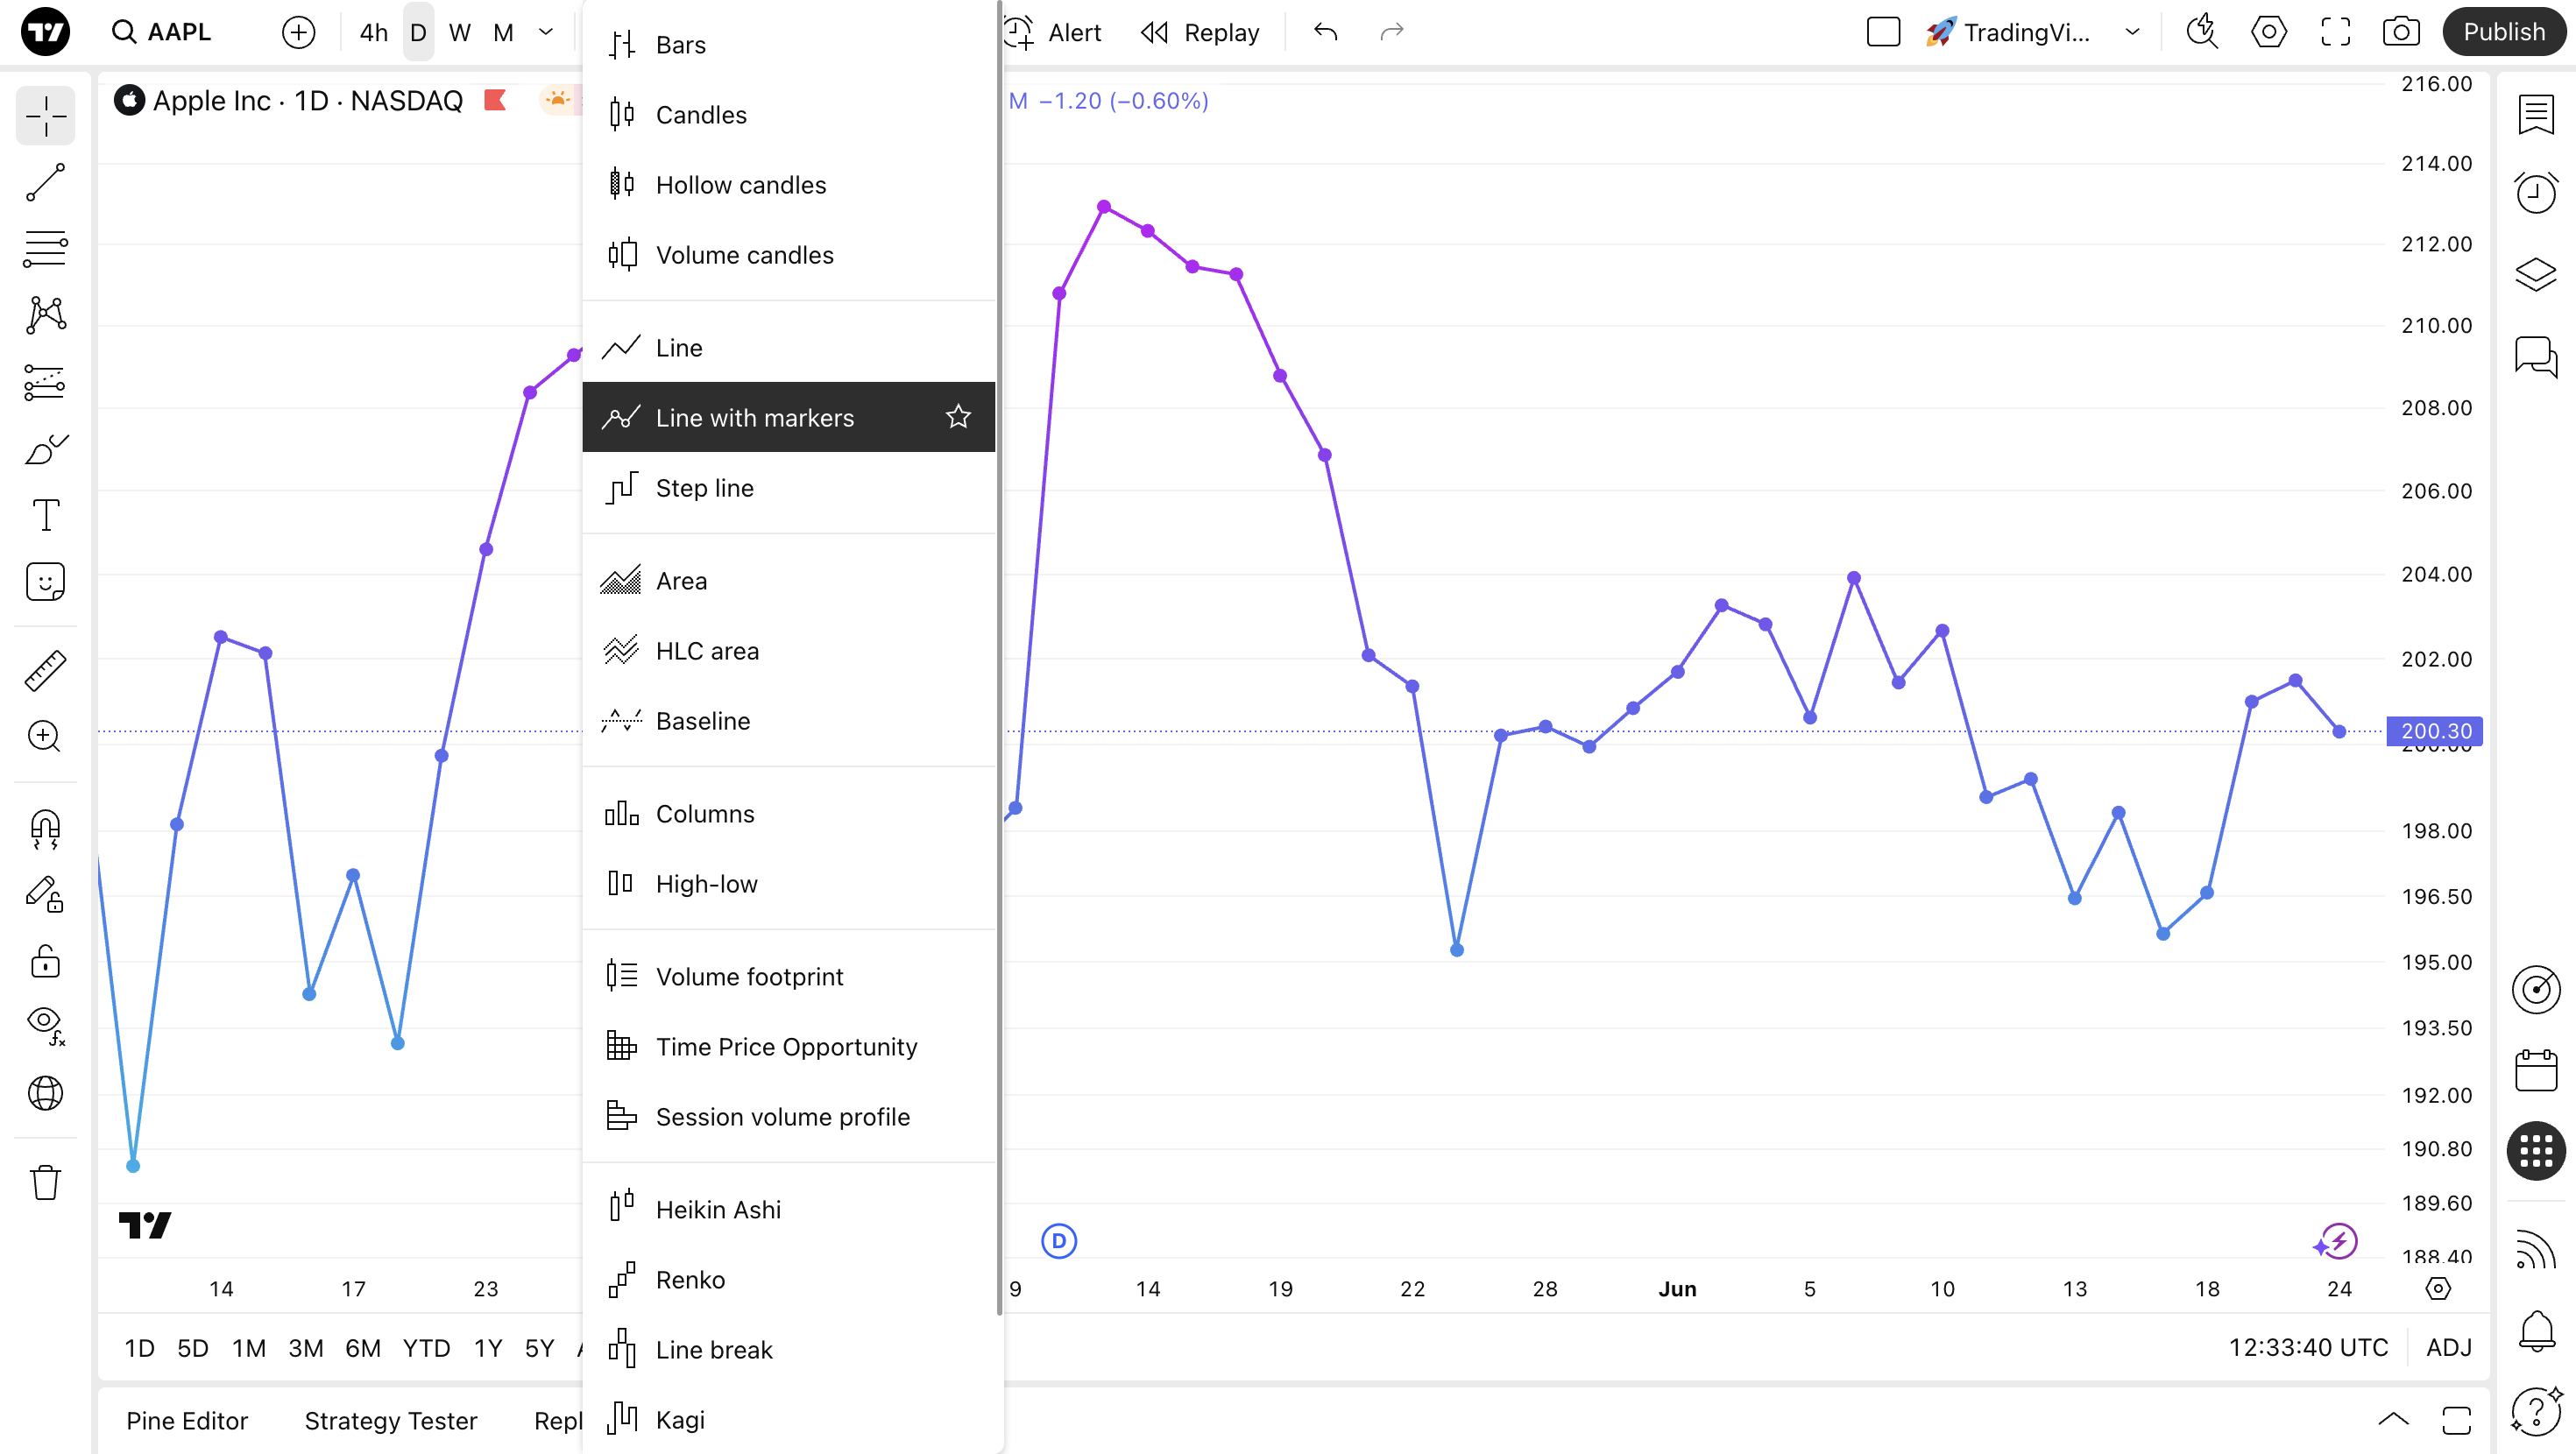
Enabling the chart type
Once you are on the Supercharts, open the chart type menu on the upper toolbar, and select "Line with markers."
 Settings
The line with markers chart settings are similar to those of the line chart.
To adjust your line with markers chart, find the gear-like "Settings" button on the upper toolbar, and go to the "Symbol" tab.
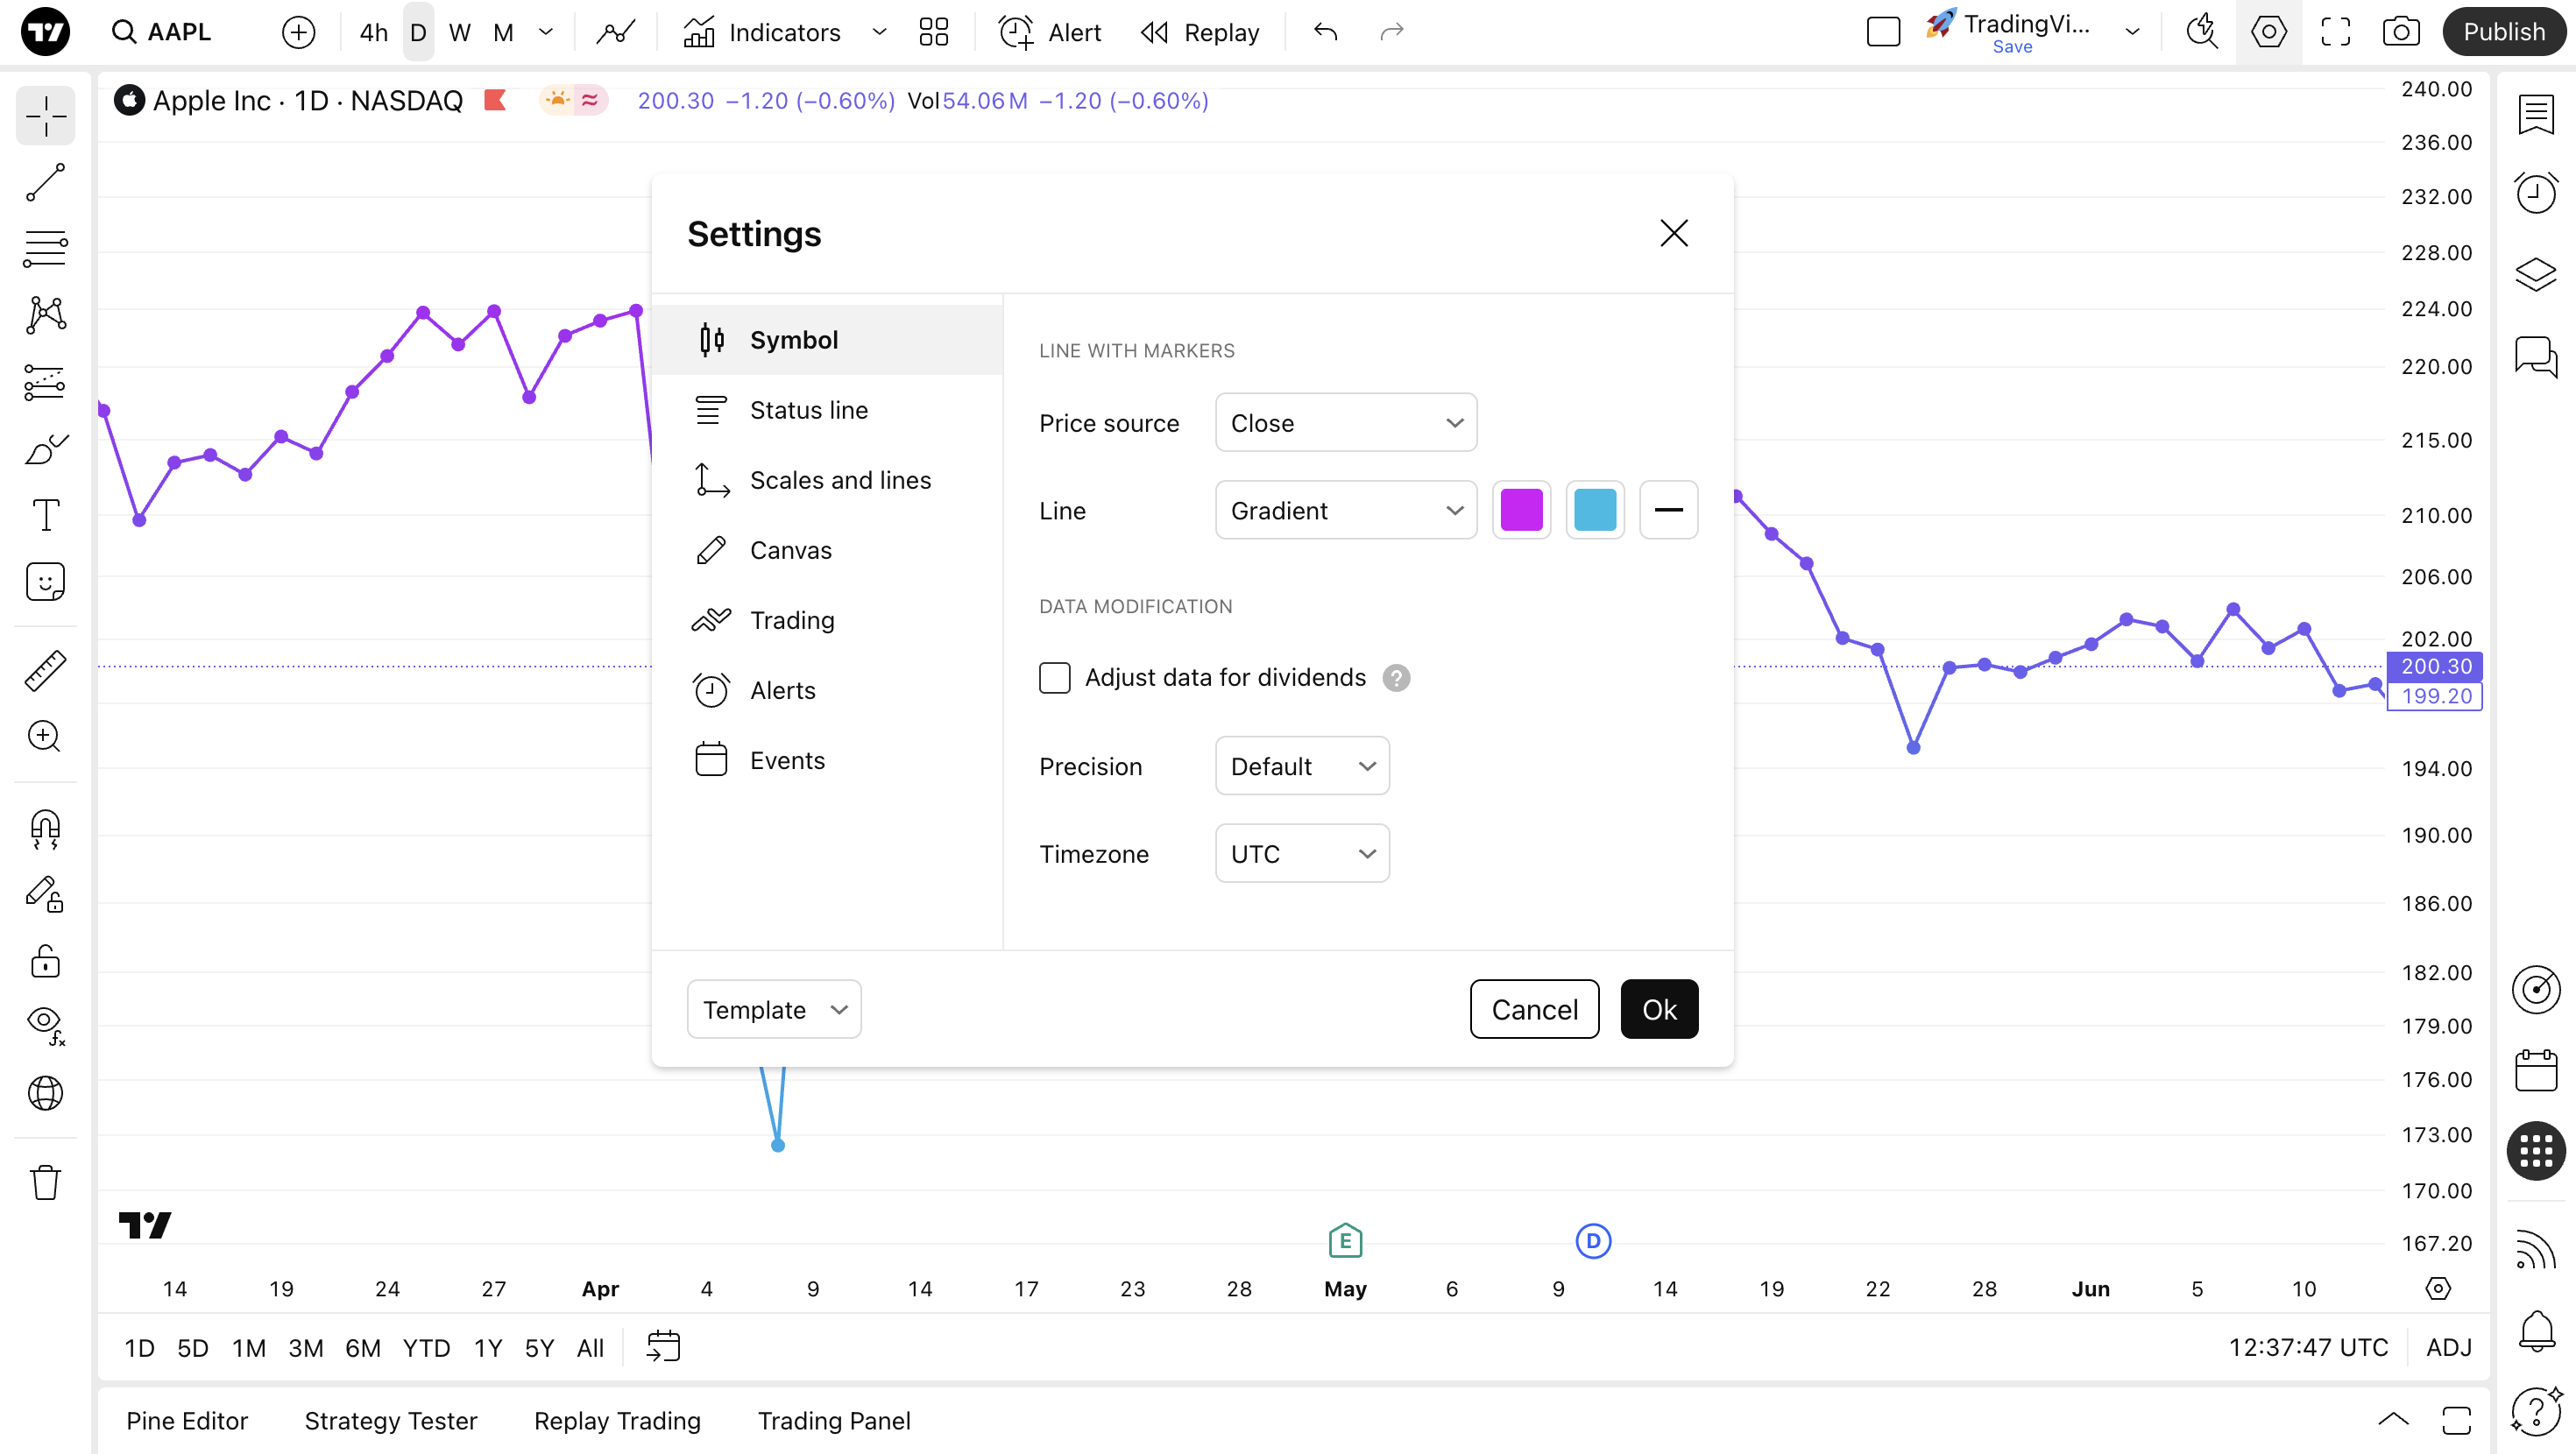
The Line with markers section lists settings specific to the chart type:
- Price source: Choose the price you want the chart to show. By default, it is set to close price, meaning the chart will be formed with the closing prices of an asset. According to your trading style, choose the desired price as markers:
- Open: The chart will show the opening prices
- High: Shows only the highest prices
- Low: Shows only the lowest prices
- Close: Shows only the closing prices
- (H + L)/2: Shows the average of the highest and lowest prices
- (H + L + C)/3: Shows the average of the highest, lowest, and closing prices
- (O + H + L + C)/4: Shows the average of the opening, highest, lowest, and closing prices
- Line: With this setting on, the color of the line, its thickness, and opacity can be changed according to your preferences. Here, you can also choose between a gradient and a solid line
Line with markers in a nutshell
You can use this chart type, if you need data points to be highlighted. Our line with markers charts hide markers when you zoom out, so markers don't distract you from your analysis.
They work with all the chart patterns, and can be used for trend recognition as well as standard lines.
Also read: