0XUSD trade ideas

ZRXUSD :) He he :) Showing final signals of downtrend in PA. Loading entries during this upcoming week.


0x Price Analysis ZRX / USD: Uncertain Future0x / USD Short-term price analysis
0x has a bearish short-term bias, with the cryptocurrency trading well below its 200-period moving average on the four-hour time frame.
The four-hour time frame shows that a falling wedge pattern has now formed, with the ZRX / USD pair bouncing sharply from major trendline support.
Technical indicators on the four-hour time frame are bullish and continue to generate a strong buy signal.
Pattern Watch
Traders should note that falling wedge patterns are typically considered to be bullish reversal patterns.
Relative Strength Index
The RSI indicator has also turned bullish on the four-hour time frame and is now issuing a solid buy signal.
MACD Indicator
The MACD indicator has turned bullish on the four-hour time frame and is currently generating a strong buy signal.
0x / USD Medium-term price analysis
0x has a bearish medium-term outlook, with the cryptocurrency continuing to trade below its trend defining 200-day moving average.
The daily time frame is showing that the recent decline in the ZRX / USD pair has invalidated a bullish inverted head and shoulders pattern that has been in play since the start of the year.
Technical indicators on the daily time frame are still turning lower and continuing to issue a sell signal.
ZRX / USD Daily Chart by TradingView
Pattern Watch
Traders should note that a neutral sideways price channel has now formed on the daily time frame.
Relative Strength Index
The RSI indicator on the daily time frame is attempting to recover, although it remains technically bearish.
MACD Indicator
The MACD indicator is bearish on the daily time frame and continues to issue a sell signal.
Conclusion
0x has staged a strong recovery from key support across both time frames, with short-term indicators continuing to point to further near-term gains for the cryptocurrency.
The recent invalidation of the inverted head and shoulders patterns on the daily time frame has made the ZRX / USD pair’s medium-term outlook more uncertain.

FOREX Markets Closed? No Problem, Trade CryptoBTC update, a live trade in LTC, and a few more Crypto ideas


ZRXUSD Looks Bullish0x: Decentralized Exchange
Triangles may appear mostly as ascending or descending pattern. But even more, interestingly, they form as reversal patterns too.
A triangle as a reversal pattern doesn’t suit every trader. Conservative traders won’t risk trading it.
However, aggressive ones will always look for a solid risk-reward ratio. A triangle chart pattern like this one offers such a reward.


0x Price Analysis ZRX / USD: Testing Bulls’ Patience0x / USD Short-term price analysis
0x has a bearish short-term bias, with the cryptocurrency trading below its 200-period moving average on the four-hour time frame.
The four-hour time frame continues to show a valid inverted head and shoulders pattern, with ZRX / USD pair slipping dangerously close to major technical support.
Technical indicators on the four-hour time frame are bearish and continue to generate a strong sell signal.
Pattern Watch
Traders should note that any invalidation of the bullish pattern on the four-hour time frame will be taken as bearish trading signal in the short-term.
Relative Strength Index
The RSI indicator is also bearish on the four-hour time frame and is approaching oversold territory.
MACD Indicator
The MACD indicator has turned bearish on the four-hour time frame and is currently generating a strong sell signal.
0x / USD Medium-term price analysis
0x has a neutral medium-term outlook, with the cryptocurrency testing towards its trend defining 200-day moving average.
The daily time frame is showing that bulls have failed to participate in the recent cryptocurrency market rally, with the ZRX / USD pair trapped inside a period of sideways price consolidation.
Technical indicators on the daily time frame are bearish and are starting to generate a medium-term sell signal.
ZRX / USD Daily Chart by TradingView
Pattern Watch
Traders should note that an extremely large inverted head and shoulder pattern remains valid on the daily time frame.
Relative Strength Index
The RSI indicator on the daily time frame is bearish and is currently issuing a sell signal.
MACD Indicator
The MACD indicator is also neutral on the four-hour time frame and is starting to issue a sell signal.
Conclusion
0x is starting to come under pressure across both time frames as bulls lose patience with the cryptocurrency, leaving the-door-open for technical selling.
With technical indicators turning lower, all eyes are now focused on the ZRX / USD pair’s 200-day moving average.

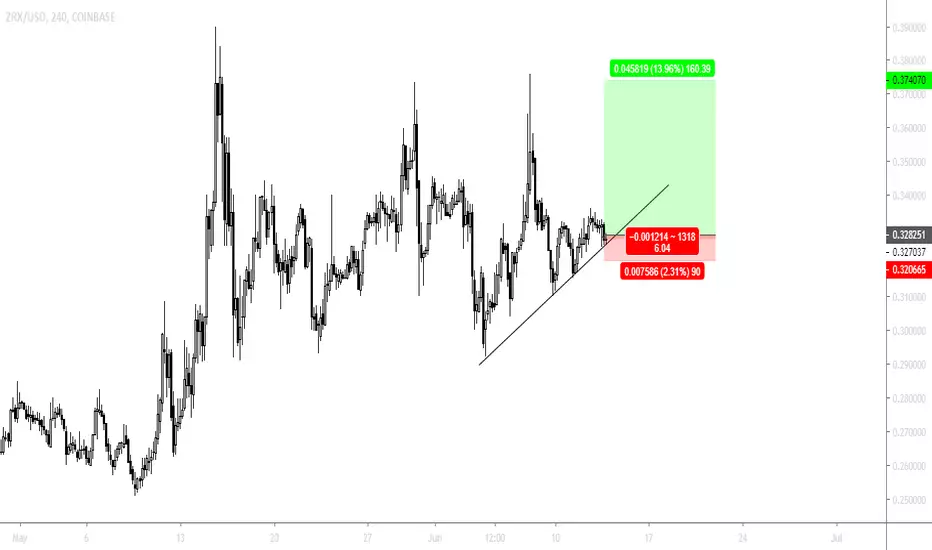
ZRX / USD - BULLISH TREND - 20% POTENTIAL - CryptoManiac101ZRX / USD TA
Trade is with just around 4% risk to 20% reward

$ZRX symmetrical triangle pattern soon to breakout? bullish consolidation may finally reward holders with a breakout.


ZRX/USD swing trade: imminent breakout 50% potential upsideZRX/USD is currently consolidating under resistance and it looks ready to breakout in the near term.
There has been series of higher lows and multiple retests of a weekly order-block. If it were to impulsively break through the order-block there's a good chance we could expect a ~50% increase in price up to the red line(53 cents).
I usually don't care for alt coins but the overall macro structure for ZRX is looking very bullish and it would be a good swing opportunity to take as long as the market (especially bitcoin) continues to be bullish. I wouldn't use a large amount of capital.

ZRXUSD LongSwing failure to the downside, retest of high causing swing failure low = long. Also matches up with daily block.
Here we go crypto
Stop loss below bullish orderblock


ZRX/USD Coinbase possible breakoutZRX/USD pair on Coinbase has a lot of potential for a breakout I think. We've got the pennant, volume increase, and repeated attacks on resistance.
Another factor I've taken into consideration is that all the new money on Coinbase typically would rather buy a large amount of a cheap coin than a small piece of Bitcoin or something that's more expensive. Despite price action. I've taken a position on ZRX although I do expect another small pullback before a proper breakout. Remains to be seen. Later traders.

0x Box Range (ZRX/USD)One approach to trading a box range is to find a consolidating range bottom with low volatility. Buy when there is a test of the support level in an uptrend, placing a stop loss if price makes a new low. Increasing volume should confirm buying interest. After a breakout, buy on a throwback and retest of the resistance line.

ZRX - Bullish Ascending TriangleIt looks like a Bullish acending triangle forming. Will be looking to TP at the 0.5 retrace