Pepe (PEPE): Just Had Market Structure Break, Be Careful!We just had an MSB (market structure break) on PEPE coin, which might result in a bigger movement to lower zones here.
What we are going to look for here is a possible BOS (break of structure). on smaller timeframes, which would be an ideal entry for a short position here (up until our buy entry area).
Swallow Academy
1000PEPEUSDT.P trade ideas

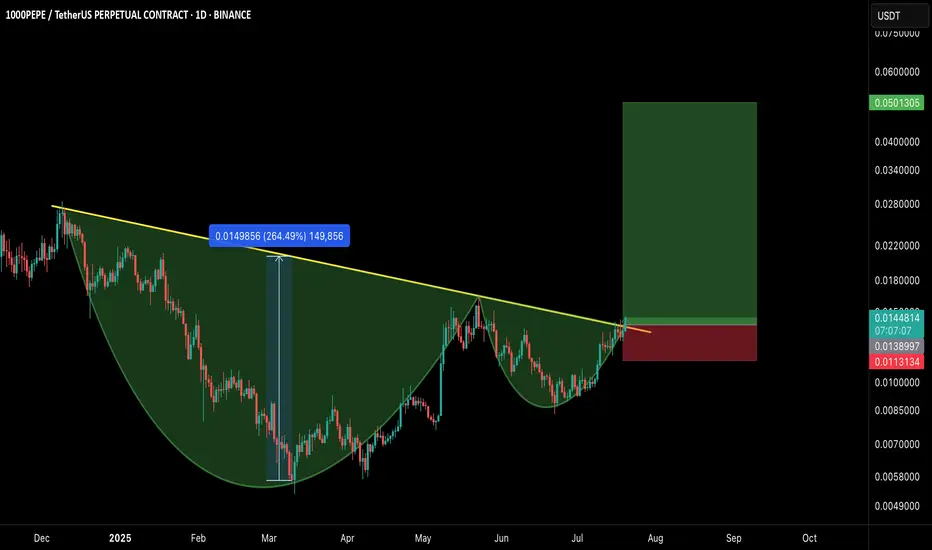
1000PEPE/USDT – CUP & HANDLE BREAKOUT!Hey Traders!
If you’re finding value in this analysis, smash that 👍 and hit Follow for high-accuracy trade setups that actually deliver!
A classic Cup and Handle formation just broke out with strong bullish confirmation, signaling the potential start of a massive trend reversal on the higher timeframe.
📊 Pattern Breakdown
✅ Cup & Handle pattern forming over 7+ months
📐 Breakout above neckline with volume confirmation
📈 Measured move target points towards $0.0501+
🛒 Long Entry:
CMP or on retest near $0.0128–$0.0138
🎯 Targets:
TP1: $0.022
TP2: $0.028
TP3: $0.035
TP4: $0.050
🛑 Stop-loss:
Below handle low — around $0.0113
📌 Risk-to-Reward:
Insane potential here with a 3.5R+ setup even with conservative targets.
📢 Final Thoughts:
This is a textbook reversal pattern breaking out after long accumulation. If BTC remains stable or bullish, meme momentum could supercharge this move.
DYOR + SL is a must!
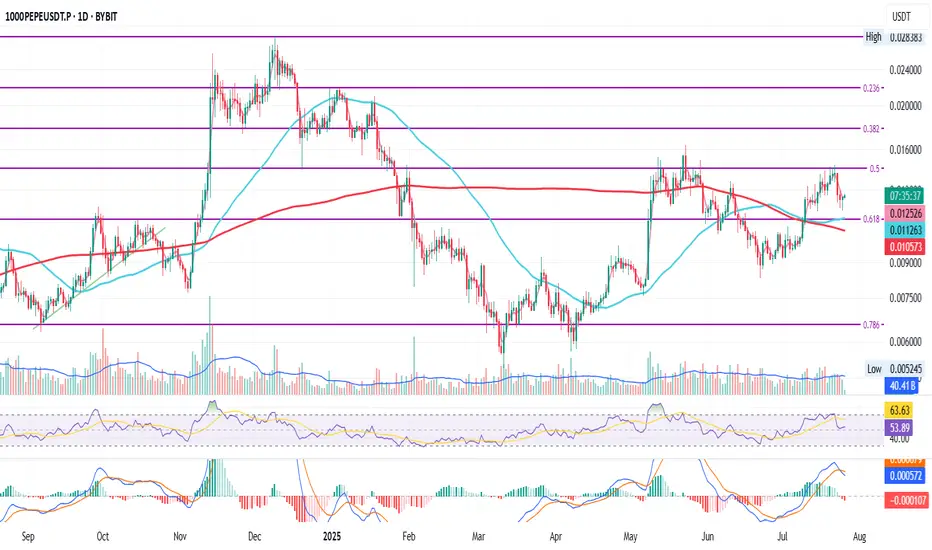
PEPE Daily Setup Holding Strong
This is PEPE on the daily
Price recently crossed above the 50MA which is currently resting on the 200MA after a golden cross
It was rejected at the 0.5 Fib but is now holding above the 0.618 Fib as well as the 50MA and 200MA
RSI is finding support at the mid level while MACD just turned bearish
Chances are we see a pullback first, a search for support, before the next possible move up
We’ll be here to watch it unfold
Always take profits and manage risk.
Interaction is welcome.

1000PEPEUDST.P LONG1000PEPEUSDT.P has broken its trendline. Time for massive longs moves!
Entry Area
.010215
SL
5-10%
TP in fib areas:
-.0113737
-.0123232
-.0132727
-.0146245
Greedy target
-.0213191
#DYOR
#TYOR
#NOT A FINANCIAL ADVICE
USE LOW LEV & MARGIN ONLY!
HAPPY TRADING!


PEPE/USDT – Falling Wedge Breakout!Hey Traders — if you're into high-conviction setups with real momentum, this one’s for you.
CRYPTOCAP:PEPE has finally broken out from the falling wedge structure on the 4H chart after weeks of consolidation. This is a bullish reversal pattern that historically leads to explosive upside moves.
✅ Breakout Confirmed
✅ Above the 100 EMA
✅ Volume picking up post-breakout
🎯 Targets:
$0.0115/0.0126 / 0.0138 / 0.0147+
🛑 Stop Loss: 0.00975
⚡ Leverage: 5x-10x max (Scalp/Short-term swing)
If momentum sustains, we might see 40%+ move.
Let’s ride the wave. Stay sharp!

Pepe (PEPE): Buyers Are Slowly AccumulatingPepe coin seems to accumulate currently where buyers are preparing to form a new local high. With that being said we do not see any strong rejection but near 0.022 area which we will be setting as a target for us (as long as price hold the area above EMA)
Swallow Academy

1000PEPE (PEPE): Good Risk/Reward Trades Can Be Taken | WaitPepe coin has shown us a good upward movement recently, and we are now at a pretty crucial zone. It does not matter if we see a breakout or breakdown; we are going to wait for a perfect sign in the form of a break, which would then give us either a 1:2 RR or 1:4 RR position that we can take.
Swallow Academy

Pepe (PEPE): Strong Dominance From Sellers | Short Setup!Pepe coin has a good chance to fall where we have formed here a nice smaller bullish channel, and recently sellers had a decent rejection from the upper resistance zone, and sellers secured the EMAs.
It seems like the price is doomed to fall towards the lower zone here so as long as we are below EMAs, this is going to be our game plan for PEPE.
Swallowa Academy

1000PEPE looks good from here?I did my analysis on different times frames, On higher time frame we are bearish, Short time frame up or down is unpredictable. On as you guy can see price didn’t respect trend and breakdown’ It’s does means that 100% is goin down because we also have Fib Support may that change the market direction from bearish to bullish. We also have FVG which didn’t respect it also and As you guys can see the situation of market mostly up and down by news. So I don’t expect anything good news for the market right now but we should prepare for everything. Those analysts on daily time frame.

The FVG told the story. The chart just caught upThis wasn’t a pump. It was a re-delivery. Price tapped into the daily Fair Value Gap, respected the zone, and printed structure off the low. The retracement didn’t break us — it loaded us.
The logic:
The move began from an untouched Daily FVG — clean displacement, low retest, and now price is working its way through old inefficiencies. There’s no breakout here. Just one thing: delivery.
TP: 0.0163 — high timeframe imbalance resolution and prior volume pivot
The setup didn’t beg. It whispered. And now it’s unfolding, with confluence from every angle — market structure, volume, and intention.
Execution:
Entry: 0.0109–0.0113 (already in the zone)
SL: Below 0.0092
TP: 0.0163
Let others laugh at frogs. I’m here to extract liquidity from their disbelief.
Final thought:
“The move doesn’t care if you believe in it. It just needs a reason to unfold.”

1000PEPEUSDT Perpetual – Demand Zone Long ReversalThis setup is a long (buy) strategy on the 1000PEPEUSDT.P pair, targeting a potential rebound from a key short-term support zone after a sharp pullback.
Setup Details:
Position: Long
Entry Price: 0.0108444
Stop Loss: 0.0106394
Take Profit: 0.0120046
Risk-to-Reward Ratio (RRR): ~5.66
Timeframe: Likely 1H or 4H based on candle size
Rationale:
Price is approaching a strong horizontal support zone that has held multiple times in the past.
The most recent candle has a long lower wick, indicating buying pressure or rejection of lower prices.
The trade anticipates a quick bullish reaction from this support level.
Take profit is set near a previous minor resistance / swing-high.
Summary:
This is a demand-zone reversal play suitable for scalpers or intraday traders looking for a high RRR bounce setup. Ideal confirmation would be a bullish engulfing or momentum candle forming after entry.

Bullish Setup with Harmonic + HL Retest PEPE is showing a potential bullish continuation after forming a Higher Low (HL) near key trendline support. The C point bounce aligns with a harmonic PRZ and macro market structure, suggesting a 70%+ upside move if confirmed.
📍 Entry: ~$0.0109 (support + HL retest)
🎯 Targets:
TP1: $0.0130 – minor resistance
TP2: $0.0155 – previous LH zone
TP3: $0.0176 – harmonic D projection
TP4: $0.0203 – full extension target (~72% gain)

PEPE CAN IT BREAK AND PUMP ?$1000PEPEUSDT: Zone Action!
🔴 Red Zone (0.012050 - 0.012150): Currently battling here. Expect DUMPS FROM RED, but a break means PUMPS IF BREAKS RED! 🚀
🔵 Blue Zones (0.011400 / 0.011000): If we dip, look for PUMPS FROM BLUE. Break below = DUMPS IF BREAKS BLUE! 📉
Watching these levels closely!

BTC Traps Before the Pump?BTC Traps Before the Pump?
15-min hidden bullish divergence spotted on OBV 🫢
Liquidity stacked above I’m expecting a move up during New York session and Powell’s speech.
We saw a sharp dump from the daily open but before the real move unfolds, one more push up to take out liquidity makes perfect sense.
Could be the trap… before the launch. 🚀
Let’s see how it plays out.
#BTC #Crypto #Powell #SmartMoney

#1000PEPEUSDT LONG IDEA🟢 Took PEPE long after NY open
BTC has stabilized with the New York session open
as I mentioned earlier, I’m expecting upside continuation.
That’s why I tapped into CRYPTOCAP:PEPE long.
🎯 Reasons:
• 5M bullish divergences on CCI, OBV, MOM
• Liquidity above including daily open & PDL
• Price holding support + reactive strength
If BTC stays healthy, I expect alts to breathe this weekend.
Let’s see how it plays out.
Plan your levels. Stay sharp.

1000PEPEUSDTSHORTPrice has just tapped the POC (Point of Control) and showed an immediate reaction signs of absorption at the high.
The structure remains weak, and with London session approaching, we could see continuation to the downside.
🔍 Context:
Price rejected at key volume node
Consolidation under resistance
Potential for lower high formation
Liquidity resting below the range
I'm already in a short position from current levels, with eyes on the next support zones for possible TP.
Let’s see if London delivers the momentum for the next leg down.

1000PEPEUSDT LONGPEPE/USDT – Possible Deviation Setup Forming | 15M Chart
We're currently trading above the 2.618 Fib extension level (0.0144590) — a key golden ratio zone.
There’s also a clear divergence on both MACD and CCI (15m TF), signaling potential momentum exhaustion.
The Volume Profile shows a low volume node above the current range — lots of untapped liquidity waiting to be swept.
This consolidation looks like accumulation during the Frankfurt session, followed by manipulation during London.
If BTC remains stable, I expect a deviation move during New York session, potentially sweeping highs above 3.618 (0.0148803) and into 4.618.
📍 Watching for a fake breakout and potential reversal setup from the upper fib zones.
Let’s see how it plays out.

LONG SETUP | 15M ChartLONG SETUP | 15M Chart`
Asia session gave a fakeout dump followed by strong buying pressure.
Price reclaimed key support and broke structure with OBV confirmation.
Now consolidating above equilibrium.
Entered long with invalidation below 0.0142988.
Targets:
1️⃣ VAH zone — 0.0146740
2️⃣ Final target — 0.0146757 (FVG top)
Holding unless structure breaks down. Let’s see if the bulls have fuel. 🚀📈

PEPE SHORT 5 MIN CHARTThe price hit the VAH and failed to break through. If we get a reaction, a lower low is likely. I’ve entered a position.

Long PepeBreaking through the resistance at 0.0138857 will open the way to the VAH and the 1.618 Fibonacci level.
