Phemex Analysis #84: Pro Tips for Trading PEPEIn the vibrant and ever-changing landscape of cryptocurrency trading, PEPE ( PHEMEX:1000PEPEUSDT.P ) has recently captured significant attention from investors. Over the past 30 days, PEPE surged an impressive 130%, showcasing strong bullish momentum after a prolonged downtrend. This recent rally has rekindled investor interest, suggesting that a potential bullish reversal may be underway.
Yet, with volatility remaining high, traders should remain cautious.
Let’s explore several possible price scenarios and strategies to capitalize effectively on PEPE’s movements.
Possible Scenarios
1. Accumulation Followed by Breakout Rise
Currently, PEPE is showing signs of accumulation in the $0.015 to $0.012 range. This sideways consolidation typically indicates that market participants are gathering positions before a potentially significant upward move. If PEPE breaks decisively above the critical resistance at $0.0163, especially accompanied by a notable spike in trading volume, it would be a strong confirmation of bullish sentiment.
Pro Tips:
Entry Strategy: Consider accumulating positions within the consolidation range ($0.015 - $0.012). Wait for confirmation of a breakout above $0.0163 to scale up your positions confidently.
Risk Management: Place stop-loss orders below $0.012 to mitigate downside risk should the breakout fail to materialize.
2. Retesting the $0.007 Support Area
A pullback scenario could also unfold, bringing PEPE’s price down to retest the critical support zone around $0.007. If this retest occurs with relatively low trading volume and the RSI remains higher compared to previous lows—signaling a Double Bottom formation with RSI divergence—this could provide an excellent accumulation opportunity.
Pro Tips:
Accumulation Signals: Monitor trading volume and RSI closely. A successful retest at $0.007 with bullish divergence could indicate strong buying pressure.
Entry Confirmation: Conservative traders may prefer waiting for a confirmed breakout upward from the $0.007 support area before entering positions.
3. Bearish Drop Scenario
Despite the recent bullish signs, a bearish scenario remains possible. If PEPE declines towards the support level at $0.012 with increasing trading volume, and subsequently drops to $0.007 with even higher volume, it could indicate strong bearish momentum and weak market sentiment. Under these conditions, caution is highly recommended.
Pro Tips:
Market Caution: If price action unfolds this way, it’s advisable to refrain from entering positions immediately.
Wait and Observe: Allow price to stabilize before reconsidering any potential entry points, ensuring clear evidence of support.
Conclusion
PEPE’s recent 130% surge represents promising signs of a bullish reversal, yet navigating such volatility demands careful planning and strategic execution. By closely monitoring the outlined scenarios—recognizing accumulation signals, bullish divergences, and maintaining disciplined risk management—traders can maximize their potential returns while minimizing risk exposure. Always stay alert, responsive to market signals, and ready to adapt to changing conditions to trade PEPE confidently and profitably.
Tips:
Trade Smarter, Not Harder with Phemex. Benefit from cutting-edge features like multiple watchlists, basket orders, and real-time strategy adjustments. Our unique scaled order system and iceberg order functionality give you a competitive edge.
Disclaimer: This is NOT financial or investment advice. Please conduct your own research (DYOR). Phemex is not responsible, directly or indirectly, for any damage or loss incurred or claimed to be caused by or in association with the use of or reliance on any content, goods, or services mentioned in this article.
1000PEPEUSDT.P trade ideas

PEPE Daily – Testing Key Fib Support
After getting rejected at the 0.5 Fibonacci level on May 14, PEPE is now retesting it as support.
On the way down, price found support at the 200MA, even after briefly closing below it on the daily chart.
You could argue MLR > SMA, but both are still above the BB center and the 200MA, which maintains the overall bullish structure.
⚠️ Watch for a daily close below the 0.5 Fib—that would weaken the structure and could lead to further downside.
Look closer at smaller time frames.
Thanks for reading—if you found this engaging, react or comment.
Always manage risk and take profits. 📊

PEPE - Trade is on the way - Reading Speed IndexChart reading using price location, volumes and Speed Index:
1. We are on Fib (buyers could enter here)
2. Fast down wave on the way to Fib with SI at 16.7 while the average was 26.3
3. Next down wave it's a very slow wave and it look like an HTMD (hard to move down) with a very high Speed Index of 47.8 while the average was 26.8 (probable buyers absorbing sell orders). This is change in Behavior , but in order to confirm the reading it would nice be for the forming down wave to finish with a high Speed Index.
4. AVWAP blue lines act as resistance. Finally to enter long we need price to break resistance level marked with the black line, otherwise we might get stuck into a range and you never know what's going to happen next.
Patience! Enjoy!

PEPE key levelsBINANCE:PEPEUSDT
The chart shows partial zones for buying this asset.
Further on there will be a good profit to risk ratio.

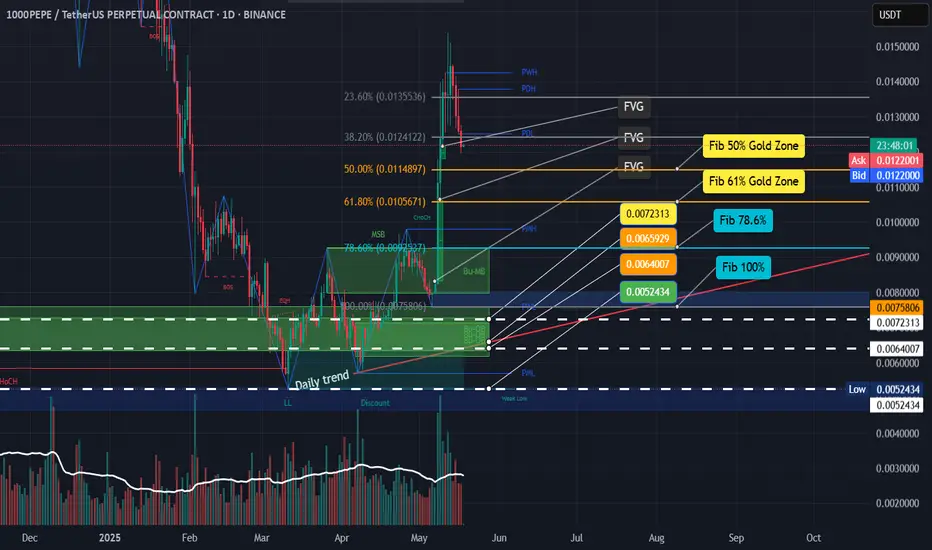
$1000PEPE | Smart Money Retracement Levels - Watch FVG + Fib ConAfter a strong breakout and Change of Character (ChoCH), $1000PEPE is now pulling back into a potential premium-to-discount retracement. I'm watching the following key areas:
FVGs + Fib Gold Zones (50% & 61.8%) = high-probability bounce regions
Bu-MB & Bu-B zones = smart money interest area
Daily MSB confirms shift in structure
Key retracement levels:
🔸 Fib 61.8% at 0.0105671
🔸 Fib 78.6% at 0.0091527
🔸 Fib 100% at 0.0052434
Targets: Reclaiming PDH / PWH could suggest continuation.
Invalidation: Break below 0.0052 weak low area (LL) cancels bullish bias.
PEPE - This is why price explode - Speed Index ReadingThere is always a reason why price explodes either true or fake. The criteria to look at are:
- Location - very important - where is the price locate - higher probability trades accomplished when the price leaves a significant location such us Fib, Sup/Res, AVWAP
- The volume waves - nothing moves without volume - sometimes is not so visible by the volume waves alone because they distribute or accumulate little by little, that's why we have Speed Index
- Reading Speed Index
- The proper entry signal
In the attached chart I will demonstrate how I read it using the above criteria (annotations are in sync with the chart):
1. Price entering Fib Area 50-61.8 - possibility of buyers to come in
2. Price touching AVWAP (three blue lines) coming from the bottom of a previous swing acting as resistance - another possibility of buyers to come in.
3. Speed Index 6.4, that's an abnormal speed index , that what I call first push up or PU, price never drops below the beginning of this wave
4. Speed Index 11.1, that's another abnormal speed index and that's what I call a hard to move down (HTMD) . What's happening here is that all the sell orders are absorbed by buy orders and price breaks on the up wave the origin of the HTMD wave.
5. Finally the entry Long with a PRL (Plutus Reversal Long) signal an up,up,up, we go!!!
I hope my years of work helps you out on reading charts!
Enjoy!

PEPEPEPE has broken to the upside with really good strength and volume. I identified and OB which lies near previous resistance hence making it a valid OB.
Looking for a tap, than a confirmation on the 15 min timeframe and then I will share my entries.

PEPE consolidatePEPE still did'nt find want to up or go down cause the centiment of market still sideways ,we all waiting policy of tarifff

PEPE - Entered Long based on Lesson 15Lesson 15 Methodology;
1. Largest Down wave after a while (Buyers possible entering)
2. Placed AVWAP at the beginning of the down wave and wait to cross upwards and pullback
3. Enter on Plutus signal Long in this case PL
Stop loss below Low AVWAP line

Copy Paste Lesson 15 on PEPELesson 15 Methodology
This trade is a copy paste from my previous post
1. Largest Up Wave (sellers might be entering on large waves-to connfim later on)
2. Anchor AVWAP
3. Price respecting AVWAP as resistance several times
4. Enter on a Plutus Short signal
....and down we go !!!

PEPE/USDT PERPETUAL TRADE, SOLD FROM 0.0089500PEPE/USDT PERPETUAL TRADE
PEPE SELL SETUP
Currently $0.0089500
Sold at $0.0089470
(Trading plan If PEPE/USDT up to $0.009500 we will add more sell)
Expecting target $0.0085100 0R DOWN
Incase of early exist will update this anaylsis
Its not a Financial advice

03-23-25With PEPE now creating HH and HL, a slight retest to create its HL by tapping the 4H order block above, with this structure a possible bullish run could run the the next week.

$PEPE - Local SupportCRYPTOCAP:PEPE | 4h
The price is now outside the distribution curve and is starting to establish a base here
If we can hold .0070 to .0068 (PoC), I believe we could test .008 to .009 (short-term target).
I expect the price would pull back down to the current level .0070s before we reach higher targets.

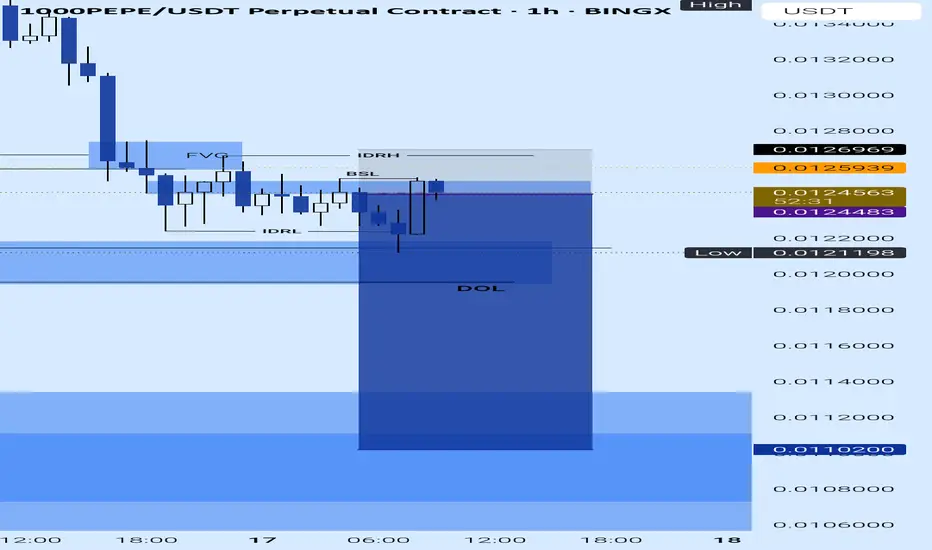
Bearish opportunity in PEPE1. On the daily chart price has purged to Daily SIBI LOW - This is my main PD array
2. On H1 we have MSS confirming orderflow
3. We have draws as the sellside liquidity
On the fundamental side:
"The SEC just said that meme coins are generally NOT considered securities under US federal law.
They also said that meme coins have "limited or no use" and do not need to be registered with the SEC.
"Did the SEC basically just call meme coins so worthless that they're not even considered a security? "
"quoted from the, The Kobeissi Letter on X/Twitter"

PEPE POSSIBLE BOUNCEAfter the dump pepe bouced and there was retracement so I am taking a Long position here, there might just be a Bounce here again
NFA DYOR

PEPE Short term BullSince markets a bit slow today, yet were expecting a volatile week, heres an analysis i have and would love to hear more from the public.
A lot of imbalances were left and has turned into supports/ resistances, more likely to crash in the following weeks rather than getting a bull run, OR just setting up a double bottom (Weekly) before hitting then alt season.

#1000PEPEUSDT expecting further decline!📉 SHORT BYBIT:1000PEPEUSDT.P from $0.009650
🛡 Stop Loss: $0.009875
⏱ 1H Timeframe
📍 Overview :
➡️ BYBIT:1000PEPEUSDT.P remains under selling pressure after failing to sustain an upward move. The price is trading below the key POC $0.010072 , which previously served as a high-liquidity zone.
➡️ The recent breakdown of $0.009815 , followed by a retest as resistance, confirms the bearish scenario.
➡️ If the asset holds below $0.009650 , this could trigger a move toward $0.009242, where buying interest was previously observed.
➡️ Current price action shows weakness in buyers as volume does not support an upward breakout.
⚡ Plan :
➡️ Enter short once a firm breakdown below $0.009650 is confirmed.
➡️ Risk management through Stop-Loss at $0.009875 , positioned above the nearest resistance zone.
➡️ The main downside target is $0.009242 , where profit-taking and a possible bounce could occur.
🎯 TP Targets:
💎 TP 1: $0.009242
📢 BYBIT:1000PEPEUSDT.P is showing signs of further downside, with no strong buying reaction at the moment.
📢 The $0.009242 level should be closely monitored as a potential support zone. If weakness persists, breaking this level could accelerate downward pressure.
📢 For those holding long positions, caution is advised when facing repeated resistance retests.
🚀 BYBIT:1000PEPEUSDT.P continues to show weakness — expecting further decline!

PEPE $17Billion-$13Billion marketcap achievable?PEPE has rebounded to a key Fibonacci level, and I anticipate a final upward leg targeting a market cap of $17-13 billion . With a supporting bullish divergence, I am confident that PEPE is well-positioned to achieve this target.

PEPE BARTEat my shorts! Okay the bart hairline has developed and lots of new liquidity being trapped. I cant write this fast enough, and gotta JOMO anyway because dayjob. But short PEPE at these levels. Down to the 333 period moving average on the daily.

PEPEUSDTKey Features
Support and Resistance Levels:
Support:
The first support level is marked around 0.0124 (middle blue line).
A deeper support level is identified at 0.0052 (bottom blue line), which represents a historical low area.
Resistance:
The key resistance level is around 0.0265 (top blue line), where the price previously faced rejection.
Current Price Action:
The price is currently trading near 0.0163, which is closer to the middle support zone.
The red and green arrows suggest potential scenarios:
Green Arrow: A bullish move toward resistance at 0.0265 if buyers regain control.
Red Arrow: A bearish move breaking below support at 0.0124, with the next potential target being the lower support at 0.0052.
Trend Overview:
The price experienced a significant rally in 2024, followed by a pullback, and is now consolidating between the middle support and resistance levels.
The overall trend is neutral, with the price stuck in a range.
Potential Scenarios
Bullish Scenario:
If the price bounces from 0.0124 and gains momentum, it may attempt to test the next resistance at 0.0265.
A break above 0.0265 could indicate a continuation of the uptrend, with potential for further upside.
Bearish Scenario:
If the price breaks below 0.0124, it could trigger a sell-off toward the next major support at 0.0052.
This would indicate bearish sentiment and could result in a prolonged downtrend.
Trading Strategy
For Buyers:
Look to buy at 0.0124, the key support zone, if there are signs of a bullish reversal (e.g., bullish candlesticks, volume increase).
Consider adding to positions if the price breaks above the resistance at 0.0265, targeting higher levels.
For Sellers:
Consider selling if the price shows rejection near 0.0265, with a stop loss slightly above.
Look for a short position if the price breaks below 0.0124, targeting the lower support at 0.0052.
Risk Management
Stop Loss:
Buyers: Below 0.0124.
Sellers: Above 0.0265.
Take Profit:
Buyers: Around 0.0265 or higher.
Sellers: Around 0.0124 or 0.0052.

$BYBIT:1000PEPEUSDT.P SnapshotThis is my view on 1000PEPEUSDT what i observed is that the market is bullish so we look for buy opportunities.
1. I saw a very good entry on the 4h and it it broke structure.
2. Moved to 1h ltf to find entry for buy order.
3. The reason i placed my stop loss at 0.017278 level is because i can see some sell side liquidity lying below that area.
4. About the take profit we are expecting the buy side liquidity to be taken.

SHORT PEPE NOW! becauseAs in the chart attached to this article, the price of PEPE/USDT or 1000PEPE/USDT.P (for those trading the perpetual symbol, PEPE is currently on a downward movement on the daily, which is a clear sign of a downtrend. In this analysis, a perfect retracement of 79% on the FIB is at the place of interest, which has very high level of confluence which i can't go over in this article. But if you'd like to know how i got the accurate entry to this trade and more exactly like this, follow, and i'll interact with you. For now, enjoy this trade, and lets ride the wave together.
P.S: Don't forget to set your limit orders!
@realalvaritarfa
