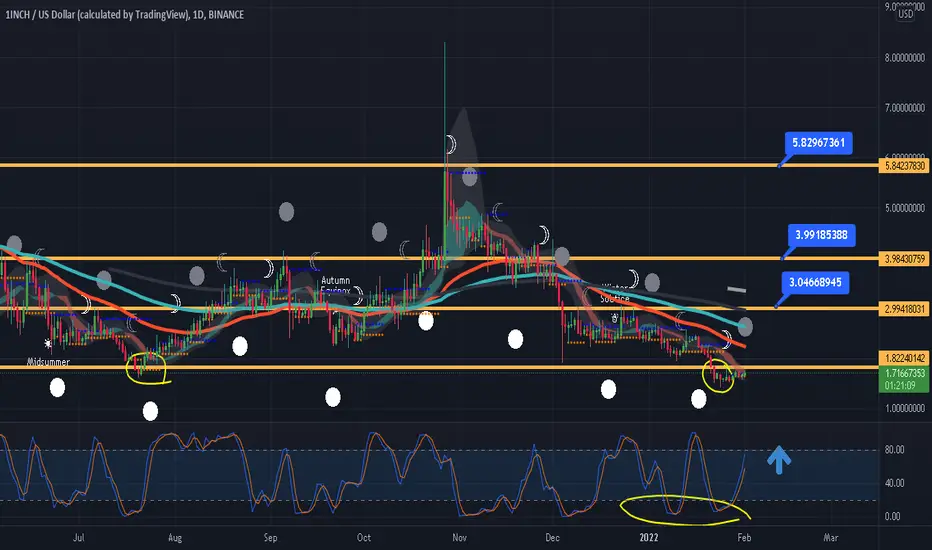
Adding to shorts on trigger if upward sloping channel is breacheAdding to shorts on trigger if upward sloping channel is breached and retested.
1inch managed to keep trading in this uwpward sloping channel for aprox 12days.
if it breaks out i assign a high probability that we go back to the lows;
1INCHUSD trade ideas

Leaving this heredo what you want with it... seems to be a very low risk to reward ratio
however there could be another dip, keep that in mind
breaking ichimoku cloud, and could tap support one more time

1INCH price predictionConsidering the previews upsides of the falling wedge chart pattern, it is reasonable to think that 1INCH could read $3.45 on the next pump.
Looking forward to read your opinion about it.

1inch shortlooking for a entry on 1inch for a short.
daily trend has been respected downtrend still valid 4 hr supply formed and confirmed entry confluent with HTF range EQ.

1Inch Swing1INCHUSD Short/Midterm Swing Projection
Preliminary Entry: 1.73
21.96% from Preliminary Entry to 1.618 Fibonacci
Limit Sell Target Range: 1.92-2.12
Invalidation Zone: 1.61-1.54
*Not Financial Advice, DYOR
Please Allow 2-14 Days for Swing

1INCH is Inching CloserReversal breakouts are setting up all over the place right now!
Our FTXPERP list is primed and ready.
So what have we noticed?
1. Price has trended significantly towards the downside and the sellers are now starting to look exhausted
2. Change in market structure
3. Price setting a new support level
4. Divergence between price and RSI
Targeting 2:1 as initial take profit and will move stops up with market structure

1 INCH trading planI am sharing my trading plan on 1INCH/USD pair. I will not do anytihn until it bounces form support zone. After I will be looking for flip over r/s levels. If I see a retest combined with good signals from RSI and MACD, I might invest some money on this pair.

1inch - Trade ReminderGreat BUY opportunity....Buy Low and Sell High.
30 days forecast = TP1
Like this idea ? Please do a thumbs up.
Thank you for watching.

1 Inch - Long1 Inch is at strong support ( Double Bottom) and heading for TP1
30 days forecast = TP1
Like this idea ? ....Please do a thumbs up.
Thank you for watching.
1inch looking to break upMVRV ratio is been below -15 for the last few days is a great buying opportunity. Finding support above this trend line would confirm the recovery. Of course as long as btc doesn't dump

1Inch Looking Bullish for Short to Mid Term1Inch has been testing and retesting it's Demand Zone and is helding up well in these tough times when whole market is shaken up because of SPX tanking down thanks to FED.
Therefore, once this FEAR and FUD from FED would be removed pretty soon then we can expect bullish price action happening in Crypto market for Short to MID Term.
This is my current BTC View due to which i am bullish on Crypto market for next few weeks :-
This is not a financial advice by any means. This is my personal view and idea and my personal position with my own reasoning that makes me bullish in these FUD times on Market.
Rest, i hope you guys would like this post and if you have any feedback please do lemme know.
& if you have a request to analyse any coin then also please do let me know about that.
Enjoy everyone and Trade Safely.

1INCH, finally rebounded.The following content is machine translation:
In recent days, the lower shadow line of December 4 has been repaired.
After the repair, it was supported and is currently rebounding.
The big Yangxian broke the downtrend line today.
The indicator macd rejects dead forks.
In operation, look for more, pay attention to the resistance of price 3, break through 3 and see near 4

1 INCH - LONG1 INCH LONG....Buy Low Sell High... Buy on 18 th jan 2022
Like this idea ? Please do a thumbs up. Thank you for watching.

it's a clear buying opportunitycrab harmonic pattern:
X=$27.2
AB=0.61 XA
BC=0.38 AB
0.78 XA=$9.5
*1.6 BC=$12.1
0.88 XA=$15.5
2 BC=$23.37
2.24 BC=$35.36
1.13 XA=$51.53
*2.6 BC=$67.9
1.27 XA=$103
1.41 XA=$204
*3.6 BC=$381
*1.6 XA=$567
4.23 BC=$1107

1INCH head and shoulders Looking at the daily chart a clear head and shoulders is forming. We are breaking the downtrend that completed the head, now consolidating to start forming the right shoulder.
The adx has a downtrend that has not broken yet but I think it will then we will see momentum.
The TMO is squeezing to the upside
Over all I think this could be a good possibility we can hit the 4.10 mark. then fill in the right shoulder before heading back down to retest the strong support we have tested and kept the continuation in forming the h&s pattern.
My idea is enter now take profits at the $4 mark that is at the top of the right shoulder and see if we break back down. This is my personal opinion and I’m not a financial advisor.


1INCH LONG1inch trade took me in last pullback. I see we are going to break trendline and we are above on the support line.
Long term TP is at 9

1inch going 100% gains?i think from past times, it will go 100% gains EASY. and this chart shows how

1Inch price targets for Weekly Ascending-Triangle / Bullflag1Inch price targets for Weekly Ascending-Triangle / Bullflag
Also a perfect inverse H&S shown in MFI indicator

BreakoutAscending triangle after downtrend. Trading a breakout here with target 1 somewhere near $3 and target 2 below 50 MA (somewhere around $3.20).

MY MINIMALIST CHART ANALYSIS FOR 1INCH Altcoin$1INCH
12.02.21
0738H +8 SINGAPORE
Disclaimer:
The findings of the following analysis are the sole opinions of the publisher of this idea and should not be taken as a piece of investment advice.
ALERT:
LOOKING FOR BEST fo a SWING TRADE.
We are now looking at a NEW ENTRY POINT. Wherein the market has contracted significantly.
VITAL SIGNS: RSI, STOCH, and VOLUME are all looking good. We are waiting for accumulation and distribution and then the COILING of THE MARKET.
The previous SWING ended pretty well with amazing profitability.
The Market had amazingly moved along the TOPS and BOTTOMS of our BOXES, signifying TURNING POINTS of PRICE ACTION, together as predicting
certain major FIB Levels.
Hoping that this MINIMALIST BOX CHART ANALYSIS will efficiently help you with your DYOR as we climb this NEW SWING.
Happy Trading Everyone!
INSTRUCTIONS: HOW TO USE THIS MINIMALIST CHART
"FOLLOW THE WHITE RABBIT!"
Just Follow the TOPS and BOTTOMS of the BOXES as a GUIDE where the MARKET will take you.
Created on a MONTHLY, WEEKLY & DAILY Analysis of a MARKET'S CHARACTER.
It is designed for SWING TRADES at the BOTTOM. I do not SHORT, though, you can still use it.
TARGET ZONE IDENTIFICATION
The LARGE BOXES (Tops and Bottoms) are MAJOR turning points that will occur sometime in the future. While the SMALL BOXES (Tops and Bottoms) are MINOR turning points.
These can be entries to a BUY/ SELL POSITION, EXIT/PARTIAL EXIT/TOP-UP AREAS, as well as Support and resistance levels
Also includes MAXIMUM TARGET EXIT AREA OF VALUE - CONSERVATIVE (If price action conditions are right at that given moment.)
At times I include WAY BEYOND PARABOLIC Price TARGETS depending on The Character of the Market (CRYPTOS ONLY).
DYOR for your Volume, Chart Patterns, Candlestick Math, FIB COILS ( ABC ), Price Action, FIB LEVELS, Market Dynamics, especially institutional and retailer trading psychology.
Wishing you all The Best Trades and Thank you all for your Appreciation and Support of My Work.
Much thanks to My 3 Mentors. They are so much of a Blessing that I also wish to share my knowledge.
Vive Le Autist!
Vive Le Egalitarian!

1INCH - No Better Time to BuyClear area of support and resistance. Still need to still price impulsively rally from this area - but BTC has been misbehaving recently.
First target 7$
Second target 12$

1 inch LongYou can see from the chart that 2nd wave of elliot wave finished and it is the begin of the Wave 3 and in wave 3 is the longest wave than wave 1 and 5 which is also Motive wave. So, it is right time to buy the 1inch because you are getting at discounted price. At the end of 30 dec 2021, it will trading around $6.50 to $7.5. I hope you understand.
