1INCH Update
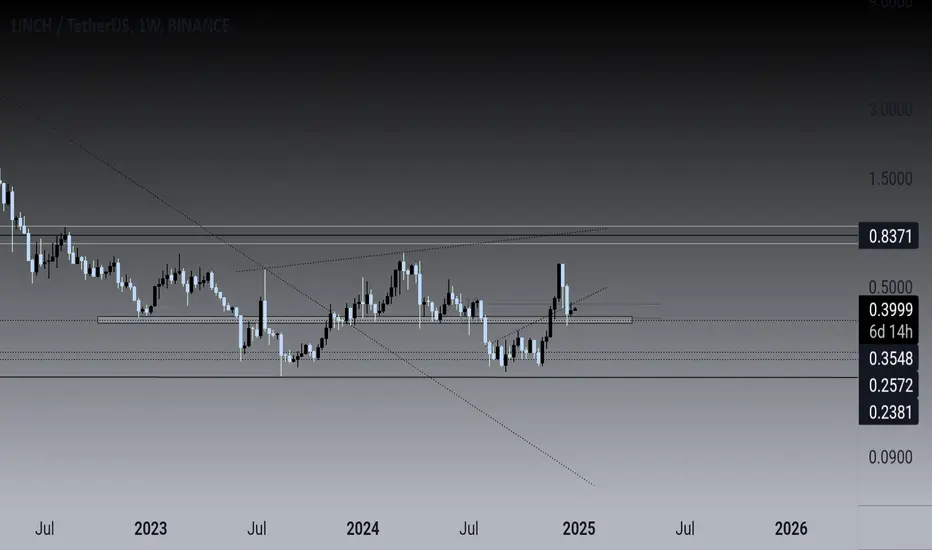
Price is still plummeting, and even though there was an interesting doji candle on Feb 3rd, it doesn't constitute by itself a reversal.
You can see in the chart a very similar pattern on December, which just led to further downside.
To consider a reversal, I'll wait for a break of key structures: green descending trendline and strong gray resistance.
1INCHUSDT.P trade ideas

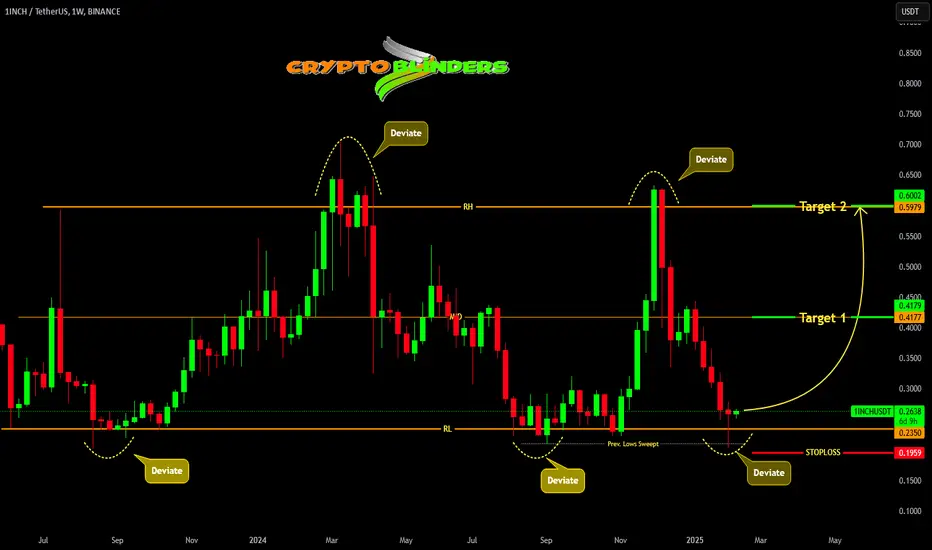
1INCH ABOUT TO MAKE A BIG MOVE !!!1inchusdt been trading in a range, had recently swept previous lows and deviated range low and reclaimed it. It signs a strength and we can expect targets of mid range and range high putting stops below recent low.

1inch review analysis: where to buy?hello friends
As you can see, this currency has grown well with the defeat of its suffering, now that it has entered a price correction, it is a good opportunity for us to buy in steps with capital and risk management.
We have specified goals for you.
*Trade safely with us*

1INCHUSDT 1W1INCH ~ 1W Analysis
#1INCH In Time Frame 1W re -test this support block. Buy from here if you still have a Conviction on this coin with a minimum target of 20%+

It can be monitored.It is now in a good area for purchase.
You can click with purchase confirmation.

1inch - Long Priority BINANCE:1INCHUSDT
✅Before we start to discuss, I would be glad if you share your opinion on this post's comment section and hit the like button if you enjoyed it.
Thank you.
Possible Targets and explanation idea
➡️We bounced from fundamental price value. Usually after that we follow to liquidity like magnet to "Exit line" by Take Profit indicator
➡️We probably will test with break out 1st resistance zone soon
➡️Already retested on D1 timeframe downtrend line since April
➡️Targets for November is 2nd resistance zone and test of global downtrend line
➡️Signal to Buy appeared on "Direction" indicator 20 September. No signal to sell or open short. Long priority
Hope you enjoyed the content I created, You can support with your likes and comments this idea so more people can watch!
✅Disclaimer: Please be aware of the risks involved in trading. This idea was made for educational purposes only not for financial Investment Purposes.
* Look at my ideas about interesting altcoins in the related section down below ↓
* For more ideas please hit "Like" and "Follow"!

1INCH Trend Shift1INCH has just change it's Downtrend perfectly into Uptrend and successfully retested too. Now it should move to our target area within few hours.
#nfa #dyor


1INCH Impulsive Wave
1INCH is giving us an impulsive wave count which is valid as long as we stay above 0.3204 (wave 1 high).
A break of the green descending trendline without invalidating the count, is a bullish trigger.
First target for wave 5 is 0.6500.

1inch Network (1INCH)Comprehensive Analysis of 1INCH/USDT 🪙
Introduction
1INCH is the native token of the 1inch Network, a DEX aggregator designed to optimize trades in the DeFi space. This platform enables users to access the best rates across various decentralized exchanges. The 1INCH token serves multiple purposes, such as reducing transaction fees, offering discounts, and acting as a governance token.
🔍 Technical Analysis Breakdown
1. Long-Term Descending Channel
1INCH has broken out of its long-term descending channel and is currently retesting the channel boundary. This pullback is a positive sign for a potential bullish continuation, but further confirmation is needed.
2. Daily Support Zone (Red)
The $0.3377 - $0.3757 range is identified as a key daily support level.
If the price stabilizes within this zone and starts to rise, it could confirm the pullback and signal the beginning of an upward move toward higher resistance levels.
3. Weekly Resistance Zone (Green)
The $0.6276 - $0.7049 range represents a significant resistance in the weekly timeframe.
A breakout above this zone, accompanied by increased trading volume, could lead to a rally toward the blue target zone ($1.1819 - $1.450).
4. Support in Case of a Drop
If the red support zone fails to hold:
The price might re-enter the descending channel and move toward the weekly support zone ($0.2101 - $0.2338), marked in gray.
📌 Suggested Entry Points
1. Breakout-Based Entry:
Condition: Price breaks above the green resistance zone with increased trading volume and stabilizes above this range.
2. Pullback-Based Entry:
Red Zone ($0.3377 - $0.3757): Enter with a stop-loss below the red support zone.
Gray Zone ($0.2101 - $0.2338): Enter with a stop-loss below the gray support zone.
Note: The gray zone offers a higher risk-to-reward ratio but comes with greater risk.
📈 Entry Triggers and Confirmation Signals
RSI Support:
Price holding above the midline on higher timeframe RSI charts can confirm the start of an uptrend.
Increased Trading Volume:
Breakouts of key zones must be validated by significant volume increases.
Low-volume breakouts could indicate false signals (fakeouts).
⚠️ Key Risk Management Tips
Volume Monitoring:
Ensure volume spikes during breakouts to avoid falling for fakeouts.
Capital Management:
Given the sensitivity of this analysis, strictly adhere to proper capital management strategies and set stop-loss orders at the identified levels.
Patience and Confirmation:
Avoid impulsive entries. Wait for clear confirmation signals before committing to a trade.
✨ Final Conclusion
1INCH is at a critical juncture from a technical perspective:
The breakout from the descending channel and the pullback to the support zone indicate a positive setup for a bullish continuation.
Close monitoring of price behavior in the key zones (red and green) is essential, with confirmations such as rising trading volume and RSI support being mandatory for entry.
A successful breakout of the weekly resistance (green) could lead to targets in the blue zone ($1.1819 - $1.450).
However, if the red support zone fails to hold, a decline toward the gray support zone becomes a strong possibility.

Will $1inch Break Free or Hit a New Low?$0.37 is the last resort for 1inch. 1inch has been ranging between $0.60 and $0.20 for 2 years now, indicating a lack of interest from investors and bulls. So right now, 1inch is either close to making a huge bullish move or close to a new all-time low.
We've seen a lot of these patterns; even though it can have a bullish breakout, the chance of the opposite happening is quite high as well. If 1inch fails to hold this support, $0.32 is the last support before it reaches $0.20. The market will decide. However, we still might see a bullish move from $0.32 with a lower chance.
If you already have 1inch, you can wait. If you want to buy, you should wait.

1inch/UsdtBINANCE:1INCHUSDT
$1inch/Usdt
📉 Current Price: $0.4000
📊 Support Level: $0.4303 (🛑 If it holds here, price may rise.)
🔼 Resistance Levels:
• $0.500 🚪 (First resistance)
• $0.553 🚧 (Second resistance)
• $0.600 🎯 (Target if upward momentum continues)
❌ If support at $0.4303 doesn’t hold:
⬇️ Next Support Levels:
• $0.3736 🔻 (First lower support)
• $0.3143 🔻 (Second lower support)
Not Financial Advice! Just an analysis for fun.

1INCH/USD Update1inch is finalizing the H&S pattern, small battle there for ~2 weeks to settled.
Afterwards is heading to $1.50 with a small stop at $0.95..
Exit should be considered at ~$10.00-$13.00

Trading opportunity for 1INCHUSDTBased on technical factors there is a Buy position in :
📊 1INCHUSDT
🔵 Buy Now
🪫Stop loss 0.4170
🔋Target 0.4530
📏 R/R 2,2
💸RISK : 1%
We hope it is profitable for you ❤️
Please support our activity with your likes👍 and comments📝

1Inch retest area to enter1inch just broke a trend and Waiting for a retest and I will enter in a trade we need to stay above above the trend but also wait for btc it just rejected from a resistance area and will restest again the zone of 98800 and we have another resistance at 99600

1Inch retest area to enter1inch just broke a trend and Waiting for a retest and I will enter in a trade we need to stay above above the trend but also wait for btc it just rejected from a resistance area and will restest again the zone of 98800 and we have another resistance at 99600

1INCH; Bullish potential aheadAfter a retracement to the 0.5 Fibonacci level of the bullish candle on the monthly time frame, 1inch is holding the support. Another small dump with the price reaching $0.36 is possible, and a bullish move afterwards is expected with an important resistance around $0.42. The mid-term target is $1.50, but a lot can happen before that. For now, the target of $0.85 seems achievable if we see bulls in action.
However, if we lose the $0.35 support, things will get bearish. The major and last support is at $0.20, and then even $0.10 could be possible. For now, the chart looks good for bullish moves in both the short and long term, unless the support is broken. I'll update the chart then.
"Rosy the Radiance Runner"-21/200 MA closing on Daily
- Fibonacci Extension
Embark on a mystical trading quest with a unicorn-inspired strategy, blending neutrality, Fibonacci analysis, and DeFi's decentralized treasures. Adopting a neutral stance akin to a wise unicorn, traverse the enchanted market forests with clear-headed adaptability. Harness Fibonacci retracement levels, ancient ratios guiding you to strategic entry and exit points, while exploring the almost-extinct treasures of decentralized finance (DeFi) like yield farming and liquidity mining. Navigate the untamed wilderness of decentralized exchanges (DEX), the modern-day hidden gems of trading. Develop algorithmic trading strategies that integrate Fibonacci principles and DeFi dynamics, unlocking mythical profits within the mystical realms of the market.

1 Inch chart Merry christmas
1 inch is in golden zone, diversion on the stoch, let hope it work out.
After bleeding the market these days.
Sunny regards

1INCHUSDT BULLISHAs we analyze the 1inch/USDT pair on the daily chart, we're currently observing a period of consolidation within a well-defined range. This sideways movement is providing a crucial opportunity to assess potential future price action. Possible formation of a higher low presents a strong potential setup for a breakout in 2025. Patience and careful monitoring of price action around key levels will be key as we enter the new year

1INCHUSDT 1W1INCH Update ~ 1W
#1INCH Still in a bullish trend. and successfully retested this support line,. For now the price is moving within the Golden ratio. Buy in stages here with a minimum target of 20%+

Is #1INCH Ready For a Major Move or Not? Key Levels to Watch Yello, Paradisers! Is a decisive breakout brewing for #1INCH, or are we in for more sideways action? Let’s dive into the latest analysis of #1INCHNetwork:
💎After an extended period of consolidation, #1INCHUSDT is forming a clear Falling Wedge pattern, a structure often hinting at a potential bullish reversal. The price is currently trapped between Descending Resistance and Descending Support, coiling tighter with each move. The question is—will the bulls finally step up to break free?
💎To ignite a rally, #1INCHUSD must break above the $0.5049 resistance level, which has been a major obstacle. A decisive breakout here, backed by strong trading volume, could propel the price toward the next significant target in the $0.65-$0.70 resistance zone. Keep an eye out for momentum indicators like RSI and a volume spike to confirm this breakout.
💎On the flip side, the $0,38 support zone is critical where buyers have consistently stepped in. If the price closes below this level on the daily timeframe, the bulls will likely catch their next opportunity at the $0.312 strong demand level.
💎The true risk emerges if the $0.312 demand fails. A breakdown here would likely hand control back to the bears, leading to a deeper correction and squashing hopes for a short-term bullish recovery.
Stay focused, patient, and disciplined, Paradisers🥂
MyCryptoParadise
iFeel the success🌴
