1INCH 🦄 Ichimoku Weekly Breakout! | Profits PlanHey guys!
Analyzing past movements, we can see price used to move inside a downwards channel until it broke out from it. But not only that, it broke out and pierced through the Ichimoku Cloud in the weekly timeframe which is huge!
So here's some plan:
1) Condition: -price must breakout from 0.58 towards the upside. After that, it should re-test the zone to give a chance to get into a trade. (DONE)
2) We can set targets 0.90 - 1 dollar mark
3) If price closes above 1.10 we can expect a move towards the following target zone: 1.60 - 1.90
4) For the bears scenario (we must include it even if we feel might not happen at all) Price could fall back into the range and give an awesome opportunity to buy lower even. And a realistic price would be around 0.27 but BEST optimal would be at around 0.20
Let's see how it plays out!
Kina Tip of the Day : My ideas and trades are all for SPOT modality. I don't recommend futures trading unless you really know what you're doing and you're up to get glued into the charts. If you want to live your life and still make money then relax, sit back, analyze and create your own strategy that could be based from another teacher but you must feel connected to it otherwise it won't work in the long run, no matter what you do. So, never give up and keep fighting for independence.
Keep it Shiny! ✨
Kina, The Girly Trader
1INCHUSDT.P trade ideas

Despite Bullish Trade Signal — Why 1INCH Might Go Lower!Just a couple of minutes ago, 1INCH flashed a bullish Bollinger Bands signal on the 4H chart. However, despite the signal's solid reliability when it comes to smaller gains, 1INCH looks poised for a stronger downtrend.
Here's why 👇
1 — 1INCH chart looks extremely bearish with two tops at 0.43 that were rejected both. Especially the M-shape is a formation you don't want to see and indicates a bearish momentum.
2 — 1INCH fell below the important support at 0.4. Also, it recovered gradually, but the token hasn't been able to climb back above the crucial level.
What's next?
A daily close below the 0.4 level will strengthen the bearish momentum. Without support from the broader market, it is more than likely that 1INCH will revisit support at 0.38 next.

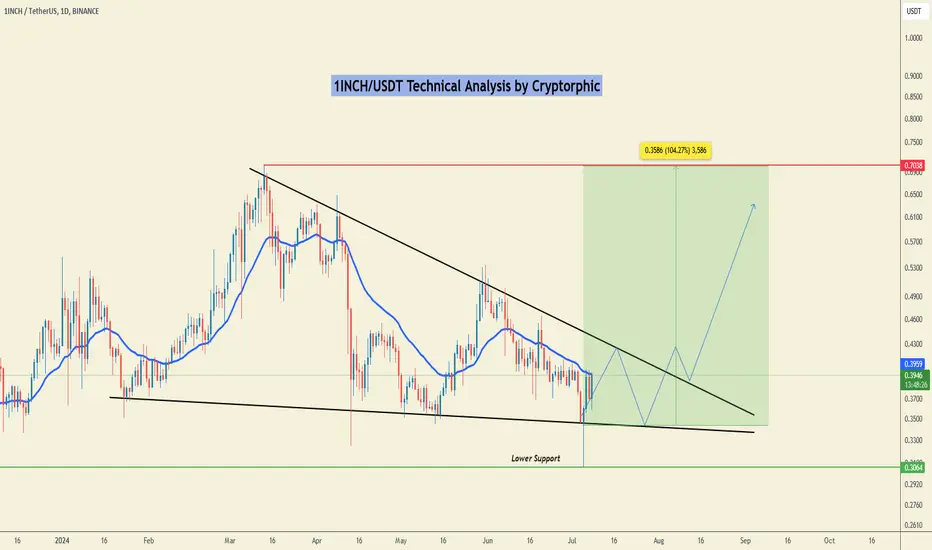
1INCH Technical Analysis in Daily TimeframeHello everyone, I’m Cryptorphic.
For the past seven years, I’ve been sharing insightful charts and analysis.
Follow me for:
~ Unbiased analyses on trending altcoins.
~ Identifying altcoins with 10x-50x potential.
~ Futures trade setups.
~ Daily updates on Bitcoin and Ethereum.
~ High time frame (HTF) market bottom and top calls.
~ Short-term market movements.
~ Charts supported by critical fundamentals.
Now, let’s dive into this chart analysis:
1INCH has been in a bearish trend and recently hit a local low of $0.3064, managing to bounce back and close under the triangle support.
The price is currently testing the 25 EMA resistance and is likely to test the resistance trendline soon. A breakout and close above the resistance trendline will likely create a bullish scenario for 1INCH.
Key Observations:
~ Primary Support: $0.345.
~ Lower support: $0.3064.
~ Primary Resistance: $0.4.
~ Invalidation Point: Breakdown and close below the support levels.
DYOR, NFA.
Please hit the like button to support my content and share your thoughts in the comment section. Feel free to request any chart analysis you’d like to see!
Thank you!
#PEACE
New awesome tokenomi with gaming and farming. Marketing is in plNew awesome tokenomi with gaming and farming. Marketing is in plan
Sanshu studio will release products soon

1INCH — Trade Signal Indicates Quick Gains On The 4H ChartThe crypto market is mainly moving sideways. Accordingly, it is reasonable to pursue trades with a lower profit potential.
1INCH is an exciting opportunity to realize 2.5% gains.
1️⃣ Bullish Trade Signal Flashed
1INCH flashed a bullish MACD crossover on the 4H chart. The signal has high reliability to realize gains of 2% and, therefore, perfectly aligns with the calculated profit potential of 2.5%
2️⃣ Chart Support Bullish Movement
1INCH bounced once again at its 0.39 support level, and we can expect a move toward the resistance at 0.408
3️⃣ Trade Setup
A tight stop loss is mandatory since the profit potential is relatively low. Therefore, a stop loss of 0.8% might be wise. That results in a risk/reward ratio of ~3.
#1INCH/USDT #TradeSignal


1INCHUSDT 1W1INCH ~ 1W
#1INCH Forms H&S Pattern at time 1W
This is H&S Bull. Buy in increments from here with a short term target of at least 20%+.

$1INCH - Looking for bounce1INCH looks like will form a rissing channel.
I am try looking for bounce from gray zone for long position with invalidation if price below $0.344
We have a Head And Shoulder here if confirmed break below the gray zone and touched below $0.344

High potential support zone and a large triangle patternThe price of 1INCH is oscillating within a large triangle pattern. Given the candle formation and the support in this range, we expect the price to test the triangle's upper boundary again.

1inch/USDTAt this stage, it is clear that the instrument is showing itself well, good liquidity, potential for growth
Buy - 0,415$
TP- 0,6 $
TP2 - 0,85 $
TP3 - 1,25$


1INCH ANALYSIS🔮 #1INCH Analysis 💰💰
🌟🚀 #1INCH is trading in a Symmetrical Triangle Pattern. The price is currently trading below its descending trendline and a good bullish moment will be confirmed after a breakout. 🚀🚀
🔖 Current Price: $0.4280
⏳ Target Price: $0.7100
#1INCH #Cryptocurrency #DYOR

1INCHUSDT | More Correction Over the Weekend?Market Context
Sell pressure in the crypto market is still relentless, and I anticipate more downward action before the eventual pump. This weekend could be pivotal.
Chart Analysis
1INCHUSDT is presenting a fascinating opportunity with a great risk-reward ratio. The current setup suggests that we could see a further correction before the bulls take over.
Strategy
The market is ripe for a test of this theory. With selling pressure still strong, I’m gearing up to short 1INCHUSDT. If the market behaves as expected, this could be a rewarding trade.
Action Plan
Let's test this theory and see if we can capitalize on the expected downturn. Stay tuned for updates—this weekend could be very interesting!

This 1inchusdt chart analysis So hello everyone here I predict this token and I told about trend condition so trend condition behave I created a some level where which we can find some reversal pattern so I I told already this is a my prediction so so this is very risky market so please taken a trade on your risk

1inch Analysis: The downtrend is about to end1inch has dropped more than 90% from its previous ATH and is about to hit an important support level at $0.22. I have a target of $7.80 in mind for 1inch if we experience a bull market in the coming months.

1INCHUSD 1W1INCH ~ 1W
#1INCH Forming a HnS Pattern on a 1W Time Frame.
Make purchases gradually within this pattern, with a target of at least 20%+

1INCHUSDT1. 1inch selling plan
2. I think projects like this and Uni will benefit from ETH ETF money flows.
3. Selling at key weekly supply zones and more aggressively as trend progresses.

1inchusdt 1inch is Forming a double bottom pattren on hourly chart there is strong possibility to break the upper trendline so keep an eye on.

1INCH price shows promise for a potential rallyThe 1INCH ( CRYPTOCAP:1INCH ) price is likely to face a pullback after rallying 15% since Tuesday, but a price decline towards $0.471-$0.443 could provide an opportunity for sidelined buyers. The price rally is fueled by rising Open Interest, which indicates the total number of outstanding derivative contracts and whether money flows into the contract are increasing or decreasing.
The 1INCH price broke the resistance level at $0.443 on Tuesday and has rallied 17% since then. If the price bounces off the $0.471 level, it could rally 20% to the 61.8% Fibonacci retracement level (plotted from the March 13 high of 0.704 to the April 13 low of 0.327) at $0.560.
Santiment's Supply on Exchanges index shows 1INCH tokens available on centralized platforms plummeted from roughly $117 million to $94 million from May 28 to 30. This 19% drop in tokens held on exchanges indicates that investors are confident in 1INCH price performance and are not looking to sell.
If the daily candlestick closes below the weekly support at $0.327, 1INCH price will form a lower low in the higher time frame, indicating a bearish market structure. Thus, the bullish thesis would be invalidated, triggering a potential crash to $0.275, roughly 16% away from $0.327.

1inch is setting up for upto 14% pumpHi dear friends, hope you are well and welcome to the new trade setup of 1inch token with US Dollar pair.
Recently we caught almost 44% pump of 1INCH as below:
Now on a 4-hr time frame, 1inch is about to complete a bullish Shark move for the next pump.
Note: Above idea is for educational purpose only. It is advised to diversify and strictly follow the stop loss, and don't get stuck with trade.

1INCHUSDT 1D#1INCH is moving inside a symmetrical triangle on the daily chart. Buy it on its support levels. We expect a new bullish wave soon. Targets are:
$0.5144
$0.5591
$0.6227
$0.7038
Supports are:
$0.4472
$0.4144

10x move on 1INCH.1INCH is getting alive and big amount of volume is coming in. H&S spotted in 1D, 1W TF and there is no sign to go down. 2-5 area is very crucial. Spot and futures both trading looking good and will be taking profits at those green lines.

#1INCH/USDT#1INCH
The price is moving within a 4-hour downtrend channel that it is closely committed to, and has just broken through
We have a support area at 0.3400 and we bounced from it at the lower border of the channel
We have a tendency to stabilize above the Moving Average 100
We have an uptrend on the RSI indicator and it has been broken higher
Entry price is 0.3860
The first target is 0.4658
The second target is 0.5160
The third goal is 0.5760
