1INCHUSDT - fear zone, return to the channel, growth potential1inch - is a decentralized exchange (DEX) aggregator that combines multiple DEXs into a single platform, aiming to provide users with the most efficient routes for swaps across all platforms.
📍 CoinMarketCap : #160
📍 Twitter(X) : 1.3M
The coin has already been listed on exchanges during the distribution phase of the cycle and was partially sold off in waves. Then, in line with the overall market, it declined to more reasonable accumulation prices, shaking out small investors and those who entered positions on positive news.
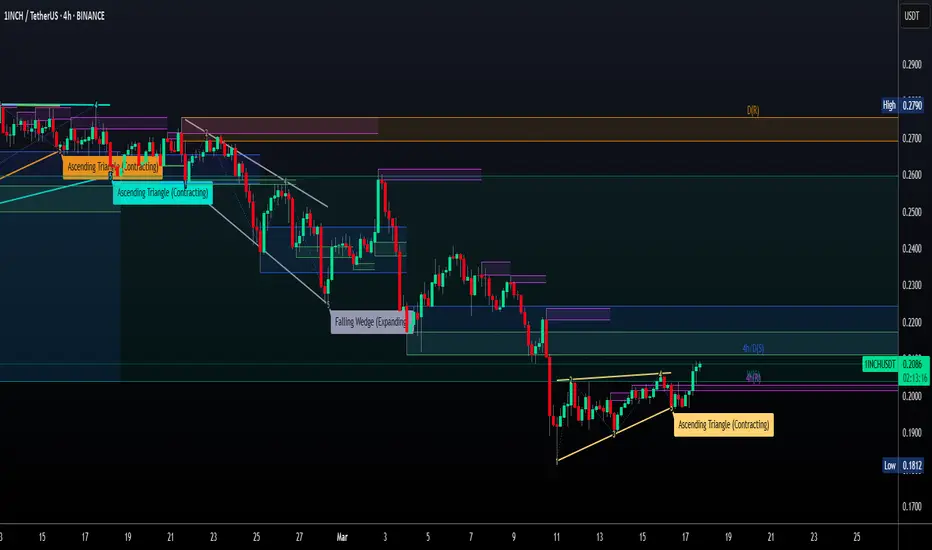
The price has been moving within a horizontal channel for a couple of years, and the channel’s percentage range reflects the coin’s liquidity. Currently, the coin is in a fear zone, at its lowest price levels. In moments like this, very few people have funds left to accumulate positions, as they’ve already been trapped by optimistic bloggers and a positive news background earlier.
Many were wiped out recently due to a breakdown and consolidation below the previous support of the inner channel, and now there's emptiness and fear below. What’s happening now is an attempt to return back into the inner channel. If this zone holds, the channel targets may be realized.
Resistance zones where the price may react are marked on the chart. Potential final downside wicks are also indicated. It’s important to allocate funds wisely for position building and use proper percentage distribution, according to your own experience!
______
📌 Not financial advice. Observing structure and recurring phases.
Operate within your strategy and with an awareness of risks.
1INCHUSDT trade ideas

1INCHUSDT Forming Falling Wedge1INCHUSDT is setting up for what could be a significant bullish reversal as it breaks out from a classic falling wedge pattern. This well-known technical setup typically signals a trend reversal with a strong probability of a sharp upside move once resistance is breached. Over recent sessions, 1INCH has demonstrated strong buying interest with an uptick in volume, indicating that investors and traders alike are beginning to take positions ahead of a possible rally.
The increase in trading volume is an encouraging sign that accumulation is underway. This means that both institutional players and retail investors see value at these levels and are positioning themselves for a potential 60% to 70% gain in the coming weeks. With key resistance levels getting cleared and the falling wedge breakout confirmed, momentum could build quickly, driving price action toward higher targets.
Sentiment surrounding 1INCH is also benefiting from its strong fundamentals as a leading decentralized exchange aggregator. The project’s ability to find the best token swap rates across multiple DEXs has kept it relevant in the DeFi space, attracting new users and liquidity. Combined with improving on-chain metrics and renewed interest in the DeFi sector as a whole, the setup looks increasingly favorable for bulls.
✅ Show your support by hitting the like button and
✅ Leaving a comment below! (What is You opinion about this Coin)
Your feedback and engagement keep me inspired to share more insightful market analysis with you!

2021 Resistance Broken: 1INCH Eyes Major Bullish PotentialThe 1INCH/USDT monthly chart provides a compelling glimpse into the long-term price action and potential future trajectory of the cryptocurrency. The chart captures key market dynamics, highlighting a prolonged downtrend and a recent breakout that could signal the beginning of a new bullish cycle.
The overall context suggests that 1INCH has experienced a significant long-term downtrend, marked by a descending white trendline originating from its peak price of 7.3345. This trendline underscores consistent selling pressure and a bearish market sentiment that persisted for an extended period. However, the broader picture also reflects the cyclical nature of markets, with an initial strong rally in early 2021, followed by a protracted consolidation phase, and now the possible emergence of a fresh upward trend.
A pivotal development is the recent breakout above the downward-sloping trendline. Such a breakout often indicates a shift in market momentum from bearish to bullish, signaling that the downward pressure may be easing. This breakout is further underscored by annotations on the chart suggesting that the price is “ready for re-test.” This refers to the likelihood of the price pulling back towards the broken trendline to confirm it as a new level of support before continuing its upward trajectory. Retests are a natural and critical component of breakout scenarios, offering traders an opportunity to validate the strength of the breakout.
The chart also highlights a projected target price of 7.9266, indicated by a green rectangle. This ambitious target represents a substantial increase from the current price of 0.4005, suggesting the potential for a significant rally if the bullish momentum holds. Additionally, key support levels are identified at 0.3286, 0.2600, and 0.2304, providing important reference points for risk management and trade planning.
From a trading perspective, the breakout sets the stage for a bullish outlook, with the re-test offering a potential entry point. Traders might wait for the price to dip towards the broken trendline or one of the identified support levels and observe whether these levels hold as support. Confirmation of support can come in various forms, such as the formation of a higher low or a strong green candle signaling buyer strength.
However, trading based on this analysis should include proper risk management. Setting a stop-loss near critical support levels can help mitigate potential losses if the breakout fails or market conditions reverse unexpectedly. Furthermore, traders should remain aware of the high volatility inherent in cryptocurrency markets and adjust their strategies accordingly.
It’s also essential to acknowledge that this analysis is based on a monthly timeframe, which means the trends and price movements are likely to unfold over an extended period, spanning weeks or months. While the technical setup appears promising, it’s important to incorporate fundamental factors such as news, project developments, and broader market sentiment to gain a more comprehensive view.
In conclusion, the 1INCH/USDT monthly chart reveals a promising bullish scenario with the potential for significant upside, provided the breakout holds and the market aligns with the technical projections. Observing the re-test and confirming the newly established support levels will be key steps in navigating this potential rally.
Disclaimer: This is not a financial advise. This analysis is purely for informational purposes and should not be considered as investment advice. Trading involves risk, and you should consult with a financial professional before making any decisions.

1INCH ANALYSIS🔮 #1INCH Analysis 🚀🚀
💲💲 #1INCH was trading in a Descending Broadening Wedge Pattern, give a perfect breakout and will retests the levels. If the price of #1INCH sustains the breakout then we will see a bullish move. 📈📈
💸Current Price -- $0.2220
📈Target Price -- $0.2510
⁉️ What to do?
- We have marked crucial levels in the chart . We can trade according to the chart and make some profits. 🚀💸
🏷Remember, the crypto market is dynamic in nature and changes rapidly, so always use stop loss and take proper knowledge before investments.
#1INCH #Cryptocurrency #Breakout #DYOR

You have even an inch or 1Inch?AYYY nooo your mind is bad, Not after u read this, Looks perfect for an upmove altogether!! What say?

1INCHUSDT Forming Bullish Wave1INCHUSDT is showing signs of a promising bullish wave pattern that could deliver solid gains for traders who position themselves early. The 1INCH token, which powers the popular decentralized exchange aggregator 1inch Network, has seen a consistent uptick in trading activity and on-chain volume recently. This uptick in volume indicates that investors and whales are quietly accumulating positions, setting the stage for a possible breakout move. If this momentum continues, the price action could produce an impressive 60% to 70% upside from current levels.
The project’s fundamentals remain strong as the 1inch Network continues to expand its reach in the DeFi space, offering some of the best rates and routing for decentralized trades. This network effect, combined with increased protocol usage, provides additional fuel for a sustained uptrend. The bullish wave pattern developing on the chart suggests that the price could test key resistance levels soon, and a breakout above these levels may trigger a strong upward rally supported by healthy liquidity.
Technically, 1INCHUSDT has formed a clear accumulation zone with higher lows indicating growing buyer confidence. As traders look for altcoins with solid use cases and liquidity, 1INCH is positioning itself as a standout candidate. The alignment of strong technicals with a robust DeFi narrative makes this pair one to watch closely in the coming weeks. Smart investors will be paying attention to volume spikes and breakout confirmations to catch the wave early.
✅ Show your support by hitting the like button and
✅ Leaving a comment below! (What is You opinion about this Coin)
Your feedback and engagement keep me inspired to share more insightful market analysis with you!

TradeCityPro | 1INCH Tests Supply Zone After Strong Bounce👋 Welcome to TradeCity Pro!
In this analysis, I want to review the 1INCH coin for you. It’s one of the DeFi coins, with a market cap of $256 million, ranked 162 on CoinMarketCap.
⏳ 4-Hour Timeframe
As you can see in the 4-hour timeframe, this coin is sitting on a support floor at the 0.1668 zone and has formed a range box at this bottom.
🔔 There’s a key supply zone at the top of this range box, which I’ve marked as a range for you, and currently, the price is inside this zone.
📊 Given the significant buying volume that has entered this coin, the price has penetrated into this range and is testing it for the several-th time.
✨ If this range is broken, we can confirm the bullish reversal of this coin and open a long position. Volume has already given us confirmation, and if RSI enters the Overbuy area, that will be our momentum confirmation.
🔼 The next resistance levels for this coin—which we can consider as targets—are 0.2031 and 0.2207.
✔️ If the price gets rejected from this zone, it may move back down toward the 0.1668 floor. For a short position, we can enter if 0.1668 is broken.
📉 However, if we get confirmation of rejection from the zone, we can look for an early entry trigger in the lower timeframes.
📝 Final Thoughts
This analysis reflects our opinions and is not financial advice.
Share your thoughts in the comments, and don’t forget to share this analysis with your friends! ❤️

Long position for 1INCHUSDT in 4H 2.74 RRLong Position for 1INCHUSDT in 4H with a 2.74 RR
Long 0.1748
TP 0.1904
SL 0.1691

1INCH 1D. Showing Signs of Accumulation. 06/12/25BINANCE:1INCHUSDT There's growing media and social media attention around the 1INCH project, which could be a bullish sentiment trigger.
Currently, the price is trading within a descending channel and has recently bounced from the lower boundary, signaling a potential long entry or spot accumulation opportunity.
From current levels, I expect a clean 2x upside on spot. Personally, I think it's worth starting to scale in carefully on spot or futures.
However, keep in mind — even after a bounce, price could still dip slightly lower before any meaningful move up. A deeper correction remains a possibility, so always factor in risk.
📌 Key Takeaways:
• Long bias from current levels
• Potential 2x on spot
• Further dip possible — manage risk accordingly
DYOR. Stay sharp.

1inch🔍 1INCHUSDT Analysis – 1H Timeframe
After a sharp drop, 1INCH is now retracing toward the 0.5 – 0.618 Fibonacci zone (0.208–0.211) which aligns with a clear supply area (🔵 shaded region). Price is approaching this zone after bouncing off the 0.193 low.
🧱 This area could act as a strong resistance unless broken with momentum. Failure to break may result in a continuation to the downside 📉, potentially revisiting the 0.20 or even the 0.193 zone.
📌 Key levels:
Resistance: 0.208–0.211
Support: 0.200 → 0.193
Breakout confirmation: Clean close above 0.211 on volume

1INCHUSDT 1D Analysis 1INCH ~ 1D Analysis
#1INCH Buy gradually within this pattern with a short-term target of at least 10%++ and a long-term target of $0.63+

1INCH Inverse Head & Shoulders (1H)BINANCE:1INCHUSDT completed an Inverse Head & Shoulders pattern, clearly visible on the hourly timeframe.
Key Levels
• Left Shoulder: $0.223
• Head: $0.218
• Right Shoulder: $0.223
• Neckline: $0.232
• Measured Target: $0.245 (aligned with local high)
Status
Breakout has already occurred, activating the target.
Next Steps
It may be too late to chase, but a retest of the neckline as support (~$0.232) could offer a compelling long entry.
Invalidation Levels
• Early Invalidation: Break below $0.232
• Full Invalidation: Break below the right shoulder at $0.223

1INCHUSDT 2D Analysis 1INCH ~ 2D Analysis
#1INCH Buy on retest of this support block with short term target of at least 15%+ from here.

1INCHUSDT 1D#1INCH has broken the descending broadening wedge pattern to the upside on the daily chart. Buy it here and near its support. Targets are:
🎯 $0.2941
🎯 $0.3389
🎯 $0.3837
🎯 $0.4475
🎯 $0.5287
⚠️ Use a tight stop-loss.

1INCH USDT Bull Pennant, BULLISHBINANCE:1INCHUSDT
1INCH USDT Bull Pennant, BULLISH
TARGETS are fib levels as shown in the chart

1INCH Update – Bullish Inverted H&S!🚨 CRYPTOCAP:1INCH Update – Bullish Inverted H&S! 🚀
👀 CRYPTOCAP:1INCH has formed bullish inverted head and shoulder patterns. Watch for breakout red resistance zone.
🔑 We are waiting for a breakout above the red resistance zone to confirm the bullish inverted head and shoulders pattern.
Keep a close eye on $1INCH!

1INCH Rectangle Downside BreakoutLast week, BINANCE:1INCHUSDT fully confirmed a downside breakout from a multi-year rectangle.
If $0.20 isn't reclaimed soon, there is a good chance that the token will head to the $0.06 rectangle target.
Worth watching it, as a failed retest of $0.20 could offer a very good short opportunity, while a sustained daily close above it would invalidate the setup and possibly lead to a retest of $0.45 or even $0.70.

1INCH/USDT: A Potential Bullish ReversalThe daily price action of the 1INCH/USDT trading pair, revealing a downward trend within a descending channel. Recently, the price has moved above the channel's lower boundary and is testing a critical resistance zone, suggesting a potential reversal.
A strong demand zone has previously halted declines, and bullish momentum here may indicate a trend shift.
Targets at $0.2550, $0.3089, and $0.3542, with a final target around $0.5167, implying a potential 125% increase if bullish momentum persists.
Overall, the breakout from the descending channel and firm support levels indicate a bullish outlook, though monitoring volume and market sentiment is essential to confirm the uptrend's strength.

1INCHUSDT Hello everyone. I share idea about the trend. So market is very risky. Take responsibility self

1INCHUSDT: The Invisible Forces Driving Price Right Now - 1inch◳◱ Ever seen the Bollinger Band Breakout Super Trend on a chart? It's exciting to watch! With the price hovering around 0.2093, there's potential for a breakout above 0.2203 | 0.2433 | 0.2859. Support at 0.1777 | 0.1581 | 0.1155 provides confidence for bulls.
◰◲ General Information :
▣ Name: 1inch
▣ Rank: 199
▣ Exchanges: Binance, Kucoin, Huobipro, Gateio, Mexc, Hitbtc
▣ Category / Sector: Financial - Decentralized Exchanges
▣ Overview: The 1inch Network unites three separate decentralized protocols, aggregating liquidity from a variety of decentralized exchanges to facilitate cost-efficient transactions.
Its native token, the 1inch token (1INCH) serves two primary purposes: As a governance token granting voting rights towards the 1inch DAO and as a utility token, where it is used as a connector to achieve high-efficiency routing in the 1inch Liquidity Protocol. It will also be used in the tokenomics of all future protocols developed by the 1inch Network.
◰◲ Technical Metrics :
▣ Current Price: 0.2093 ₮
▣ 24H Volume: 3,767,156.011 ₮
▣ 24H Change: 3.358%
▣ Weekly Change: 4.06%%
▣ Monthly Change: -21.88%%
▣ Quarterly Change: -56.72%%
◲◰ Pivot Points :
▣ Resistance Level: 0.2203 | 0.2433 | 0.2859
▣ Support Level: 0.1777 | 0.1581 | 0.1155
◱◳ Indicator Recommendations :
▣ Oscillators: NEUTRAL
▣ Moving Averages: BUY
◰◲ Summary of Technical Indicators : BUY
◲◰ Sharpe Ratios :
▣ Last 30 Days: -3.94
▣ Last 90 Days: -4.16
▣ Last Year: -0.69
▣ Last 3 Years: -0.39
◲◰ Volatility Analysis :
▣ Last 30 Days: 0.79
▣ Last 90 Days: 0.78
▣ Last Year: 0.93
▣ Last 3 Years: 0.87
◳◰ Market Sentiment :
▣ News Sentiment: N/A
▣ Twitter Sentiment: 0.53 - Bullish
▣ Reddit Sentiment: 0.60 - Bullish
▣ In-depth BINANCE:1INCHUSDT analysis available at TradingView TA Page
▣ Your thoughts matter! What do you think of this analysis? Share your insights in the comments below. Your like, follow, and support are greatly valued and help sustain high-quality content.
◲ Disclaimer : Disclaimer
The content provided is for informational purposes only and does not constitute financial, investment, or trading advice. Always conduct your own research and consult a qualified professional before making any financial decisions. Use of the information is solely at your own risk.
▣ Explore the Power of Charting with TradingView
Unlock a wide range of financial analysis tools, data, and features to elevate your trading experience. Take a tour and see the possibilities. If you decide to upgrade your plan, you can receive up to $30 back. Discover more here - affiliate link -
1inch it's time to bounce1d great support.
1d divergence.
correction from december, already 3 months, 85 days..

Univers Of Signals| INCH: Delving into a Leading DEX ProjectIn this analysis, I want to review the INCH coin for you. It's one of the DEX projects in crypto, active in the DeFi space, and considered one of the successful projects in this category.
📅 Weekly Timeframe
As you can see in the weekly timeframe, after its launch, the price began a downward trend and is currently in a consolidation box between $0.2098 and $0.6270.
⚡️ The bottom of this box is a very important support, arguably the only and last support for this coin. Conversely, the top of this box, as you can see, is a very strong supply zone. The price has approached this area several times with high momentum, but it has been rejected each time and returned to the bottom of the box.
🔍 Currently, as you observe, the price, after being rejected from this level, has moved downward and reached the bottom of the box, where it has been ranging for about three weeks. If this bottom breaks, the price could move lower and set a new all-time low (ATL), which would worsen the project's situation.
📈 However, if the price can rise from this area, finally moving upwards and breaking the supply zone, it could successfully start its bullish trend after several years.
🚀 The targets for the bullish trend are initially at $0.8438 and then at $2.0175. The ATH area is at $7.1331, which seems far from the current price and out of reach unless the market cap of 1inch significantly increases.
📅 Daily Timeframe
In the daily timeframe, as we observe, we can see more details about the last downward movement. As you see, after entering the correction phase, the price first corrected to $0.3638. However, after stabilizing below this area, the next downward leg started, and currently, the price has reached $0.25 and has formed a small box between $0.25 and $0.2756.
🔽 For short positions, we have a very suitable trigger at $0.25, where if this area breaks, the price could move down to its main support at $0.2226.
✅ On the other hand, if this box that the price has formed breaks upwards and the price can stabilize above $0.2756, forming a higher low and higher high, we could say it has risen from the bottom of the box and could move higher.
💥 Overall, the price is in a very large weekly box, and any spot purchases and positions taken within this box are highly risky. So, be sure to not engage in excessive risk with this coin and wait until the large weekly box is broken either upwards or downwards.
📝 Final Thoughts
This analysis reflects our opinions and is not financial advice.
Share your thoughts in the comments, and don’t forget to share this analysis with your friends! ❤️ .

TradeCityPro | INCH: Delving into a Leading DEX Project👋 Welcome to TradeCityPro!
In this analysis, I want to review the INCH coin for you. It's one of the DEX projects in crypto, active in the DeFi space, and considered one of the successful projects in this category.
📅 Weekly Timeframe
As you can see in the weekly timeframe, after its launch, the price began a downward trend and is currently in a consolidation box between $0.2098 and $0.6270.
⚡️ The bottom of this box is a very important support, arguably the only and last support for this coin. Conversely, the top of this box, as you can see, is a very strong supply zone. The price has approached this area several times with high momentum, but it has been rejected each time and returned to the bottom of the box.
🔍 Currently, as you observe, the price, after being rejected from this level, has moved downward and reached the bottom of the box, where it has been ranging for about three weeks. If this bottom breaks, the price could move lower and set a new all-time low (ATL), which would worsen the project's situation.
📈 However, if the price can rise from this area, finally moving upwards and breaking the supply zone, it could successfully start its bullish trend after several years.
🚀 The targets for the bullish trend are initially at $0.8438 and then at $2.0175. The ATH area is at $7.1331, which seems far from the current price and out of reach unless the market cap of 1inch significantly increases.
📅 Daily Timeframe
In the daily timeframe, as we observe, we can see more details about the last downward movement. As you see, after entering the correction phase, the price first corrected to $0.3638. However, after stabilizing below this area, the next downward leg started, and currently, the price has reached $0.25 and has formed a small box between $0.25 and $0.2756.
🔽 For short positions, we have a very suitable trigger at $0.25, where if this area breaks, the price could move down to its main support at $0.2226.
✅ On the other hand, if this box that the price has formed breaks upwards and the price can stabilize above $0.2756, forming a higher low and higher high, we could say it has risen from the bottom of the box and could move higher.
💥 Overall, the price is in a very large weekly box, and any spot purchases and positions taken within this box are highly risky. So, be sure to not engage in excessive risk with this coin and wait until the large weekly box is broken either upwards or downwards.
📝 Final Thoughts
This analysis reflects our opinions and is not financial advice.
Share your thoughts in the comments, and don’t forget to share this analysis with your friends! ❤️
