Trade call for 1INCH1INCH is currently at strong support level.
For risk tolerant traders: Buy between $2-$2.4 with stoploss of $1.6 and target price of $3.5-$4.
For risk averse traders: Buy after a 4h candle closes above $3 for the tp mentioned above.
Do not invest more than 20% of your portfolio.
1INCHUSDT trade ideas

Long on 1INCHUSDTTaking long position at the support line for the retracement movement. Target and stop loss are on chart. RR is comfortable for this trade.
Not financial advice.

Buying 1INCH Here.Buying 1Inch here, seems to be holding up while BTC is getting low time frame ranged like crazy. Holding for a swing. I think they are doing some crypto gaming things not sure lol. Not advise.

1INCHTrend is your friend...
Tight SL - 10.36%
TP are marked... for me is 67% a lot of money. But if you wanna wait, probably you can see higher price...
RRR is 6,49 ...
If BTC will drop again the price can hit SL. If we drop under green support, it will be cruel time... You can restart the trade at the bottom (green range) and take profits on the way up.
...still in entry zone.


It’s The Nice Buy OpportunityThe Price About To Breakout The Trend Line ,The Short Term Target Is 7$ ,1inch Will Surprise Many People Soon

Elliott wave count in 1INCH symbol in daily timeframe#1INCHUSDT
You see the 1INCH symbol wave count. According to the wave count, you can see that this symbol is in its second cycle. In the second cycle, wave 1 is completed and wave 2 is being completed.
Approximately three out of four waves 2 correct between 38 and 62% of wave 1, and at most one in six waves 2 corrects more than 62% of wave 1. 1INCH is of the second category. But I'm hesitant about completing wave 2 correction and the occurrence of point C, so I tagged it with a question mark.
Personally, I believe this symbol will have a deeper correction than point c, and then we will wait for the beginning of the third wave. To get confirmation of this issue, we can wait for a positive divergence of the ordinary type. I have given you an example of this divergence at the beginning of wave one.
By closing the candlesticks on the horizontal blue lines, the best opportunity to enter this symbol will be created. This analysis is Not a buy signal.
I am waiting for friends and professors to comment.
Thank you

1 inch BULLISHdouble Bottom, it has retested on BB20 that indicates strong trend. It also retested on golden ratio

1INCHUSDT - Double Bottom1INCHUSDT (1h Chart) Technical analysis
1INCHUSDT (1h Chart) Currently trading at $2.53
Buy level: Above $2.55 (Buy after breakout)
Stop loss: Below $2.33
TP1: $2.63
TP2: $2.72
TP3: $2.82
TP4: $2.95
Max Leverage 3x
Always keep Stop loss
Follow Our Tradingview Account for More Technical Analysis Updates, | Like, Share and Comment Your thoughts.

1InchUsdt1Inch good coin for save and good for tade after this dump come bottom and fear on market
my exprience is when market on fear you buy this is realy not financial advice . can BTC more dump and ATH this Cycle 69K and now finish we going to correction adn more dump this remember but this coin is good you have buy can buy this
1Inch good Decenteralize Exchnage and have good apce for growUP
this about you and your money
GL
Entrypoint:
2.422
2.365
Suports:
2.228
1.617
1.034
Resistance:
2.940
Targets:
3.624
4.252
5.241
6.815
9.529
For HODL and mid time:
14.575
18.197
25.038
GL
rememebr 1 inch good fundamental.
now on bottom channel adn this channel is correct can see reaction prize on middle and top this channel.


1inch usdt longThe 1inch Network's first protocol is a decentralized exchange (DEX) aggregator solution that searches deals across multiple liquidity sources, offering users better rates than any individual exchange. The 1inch Aggregation Protocol incorporates the Pathfinder algorithm for finding the best paths across over 60+ liquidity sources on Ethereum, 30+ liquidity sources on Binance Smart Chain, 30+ liquidity sources on Polygon, Optimistic Ethereum, and Arbitrum. In just over two years of operation, the 1inch Aggregation Protocol surpassed $80 bln in overall trading volume on the Ethereum network alone.


1inch usdtIt's going in falling wedge pattern soon going to break.
Buy around 2.7
Buy around 3.8
Sell around your wish.
Like, comment follow

$1Inch: $3.5 Coming Soon? Everyone seems to bearish at the moment but I think this is just a much needed correction. Things were moving a bit too fast and needed to cool off a little. Hopefully, now the upward trend will be a little drawn out so it is sustainable. Anyways, 1 inch looks bullish to me as long as it breaks out and hold $2.52.

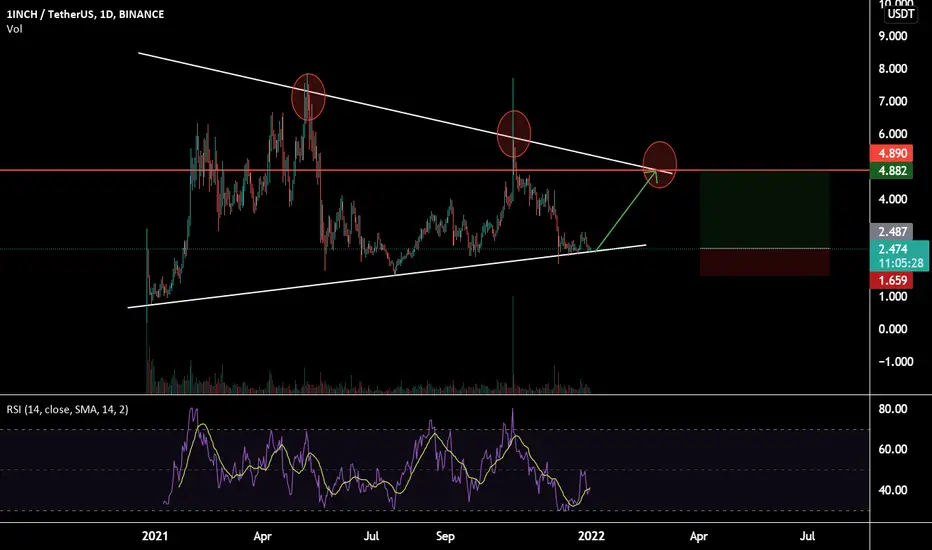
1INCH, price is squeezed into a trading range. What to do?1INCH broke through the global trend line but failed to break out of the trading range. While bitcoin and the entire market are in limbo, two potential scenarios are worth highlighting. The first and most positive scenario is for the price to return to the upper boundary of the trading range, squeeze, and breakout. This would likely signal the start of a new uptrend.
The second scenario is a continuation of the decline and a collection of liquidity below the low.
Write in the comments all your questions and instruments analysis of which you want to see.
Friends, push the like button, write a comment, and share with your mates - that would be the best THANK YOU.
P.S. I personally will open entry if the price will show it according to my strategy.
Always make your analysis before a trade.

1Inch 1inch Coin will move below 2.7 in the next 6 hours
* Time to Buy
* will hit 3.5 Before the 2nd quarter of 2022

1inch 4hr1inch is best for holding long term coin,moves in symmetrical triangle ,200EMA resistance
Buy if 4hr candle close above 2.85
Tp1-3.4
Tp2-3.6
Tp3-4.0
Tp4-4.7
Sl below 2.3
Spot or laverage 3x

1INCH ... a calm and angry horse on the daily time frame; we have pin bar on yesterday and we could enter it
now we can wait for a breakout from the daily trendline and 200 ma 4h timeframe too; to have low-risk trade
and hold it until reaches 0.68 fibo of the last bearish leg .
it can 42% profit .

1INCHUSDT If we break through the descending channel upside at 2.80 level. Then long it.
TP stop-loss shown on chart.
