AAVEBTC trade ideas


AAVE-BTC seems BullishP.S: This is NOT investment advice. This chart is meant for learning purposes only and is a part of my personal journal. Invest your capital at your own risk.

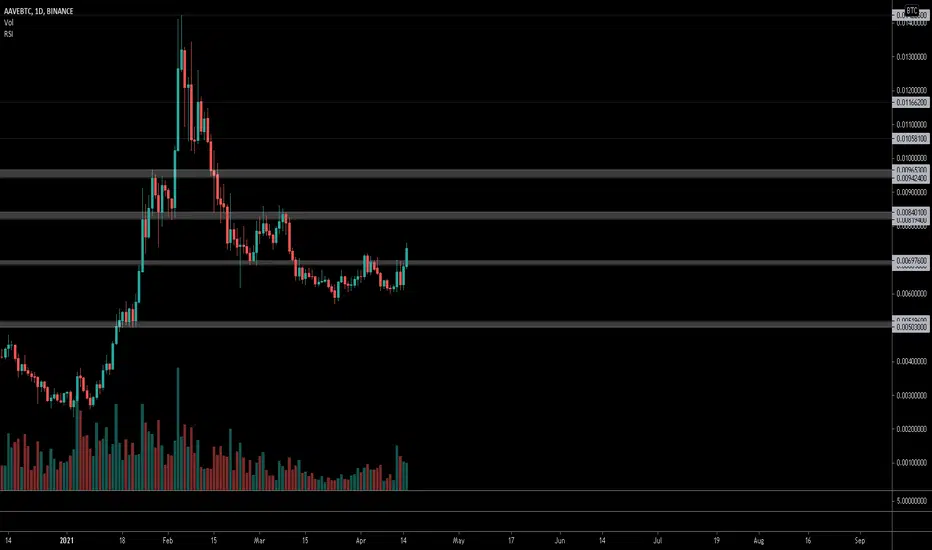
AAVEAAVE also look good. Still might consolidate above 7100 but this may be the beginning of good uptrend since it made HH.

AAVEBTC - Long - Potential 10.24%AAVEBTC - Long - Potential 10.24%
Exchanges: Binance
Signal Type: Regular (Long)
Entry Zone:
0.007858 - 0.008027
Take-Profit Targets:
1) 0.008469
2) 0.008849
Stop Targets:
1) 0.007499
Trailing Configuration:
Entry: Percentage (0.0%)

AAVE BTC LONG position unless we break this current low Hello!
Above I have mapped out some targets based on multiple fib extension/retracements, previous trends, Gann fans and support/resistance lines. Everyone approaches charts differently, this is a rough estimation based on facts I gathered from the trend thus far on a technical basis.
I believe AAVE BTC will be in high demand, therefore it will be completing a small parabola here. AAVE is fundamentally strong. Always watch BTC incase of a sudden crash, as this could greatly affect this token⏫⏬🆗.
🛑🛑🛑🛑This is not financial advice🛑🛑🛑🛑
Always have a stop loss✋🛑💲
Thank you so much..
Any thoughts 💡, questions ❓, good 👍, bad👎, happy 😄 or sad 😥, in the comments greatly appreciated!
Jazerbay 🤍

$AAVE .02 BTC target (>$1000)AAVE has respected fibonacci extension targets well, I'm betting that will continue, next move against BTC will bring $1000 AAVE
***I am long AAVE

aave/btc bullishAave could be setting up for a big move here, on the 8h time frame it has just hit resistance, if it pulls back and makes a higher low and bounces it could trigger a buy signal.

$AAVE, Flashing a 2D Buy signal (needs to close//usually strong)$AAVE
Flashing a 2D Buy signal (needs to close//usually strong), UCTS bullish on lower timeframes already..
Still looking to more interesting volume levels but overall starts to look good..
~80% to YTD highs (~.014 sats)
Aim for flips/retests as potential entry.
#AAVE

$AAVE* Retraced to 0.618 Fib.
* Breaking out from huge falling wedge.
* Bullish StochRSI cross.
* Bullish MACD cross on 4HR.
* 200 EMA is acting as support.
* Bullish 50-100-200 EMA alignment.


Support didn't break Interesting risk ratio and good setup
BTc is entering stagnation for few day alt can pump.

AAVE/BTC - Beatifull daily price actionNo clear indicator tells, but the price structure on this one is clearly reaccumulation on highs to extend the move even further. VS BTC!

AAVE Primed and Ready for 2021The price of AAVE/BTC is currently consolidating in the lower band of a 10 month long parabolic trend. .0061 sats is the current support line and .0073 sats, the previous all time high from the last blow off top in September, is the resistance line. If it doesn't break resistance it'll test the local support line. However, I anticipate it will drop below that local resistance line down to .0049 sats, and possibly even .0040 sats. Fortunetly, that drop would be totally normal, and a healthy correction. Overall, the chart looks like people anticipate huge growth. It had two blow offs top within six months. Once a L2 solution successfully solves the gas fee issue, AAVE will go on an insane run. .015 btc in the summertime would be reasonable, if a L2 solution is successful by June. This is not financial advise. I am not an expert.

AAVEBTC is creating a descending wedge 🦐The price is creating a descending wedge on weekly support. IF the price will have a breakout, According to Plancton's strategy (check our Academy), we can set a nice order
–––––
Follow the Shrimp 🦐
Keep in mind.
🟣 Purple structure -> Monthly structure.
🔴 Red structure -> Weekly structure.
🔵 Blue structure -> Daily structure.
🟡 Yellow structure -> 4h structure.
⚫️ Black structure -> <4h structure.
Here is the Plancton0618 technical analysis, please comment below if you have any question.
The ENTRY in the market will be taken only if the condition of the Plancton0618 strategy will trigger.

Crypto|AAVE/BTC|LongLong AAVE/BTC
Activation of the transaction only when the blue zone is fixed/broken.
The author recommends the use of anchoring fixed the blue zone, this variation is less risky.
If there is increased volatility in the market and the price is held for more than 2-3 minutes behind the activation zone after the breakdown, then the activation of the idea occurs at the prices behind the activation zone.
The idea is to work out the resistance level .
* Possible closing of a trade before reaching the take/stop zone. The author can close the deal for subjective reasons, this does not completely cancel the idea and is not a call to the same action, you can continue working out the idea according to your data, but without the support of the author.
+ Maybe right now we will go even lower, then it's okay, the idea is not activated and simply canceled.
+ ! - zone highlighted by the ellipse is a zone of increased resistance, in this area there is a possible reversal for a correction, please take this factor into account in this transaction.
The "forecast" tool is used for more noticeable display of % (for the place of the usual % scale) of the price change, I do not put the date and time of the transaction, only %.
Blue zones - activation zones.
Green zones - take zones.
The red zone - stop zone.
Working out the stop when the price returns to the level after activation + fixing in the red zone.
Orange arrow - the direction of take.
Black arrow - neutral scenario without activating the trade.
The red arrow - the direction of the stop.
SUM PNL: This parameter displays the total % of all closed ideas of the "new" format (according to the author) for this sector at the time of publication of the idea. The calculation is very "clumsy" just the sum of the profits of all the ideas, based on this indicator, you can more accurately assess the risks when working with my ideas of this sector. I present you the construction of the idea, you can use it yourself as you like based on your subjective view and risks, the calculation of the PNL indicator is carried out only on transactions that the author closed on TV in manual mode or by take.
P.S Please use RM (risk management) and MM (money management) if you decide to use my ideas, there will always be unprofitable ideas, this will definitely happen, the goal of the system is that there will be more profitable ideas at a distance.


Fractal Waves & Fib Extensions on AAVE I saw wave repetition on AAVE previous Elliot Wave Cycle.
Did a fib extension for previous final wave to see the high
And then used same levels for extension on wave 2.
Confirmation of upward momentum with pitchfork.
I'm going long on AAVE.


$AAVE, Trying to cross above ~700k sats (rejected on April 3rd) $AAVE
Trying to cross above ~700k sats (rejected on April 3rd) w/ volume starting to rise
UCTS signalling a 1D Buy (usually strong) needs to close
Looking for a R/S Flip as confirmation, set alerts
#AAVE