💡Don't miss the great buy opportunity in AAVEBTCTrading suggestion:
". There is a possibility of temporary retracement to suggested support line (0.003130).
. if so, traders can set orders based on Price Action and expect to reach short-term targets."
Technical analysis:
. AAVE/BITCOIN is in a range bound and the beginning of uptrend is expected.
. The price is above the 21-Day WEMA which acts as a dynamic support.
. The RSI is at 52.
Take Profits:
TP1= @ 0.004000
TP2= @ 0.004520
TP3= @ 0.004950
TP4= @ 0.005570
TP5= @ 0.006320
TP6= @ 0.007570
SL= Break below S2
❤️ If you find this helpful and want more FREE forecasts in TradingView
. . . . . Please show your support back,
. . . . . . . . Hit the 👍 LIKE button,
. . . . . . . . . . Drop some feedback below in the comment!
❤️ Your Support is very much 🙏 appreciated! ❤️
💎 Want us to help you become a better Forex trader ?
Now, It's your turn !
Be sure to leave a comment let us know how you see this opportunity and forecast.
Trade well, ❤️
ForecastCity English Support Team ❤️
AAVEBTC trade ideas

AAVE/BTC - BuyIf you haven't seen my last post on AAVE go look
This wedge pattern is beautiful and it looks like alt season is beginning.
Thanks

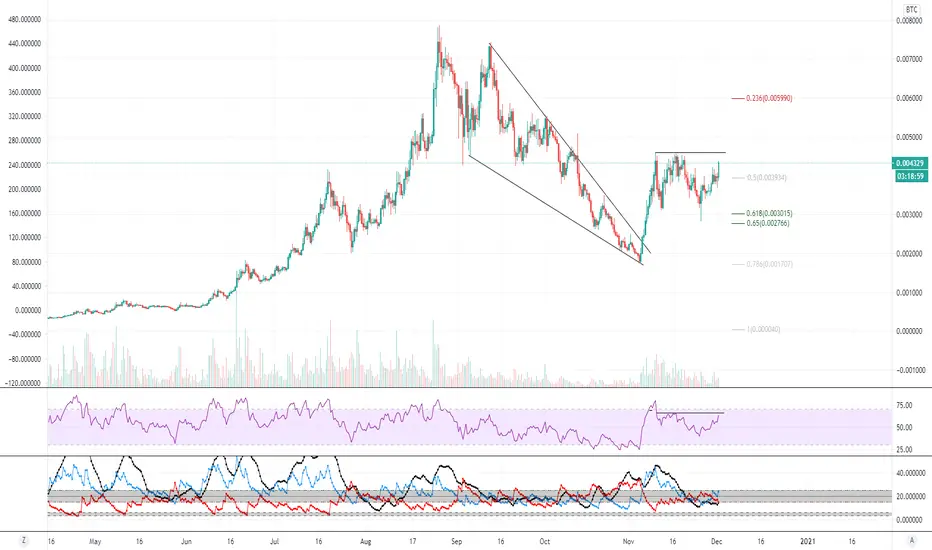
AAVE/BTC - Long Term WedgeThis wedge pattern reminds me a lot of the BTC/USD wedge / symmetrical triangle .
Parabolic advance --> 80% correction --> huge rally --> another correction --> Wedge breakout
Ill probably add to my position once the dust settles.
Thanks

Trending Up vs BTC AAVEAAVE is one of the few cryptos that has been trending up against btc in the last year and a half.
Would like to see area in yellow be regained otherwise looks like we could see a retrace.
That's okay though as it could give some good entries
Trade Safe.


AAVE - Alt PumpBitcoin just hit new highs. I think we are going to get an altcoin pump next. AAVE is in great position.
Price Target - New highs
Thanks

AAVEBTC WAVE ABC is over and trendline breakoutAAVEBTC WAVE ABC is over and trend line breakout
Dont forget stop loss and this is not financial advise.
this is for education propose only.

AAVEBTC is testing 4h support 🦐AAVEBTC is testing 4h support after the price lost daily support. IF the price will lose 4h support and retest it as new resistance, According to Plancton's strategy (check our Academy), we can set a nice order
–––––
Follow the Shrimp 🦐
Keep in mind.
🟣 Purple structure -> Monthly structure.
🔴 Red structure -> Weekly structure.
🔵 Blue structure -> Daily structure.
🟡 Yellow structure -> 4h structure.
⚫️ Black structure -> <4h structure.
Here is the Plancton0618 technical analysis, please comment below if you have any question.
The ENTRY in the market will be taken only if the condition of the Plancton0618 strategy will trigger.

aavebtc rising wedge and diver on volume indicates correction. According on that we have some good stuff on usd
dont miss

AAVEBTC completing final leg of bullish Shark | Upto 205% moveOn daily time period chart, the price action of Aave (AAVE) is completing the final leg of bullish Shark and soon it will be entered in the potential reversal zone. At this time price action is breaking down 100 SMA and on breaking down 200 SMA this move will be confirmed.
Buying And Sell Targets:
The buying and sell targets as per Fibonacci sequence of Shark pattern should be as below:
Potential reversal or buying zone: 0.002075 to 0.001375 btc
Sell or Fibonacci projection zone: 0.002741 to 0.004201 btc
Stop Loss:
The potential reversal zone area that is up to 0.001375 btc can be used as stop loss in case of complete candlestick closes below this level.
Possible profit and loss ratio:
As per above targets this trade has a profit possibility of 205% and as per the above-mentioned stop loss, the loss possibility is 33.8%.
Note: Above idea is for educational purpose only. It is advised to diversify and strictly follow the stop loss, and don't get stuck with trade.


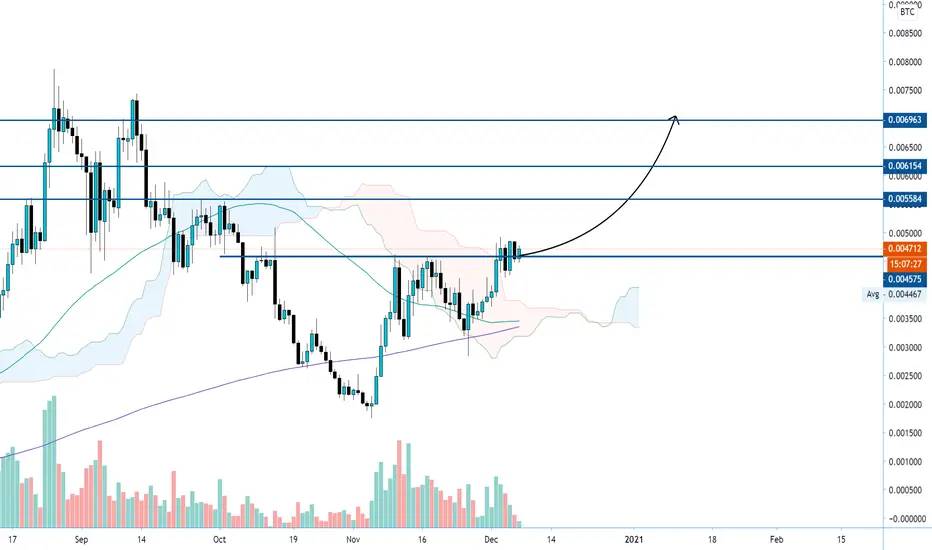
MY PLAN FOR AAVELooking to buy the retest of the blue box below the current price, or buy above if price is able of closing above, aiming for the highest blue box, followed by ATH and price discovery,


AAVE (AAVEBTC) price at resistancewe are facing resistance right now wait for price to close above resistance after that we will enter at the retest of the red zone

$AAVE, Making a HH as it crosses over ~430k sats resistance$AAVE
Making a HH as it crosses over ~430k sats resistance level..
On a HL - HH formation as UCTS is showing a 2D buy signal..
For now volume is not 'there' yet, but a flip of this level may allow continuation toward ~540k sats (~25%)
#AAVE

AAVE short term planwe broke the channel, I'm bidding top of the channel to buy a bag. my target would be 5580

AAVE / BTC 12hThis is not trading advise. Do your own research. I just like to draw lines and color.
Watch for BTC moves to negate any bullish upside.
First impulse had an extended 5th wave. Quite common in new assets of this caliber.
It retraced back to the top of wave 2 which is classic text book Elliot Wave Theory.
Reversed Directly on the .786 Pumped the .5 and retraced to the GP and is on its way again.
RSI attacking, +DMI cross and with ADX support starting on lower TF.
This one moves so its a break out play for me.
This is not trading advise. Do your own research. I just like to draw lines and color.