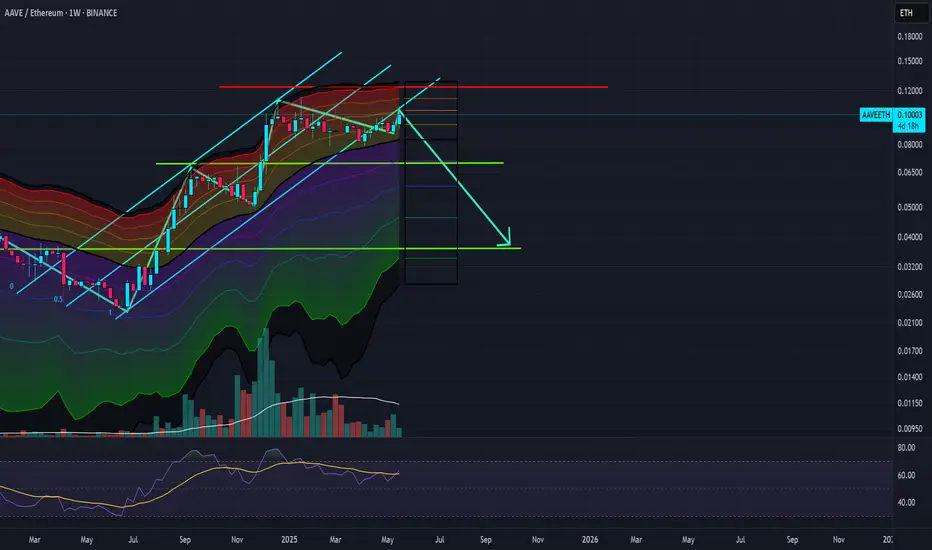
quick short (lower break on decending channel)An ascending channel bottom breakout is a bearish technical analysis pattern that occurs when the price of an asset breaks below the lower trendline (support) of an ascending channel.
Here's a breakdown of what it signifies and how to approach it:
1. Understanding Ascending Channels:
An ascending channel is formed by two upward-sloping, parallel trendlines.
The lower trendline acts as support, while the upper trendline acts as resistance.
Prices typically fluctuate between these lines, creating a channel.
2. Bottom Breakout Significance:
A breakout below the lower trendline indicates that the upward trend within the channel might be losing momentum.
It suggests a potential shift towards a bearish trend or a continuation of a downtrend.
3. Trading Implications:
Bearish Signal: A bottom breakout is generally a bearish signal, suggesting a potential price decline.
Confirmation: It's important to confirm the breakout with other technical indicators or fundamental analysis before entering a trade.
Look for increased volume on the breakout.
Consider indicators like RSI or MACD for confirmation.
Entry Point: A potential entry point for a short position could be after the price closes below the lower trendline, or perhaps after a pullback to the broken support level, now acting as resistance.
Stop-Loss: A stop-loss order should be placed above the broken support level to protect against a potential false breakout.
Profit Target: A profit target can be estimated based on the height of the ascending channel.
4. Cautions:
False Breakouts: Not all breakouts are genuine. Prices may briefly dip below the trendline before recovering.
Confirmation is Key: It's essential to confirm the breakout to avoid getting trapped in a false breakout.
In Summary:
An ascending channel bottom breakout can be a valuable signal for identifying potential bearish reversals or trend continuations. However, it's crucial to use confirmation techniques, manage risk with a stop-loss, and consider the broader market context before making trading decisions
AAVEETH trade ideas
Sooner or later AAVE likely to outperform ETHanother 2x is achievable by AAVE against ETH
either it corrects similarly to how it did on the previous legs, taking a few more weeks
or it starts within a matter of days on some catalyst and proceds higher
either way, looks bullish against ETH

$aaveThis dino shitcoin is looking good somehow I believe it will follow ASX:MKR to middle channel at least.

#AAVEETH - 10% Up or 15% Down?We've locked in a profit of well over 10% on a previous Long trade within #AAVEETH - we've got a Sell signal from Crypto Tipster v2..
Looking at this chart we're seeing two possibilities, the first is that CTv2 is absolutely right with it's signal, this would represent a drop of around 15% within #AAVE to the next level of support.
The second scenario is the layer of potential support just under the current price is strong and rejects the price decline, this would create a pinch point and possibly push the price upward to next resistance, gains of 10%.
What do you think?
If you enjoyed or agree with this idea - drop us a comment, like & follow! :)

AAVE vs. ETH. AAVE is the better hold.At the current moment, it's hard to predict how crypto will fair against USD. However, we can reliably see which pairs will consume a larger share of overall market cap as the space continues to consolidate and burn off fat.
Shown in the top chart is the AAVE/ETH daily pair which just had a moving average golden cross (50/200). This sort of cross is fairly monumental for the daily timeframe and indicative of a major trend in price.
Shown on the bottom chart is the AAVE/ETH weekly pair with Ichimoku indicator showing a bullish cross (Tenkan & Kijun). This sort of cross is VERY monumental for the weekly timeframe. We must wait for the weekly candle to close to confirm this cross.
Fundamentals:
AAVE continues to be a top utilized platform in the defi space despite the market. The biggest drawback to AAVE price action thus far has been it's lack of tokenomics ("token not needed"). Recently AAVE has announced that it will be utilizing it's own native stable coin (GHO) on it's platform. Stakers of AAVE will be able to receive a discount when minting GHO. With AAVE's platform volume and utilization of a wide range of assets and stable coins....a very bullish game theory can be derived from this announcement.
Overall, AAVE is showing tremendous strength against ETH as well as the market in general. If Bitcoin continues to crab in this range, I expect a continued uptrend for AAVE on it's USD pair. However its important to note that this movement could be a mixture of AAVE bullishness and ETH bearishness which can somewhat muddy the USD price action.

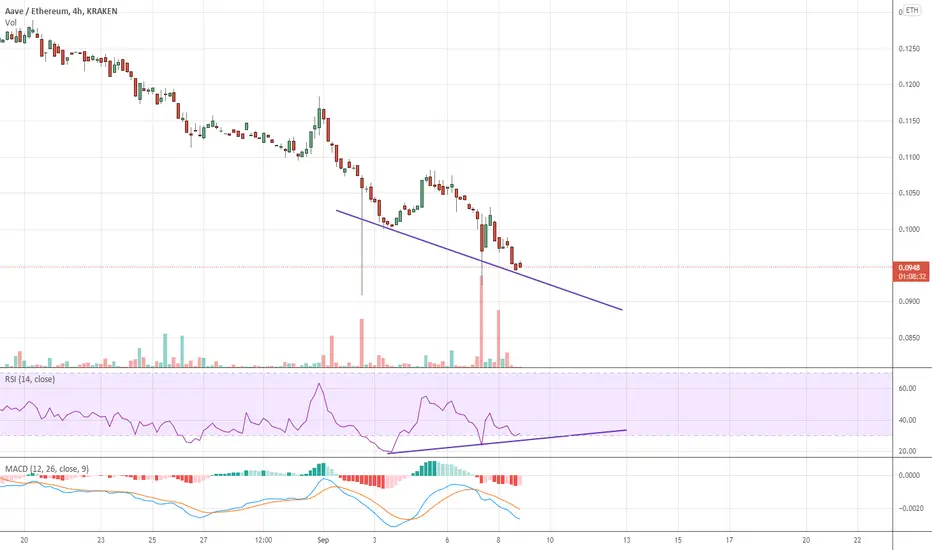
Aave breaks out against Etherium.Aave might have broken a long downtrend against ETH. The bottom also confirmed by the RSI and the MACD has a cross with upwards momentum. Could be setting up a nice swing trade. another leg up could be coming soon, lets keep an eye on it.

AAVE ready to outperform ETH in coming weeksAAVE/ETH chart shows historic low levels.
Bullish divergence on RSI is forming for whole month.
Swap some allocation from ETH to AAVE probable isn't bad idea.

AAVE/ETH Golden Buying OpportunityAAVE/ETH Is Bottomed Out On Daily And Weekly Time frame Currently Trading On its demand zone Can Be an excellent Buying Opportunity
:)


Bullish divergence on 4h AAVEI believe DEFI will have it's moment soon!
AAVE will be one of the big winners in next 2 months
aave eth 1-DA classic descending channel being formed and gearing for a breakout. If you have not bought till now, you can wait for the breakout and buy it on retest again
A solid 25 - 30 % profit play is here
This breakout should mean that USDT pair will also go up towards 504 $ resistance soon

Another oneDid you miss trades, folks?🔥
There is one more trade on crypto market.
Flag formation on AAVE/ETH crypto pair.
Price had strong and bullish sentiment before consolidation.
Then price bounced from support and resistance levels multiple times.
One more touch of support and resistance zones is expected.
However pattern may become circumcised and increase rapidly much earlier.
So follow the chart and look for the clear breakout carefully.
_____________________________________________________
If you enjoy my FREE Analysis , support the idea with a big LIKE👍 and don't forget to SUBSCRIBE my channel, you won't miss anything!
Feel free to leave comments✉️
And always remember: "we don't predict, we react".

possible downtrend break soon on AAVE/ETHlooking at this diagonal downtrend break as a place to swap some ETH for AAVE and capture some of the upside as Defi plays catchup w/ ETH


AAVE / ETHHistorical resistance being broken on the hourly. Can also spot a cup and handle on 1H and 4H. The 4h still haven't crossed historic resistance fully, so if u enter, exercise caution.
1h n 4h hooked and shooted from the 9MA.
Breaking the 0.15585 would confirm bias to the upside. Following tp would be 0.17 and 0.92


Bullish DIvergence Multiple TimeFrames16H, 10H 8H and 1H
Daily but smaller divergence
Good news coming out. Near Resistance lines


AAVEETH: Nice Bullish Pattern FormingThe harmonic pattern is completed so we expect the long soon. It may want to drop to the buy zone first to eat up more liquidity or just take off now. As the structure develops i will keep this idea updated, so like, comment, follow so you don't miss any update. Thank you. .


