AAVE, breakthrough interval, bat form.The following content is machine translation:
BTC made new highs, and the three Zhaicoins followed the rise.
The low range of AAVE is expected to break through.
Bat shape, see more.
The Macd indicator is above the zero axis.
The target is around 400.
AAVEUSD trade ideas


AAVE USD Best ALT coin end of yearAAVE has been in a major Wyckoff Reaccumulation phase since January, nearly 260+ days already and its looking like it might be nearing the end of phase C which would lead to the spring upward, a major price climb. All the needed elements are there to complete the pattern like volatility on the buying climax, volatility on the major sell off, low volume on the shakeouts (without breaking structure) and the loss of momentum and lower and lower volume for the past couple of months while price has held itself. Im expecting AAVE to skyrocket without anyone noticing it and once eyes open up, everyone will be left behind unless you were here now.
AAVE has arguably been the worst top 100 traded cryptos since the beginning of the 2021 bull run but it somehow has one of the best projects out in the crypto ecosystem. I for one have been on the AAVE polygon since launch and i dont plan on departing. AAVE is here to stay and is the new defi bank of the world.
Maybe the accumulation for almost 300 days will have a reason in the end.
Good luck!

AAVEUSD 1DStill looks like in a downtrend channel. Did not see much growth like other Alts.
Hovering around the .382 Fib
320 acting as a strong resistance, got rejected on daily multiple times.
Support - 395 to 300


Aave (AAVE) - October 7Hello?
Welcome, traders.
By "following", you can always get new information quickly.
Please also click "Like".
Have a nice day.
-------------------------------------
(AAVEUSD 1W Chart) - Medium to Long-Term Perspective
Above 101.345455 point: Uptrend expected to continue.
It is necessary to check if the 300.459751-385.934264 section can form a support and resistance section.
(1D chart)
First resistance section: near point 315.356387
Second resistance section: 419.933-472.221304 section. (Psychological resistance section)
First support section: section 158.491471-210.779774
Second support section: near the 101.345455 point
If the price is maintained by rising to the upper sideways section of 315.356387-419.933 section, it is expected to turn into an uptrend and rise.
However, it should break out of the downtrend line.
A decline from the 278.418499 point may lead to the first support area, requiring a short-term Stop Loss.
In order to get out of this sideways section, it should be confirmed that the CCI line rises above the +100 point in the CCI-RC indicator.
-------------------------------------
(AAVEBTC 1W Chart) - Mid-Long-Term Perspective
Above the 0.002157-0.002829 range: An uptrend is expected to continue.
(1D chart)
First support interval: 0.003712-0.004930 interval.
Second support section: 0.002157-0.002829 section.
Resistance section: near 0.007364 point (0.006650-0.007865 section)
Psychological resistance section: 0.009798-0.011016 section
If the price remains in the range of 0.004930-0.007364 and deviates from the downtrend line, it is expected to turn into an uptrend.
------------------------------------------
We recommend that you trade with your average unit price.
This is because if the price is below your average unit price, whether it is in an upward trend or in a downward trend, there is a high possibility that you will not be able to get a big profit due to the psychological burden.
The center of all trading starts with the average unit price at which you start trading.
If you ignore this, you may be trading in the wrong direction.
Therefore, it is important to find a way to lower the average unit price and adjust the proportion of the investment, ultimately allowing the funds corresponding to the profits to regenerate themselves.
------------------------------------------------------------ -----------------------------------------------------
** All indicators are lagging indicators.
Therefore, it is important to be aware that the indicator moves accordingly with the movement of price and volume.
However, for the sake of convenience, we are talking in reverse for the interpretation of the indicator.
** The MRHAB-O and MRHAB-B indicators used in the chart are indicators of our channel that have not yet been released.
(Because it is not public, you can use this chart without any restrictions by sharing this chart and copying and pasting the indicators.)
** The wRSI_SR indicator is an indicator created by adding settings and options to the existing Stochastic RSI indicator.
Therefore, the interpretation is the same as the traditional Stochastic RSI indicator. (K, D line -> R, S line)
** The OBV indicator was re-created by applying a formula to the DepthHouse Trading indicator, an indicator disclosed by oh92. (Thanks for this.)
** Support or resistance is based on the closing price of the 1D chart.
** All descriptions are for reference only and do not guarantee a profit or loss in investment.
(Short-term Stop Loss can be said to be a point where profit and loss can be preserved or additional entry can be made through split trading. It is a short-term investment perspective.)

$AAVE SHORT OPPORTUNITY. HARMONIC PATTERN IN PLAYHello traders and speculators!
We have very nice setup not only on AAVE but on BTC & ETH as well. This means that the sell-off would be broad.
Invalidation level - clean break above $321.
Have a look at MACD (Momentum indicator) on daily as well. We have these "bumps" in momentum that are short-live and continues the trend - lower.
We haven't made real higher high on this move. It's most likely a deviation which will be confirmed once we break $304.
Short entries - $315 (Medium risk). Below $305 - low risk. Stop loss - above $327
Risk/Reward 5:1 with $315 entry.
Risk/Reward 4:1 with $305 entry


$400 AAVE ImminentThe Blockbullder loves building, especially when he can follow a previous plan because it always goes much smoother!
Feedback appreciated and hit that like!
Blockbullder

AAVEUSD Price AnalysisThe daily chart shows the AAVE token has dropped out of a rising trend channel. The lower edge of the pattern, which previously acted as support, is now the first resistance level at $322. Furthermore, the 100-day moving average at $321.75 reinforces the trend line. This was evident last week when Aave tried to recover the uptrend but was swiftly rejected.
As long as the Aave price is below $322, it is vulnerable to further weakness. In that event, a logical target is the 20th of July low at $212, which sits just above May’s ‘flash crash’ low of $206. However, if the price scales $322, the bearish view becomes invalid and the uptrend returns as the dominant theme.
I have premium Trade Signal services, feel free to get in touch for your daily signals and analysis

$AAVE Long-Term This is my long-term plan for $AAVE and I look forward to seeing how it plays out over time. Strong support at $300 has cracked short-term, but I believe our long-term uptrend is still in tact. Expecting ATHs by July/August of 2022. Cheers.

Aave Moonshot readyInverse head and shoulders on Aave. If it breaks the necklline that will be super bullish and it will send AAVE to moonnnn.

AAVE AMAZING SHORT OPPORTUNITYHello traders & speculators!
I have a nice setup for you today.
We just lost previous daily range with confidence. It was rejected heavily and now we are heading towards $216 & $177.
My first target is marked and should be reached relatively soon. TP2 is there in case of a very rapid sell off and clean break of TP1. Let's focus on TP1 for now ($216).
Enjoy the ride and be ready :)
This is not a financial advice! Take care!

ALERT AAVE BOTTOM IS IN BUY NOW????!!!aave
broke below the previous zone of support from earlier in the year
is now showing slight bullish bullish MACD on this recent lower low in price action
previous daily candle also rejected the previous zone to the downside
if price action can get back above this zone and the negative momentum begins to fall I will being to look to ride price action the upside level of $500
-BTC also needs to play fair in order for this to work

aave aaveusdAave is considered the World's bank by cryptocurrency enthusiasts. The program is built on Ethereum, utilizing the decentralization and security of Ethereum's blockchain. Anyone who has access to the internet can use Aave as a high yield savings account for their cryptocurrency and stablecoins


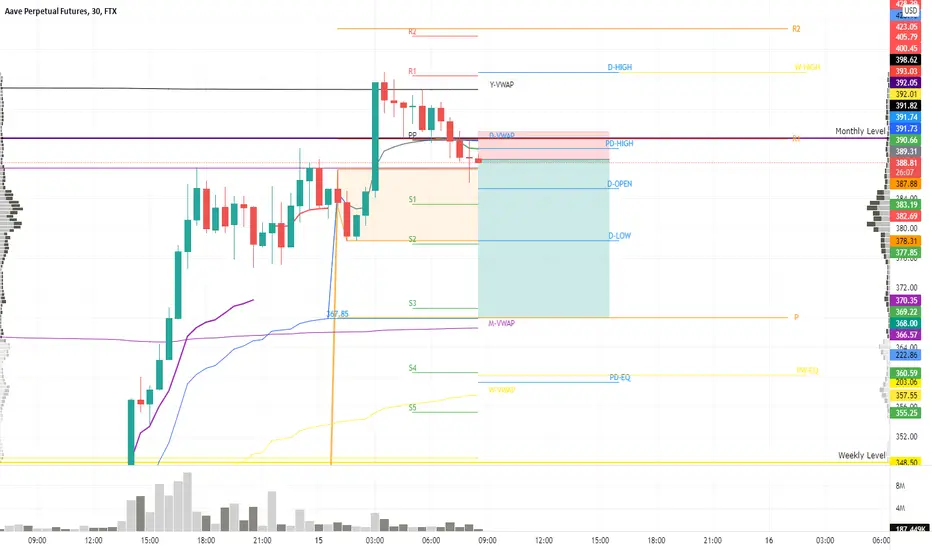
AAVE short - 1% risk, 5% gainI'm going short on AAVE here after its failure to take the monthly level, I am shorting it to the vwap and the daily fib pivot.
(AAVE) Technical Analysis (long/short)Wait for the next candle for a retest. A strong Buy. For investments please do your own analysis!

AAVE bounce?Taking advantage of the btc dump off this morning to take a long on AAVE at the key daily level, stop loss under it at 300 just to be safe, and target is around what you see on the chart, weekly level there.

AAVE bounce trade update So this trade is going rather well. My TP is actually 380, but I will be keeping watch of the weekly level at around 348 to see the reaction. it may be worth TP'ing 50% profit there if it won't break through. My Stop Loss is now 314, representing a 1% account balance increase if I get stopped out. Great trade so far.


Aave (AAVE) - September 9Hello?
Welcome, traders.
By "following", you can always get new information quickly.
Please also click "Like".
Have a nice day.
-------------------------------------
(AAVEUSD 1W Chart)
If the price is maintained above the 101.345455-126.926372 section, it is expected that the uptrend will continue.
In particular, if the price is maintained above the 206.817161 point, it is expected to create a new wave.
(1D chart)
If the price is maintained in the range of 315.356387-419.933, it is expected to turn into an uptrend and rise.
However, it should rise above the 472.221304 point to accelerate the uptrend.
If it falls from the 315.356387 point, you can touch the 158.491471-210.779774 zone, so you need to trade carefully.
-------------------------------------
(AAVEBTC 1W chart)
If the price holds above the 0.002157-0.002829 range, we expect the uptrend to continue.
(1D chart)
We need to see if we can find support in the 0.006650-0.007865 zone and move up along the uptrend line.
If it falls from the 0.006650 point, it could touch the 0.004930 point and below, so you need to trade cautiously.
A significant resistance interval is the 0.009798-0.011016 interval.
However, if the price is maintained with support in the 0.006650-0.007865 range, it is expected to create a new wave.
------------------------------------------
We recommend that you trade with your average unit price.
This is because, if the price is below your average unit price, whether it is in an uptrend or in a downtrend, there is a high possibility that you will not be able to get a big profit due to the psychological burden.
The center of all trading starts with the average unit price at which you start trading.
If you ignore this, you may be trading in the wrong direction.
Therefore, it is important to find a way to lower the average unit price and adjust the proportion of the investment, ultimately allowing the funds corresponding to the profits to regenerate themselves.
------------------------------------------------------------ -----------------------------------------------------
** All indicators are lagging indicators.
Therefore, it is important to be aware that the indicator moves accordingly with the movement of price and volume.
However, for the sake of convenience, we are talking in reverse for the interpretation of the indicator.
** The wRSI_SR indicator is an indicator created by adding settings and options to the existing Stochastic RSI indicator.
Therefore, the interpretation is the same as the traditional Stochastic RSI indicator. (K, D line -> R, S line)
** The OBV indicator was re-created by applying a formula to the DepthHouse Trading indicator, an indicator disclosed by oh92. (Thanks for this.)
** See support, resistance, and abbreviation points.
** Support or resistance is based on the closing price of the 1D chart.
** All descriptions are for reference only and do not guarantee a profit or loss in investment.
Explanation of abbreviations displayed in the chart
R: A point or section of resistance that requires a response to preserve profits.
S-L: Stop Loss point or section
S: A point or section where you can buy to make a profit as a support point or section.
(Short-term Stop Loss can be said to be a point where profit and loss can be preserved or additional entry can be made through split trading. It is a short-term investment perspective.)
GAP refers to the difference in prices that occurred when the stock market, CME, and BAKKT exchanges were closed because they are not traded 24 hours a day.
G1 : Closing price when closed
G2: Opening price
(Example) Gap (G1-G2)

AAVE at critical support, great R/RAfter yesterday's dump, many coins are at support right now. Bitcoin's behaviour will determine a lot of things, and will decide whether alts go up or down. However, AAVE is offering a risk/reward of 4 here, which means we can be wrong up to 80% of the time to make a profit on this setup.
