AAVEUSD (4H) Bearish reversalHi Traders
AAVEUSD (4H Timeframe)
Waiting for the downward break of 101.0 support level which will complete a bearish trend reversal pattern to go SHORT. Only the upward break of 111.9 would cancel the bearish scenario.
Trade details
Entry: 101.0
Stop loss: 111.9
Take profit 1: 94.6
Take profit 2: 84.0
Score: 8
Strategy: Bearish reversal
AAVEUSD trade ideas

AAVE, the rise may continue.The following content is machine translation:
On the daily chart, this rebound has stabilized in the middle of the Bollinger Bands. The big Yangxian line, which rose 23% in heavy volume yesterday, broke through the recent resistance near $110, broke the upper track of the Bollinger Bands, and the opening is enlarged, and it is expected to continue to rise.
The indicator MACD energy column is running above the zero axis, the RSI indicator has rushed to the neutral 50, and the bulls have a strong performance and are bullish.
In operation, do more, the trend is rising, the indicator is in line with the bullish. See around 140-160 in the short-term.

Upward trend for AAVE
Due to AAVE's characteristics as the DEFI Coin par excellence, it is one of the first coins I consider for a reversal in the crypto market. In AAVE, I think the following indicators work pretty well (please test for yourself):
- Schaff Trend Cycle
- MACD
- Weighted Moving Average (14 Periods)
All Indicators are indicating an Uptrend for AAVE right now.

AAVEUSD - Down Channel EntrySimilar scenarios can be seen along this down channel on AAVEUSD
Both resistance turned support lines (yellow) are parallel

TRYX ANALYSIS | AAVEUSD |AAVEUSD seems to be at the end of the correction and is looking for a request to climb. If the area from 120 turns out to be a strong support area with a lot of demand, I aim to go long.

AAVE W PATTERN IS LOADINGI have became bullish on AAVE after Elon musk appoints AAVE's founder as Twitter Interim CEO.
The H&S might be valid after a break below it's neckline and this W pattern will be invalid as price will go down hard.
Anyway; keep watching $BTC for a confirmation.

AAVE ChartThe potential situation for AAVE's price. Price will likely continue to rise as long as BTC is heading toward the 43-44k region but would most likely be overbought and potentially crash down.

First Real Reversal 4 AAVE? This guy... Anybody seeing this? This is going places and that little red line in the middle can be called resistance. Soon, the line will have a new name, lets just call it support. This thing has been working on a come-back since it began losing to the quick profits of those enlightened. However, today is not yesterday, and this guy is no baby anymore so the crawling looks like is about to change in a short time now, IMO of course. I guess I can keep this to myself but how can a person enjoy a win if he's got nobody to share them with! Don't even get me started on UNI, or BTC on the path to greatness. BTC coming back from that last DT then ranging the way it did and followed by the slow up-trend it's been on? Looks like that one got smart. Other folks , the ones who pay attention to facts and not news fueled by the greedy, they know whats coming. Trust nobody, ever, don't even trust yourself! Confirm these things through hard work and patience. That will be the ONLY way to consistent growth! Mark those words because if you do, you will come back and say thank you after you actually implement those key factors of trading vs. dumb money! Don't give your hard earned money to people who are your peers, but they worked hard at finding the answers to this game. Don't be fickle and don't stop learning because complacency is no better than trading from a news release. The chart tells you everything, not what you want it to, but sometimes, it DOES! And this was just me telling everyone about a dream I had, don't do anything I said on account of me saying it. I wasn't even here! Don't gamble, it's dangerous kids, get a job and a wheel, and some debt on the side... Cheers!

AAVEUSD (1H) Bearish BreakoutHi Traders
AAVEUSD (1H Timeframe)
The market is in a downtrend, and we are waiting for an entry signal to go SHORT below the 155.2 support level. Only the upward break of 178.2 would cancel the bearish scenario.
Trade details
Entry: 155.2
Stop loss: 178.2
Take profit 1: 140.8
Take profit 2: 117.7
Score: 4
Strategy: Bearish Breakout

AAVE BO trendline, retested & bouncedChart reveals everything.
Fundamentally, AAVE is a push for banking without middleman.

AavePerpIn my opinion Aave has done creating 5th wave in an inverted chart , we might see an upward movement if it crosses 20 MA. Open trade after candle open above 20 MA , T.P = 170 and S.L below last candle.


AAVE aiming for a 15-25% gain 🚀 We have a high velocity down wave that shows us a quick imbalance in price and fear that made this coin fall fast. However, within that bearish wave is the hidden bullish momentum when we extract the fear. Once the greed sets in, AAVE will return to the previous levels quickly and fill the gap in imbalance.

AAVEUSDT H16: BEST Level to BUY/HOLD 100%(SL/TP)(NEW)Why get subbed to me on Tradingview?
-TOP author on TradingView
-2000+ ideas published
-15+ years experience in markets
-Professional chart break downs
-Supply/Demand Zones
-TD9 counts / combo review
-Key S/R levels
-No junk on my charts
-Frequent updates
-Covering FX/crypto/US stocks
-before/after analysis
-24/7 uptime so constant updates
🎁Please hit the like button and
🎁Leave a comment to support our team!
AAVEUSDT H16: BEST Level to BUY/HOLD 100%(SL/TP)(NEW)
IMPORTANT NOTE: speculative setup. do your own
due dill. use STOP LOSS. don't overleverage.
🔸 Summary and potential trade setup
::: AAVEUSDT 16hours//candle chart review
::: strong bullish chart overall
::: trading inside range / accumulation process
::: rejection likely from mid range / pullback
::: BUY low from 190 USD later TP 410 USD
::: recommend to focus on buying range LOWS
::: I don't think that we are ready to MOON yet
::: accumulation in progress / more time required
::: best trades near range lows for BULLS
::: it's a strong prior bull market so can
::: however KEEP A TIGHT STOP LOSS
::: BULLS get ready to BUY after pullback
::: TP bulls is 100% gains BUY/HOLD SETUP
::: AAVE will re-test range highs near 410 USD
::: patience required next few weeks
::: BEST reload BULLS is 190/200 USD
::: as we are getting ready for a move now
::: final TP BULLS is 410 USD
::: good luck traders!
🔸 Supply/Demand Zones
::: N/A
::: N/A
🔸 Other noteworthy technicals/fundies
::: TD9 /Combo update: N/A
::: Sentiment mid-term: BULLS/BUY PULLBACK
::: Sentiment short-term: BEARS/PULLBACK ONLY
RISK DISCLAIMER:
Trading Crypto, Futures , Forex, CFDs and Stocks involves a risk of loss.
Please consider carefully if such trading is appropriate for you.
Past performance is not indicative of future results.
Always limit your leverage and use tight stop loss.

$AAVEUSD | Model Predicts New HighsHello Traders,
The targets on this chart are produced by a proprietary model. Data is fed into the model, the output is the targets you see on the chart. The support zone is also defined by the model. A break of the support zone nullifies this set up.
Look at related Idea for a broader picture.

AAVE at next sell-off ??AAVE at next sell-off ??
December 27th 2021 we had 30.08% in profit - that was the last local high.
Today 31.88% are in profit - will we see profit taking soon?
What do you think?
On-chain data by @intotheblock
Drop me a nice comment if you'd like me to analyze any other cryptocurrency.
*not financial advice
do your own research before investing

Aave to £300Aave was in a descendent channel (low yellow and blue line). Likely, it just broke it. It has very little transversal resistance so it might go to near $270-300. It crashed after the double top, then the war so it built the descendent channel. The problem is that it has a lot of resistance at "PSY" before the previous distribution cycle and "PS" when it started the accumulation process. It must break both of the points to enter in SOS. It will then meet a new resistance at $400 once it breaks those.
Bollinger bands are expanding so you can see a $300 approx soon.
There is also good news about street banks lending money.
Anything can shoot up at any time..., e.g. ZIL, WAVES.
Happy trading,
Raf

AAVE Breakout confirmed. Correction is coming?Update:
As expected, breakout occurred yesterday in relatively high. Today AAVE find local resistance at 26.60% Fib lvl. After a breakout, a correction -test of the previous resistance lvl - is the most possible scenario. So, A ‘normal’ support is near $215 or $192.81.
Investing is a probability game.
Try for consistency, there is no perfection in this.
Not financial advice. Always do your own research.
Check previous TA on AAVE below.

AAVE correction confirmed. Next support?The most obvious scenario confirmed. After the rejection at 0.236 Fibonacci level, AAVE is testing previous resistance level at $213, if it fails (probably), next support is around $192. Last support to continue its uptrend is $170. The new threats of energy crisis, etc. may drag price so low. We will see in the next days.
Investing is a probability game.
Try for consistency, there is no perfection in this.
Not financial advice. Always do your own research.

AAVE USD Harmonic playing out nicely. We entered the order block for a higher target. These take time to cut through. Our worst enemy is patience imo

AAVE Breakout is imminent?Aave is approaching once again the bearish trendline.
There are almost 11 hours left before the market ‘’close’’ and volume is already above the MA.
After the trendline breakout the most important level - Aave need to flip before reaches new highs - is $300.
In my opinion, Aave is an undervalued asset. So, if nothing changes in the fundamentals or in the world, we will see a strong bull trend in Aave.
It’s hard to know if it will reach an ATH, no one knows that.
If you don't bought the dip, it is better to wait for the trendline break out - to reduce the risk - before open a long position.
Investing is a probability game.
Try for consistency, there is no perfection.
Not financial advice. Always do your own research.

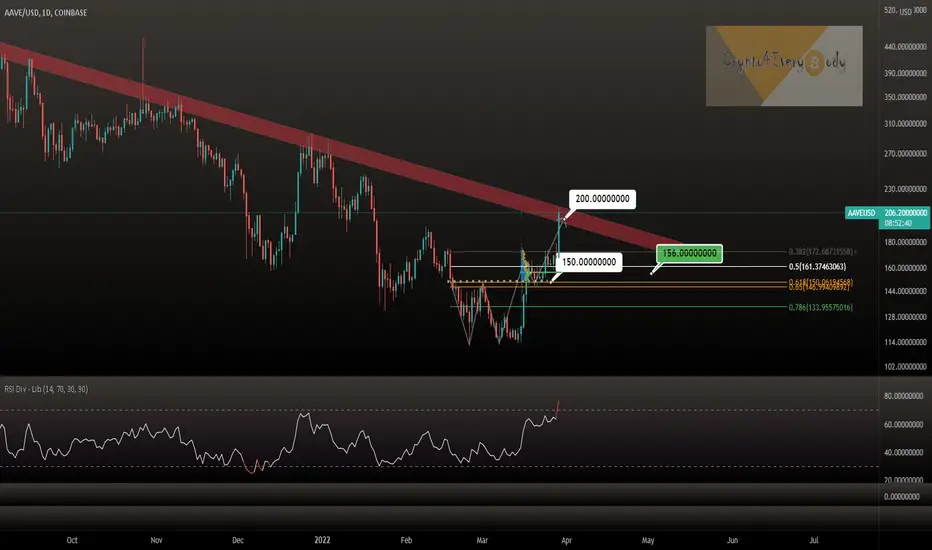
Update: AAVE reached my W-shape pattern - target of $200Update: AAVE reached my W-shape pattern - target of $200
A correction to the area $156 is very likely IMO since we are overbought at the moment.
A confirmed break of the resistance channel is the next thing all bulls love to see.
Are you bullish on this Crypto?
Drop me a nice comment if you'd like me to analyze any other cryptocurrency.
*not financial advice
do your own research before investing
aave trend continuation looks like aave will be getting a trend continuation seems like positve bounce of trend line very nice pattern building time to buy again. also theres the w pattern appearing could see one more move to the downside but im starting to accumulate longs
