Aave (AAVE): Break of 200EMA and Successful Re-Test | BullishAave coin has a nice breakout from 200EMA where previously we were looking for a failed re-test after what we would have shorted the coin but we ended up with a successful re-test and we are now shifting our view into a more bullish scenario.
We are looking to get a proper BOS, which then would gi

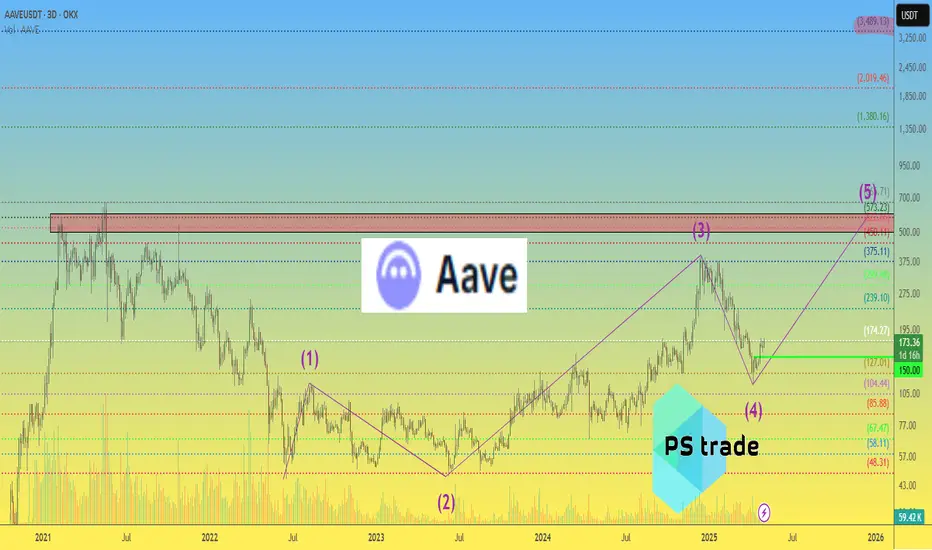
Aave Rising Trend Continues, $1054 Next Target —$2297 PossibleAave has been on a very strong rising trend since September 2023. This is a trading pair/Cryptocurrency project that is really strong when compared to other projects.
Many Altcoins hit major lows last month. Some even hit a new All-Time Low. The difference here is staggering, rather than new lows,

AAVE Supply zoneCrucial AAVE decision zone for Fibo retracement.
Looking for price action on the key level for reject or breakthrough.

AAve short to $168Just now opened a short position on aave. Expecting a dump back down to $168 soon. Market is currently high, this was a nice correction to the upside to get decent RR to short.
Roughly 2.56RR

AAVE price analysisGlobally, the price of OKX:AAVEUSDT looks very good compared to most altcoins.
Therefore, as of now, looking at the chart, we can assume that any purchase of CRYPTOCAP:AAVE above $150 can turn into a good medium or long-term investment.
Target for growth in 2025 to $500-600
Although, there are
AAVE Retracement Long Entry ZoneStructure broken. Looking for a Fibo retracement to enter Long. Target Levels are supply POI on the chart.

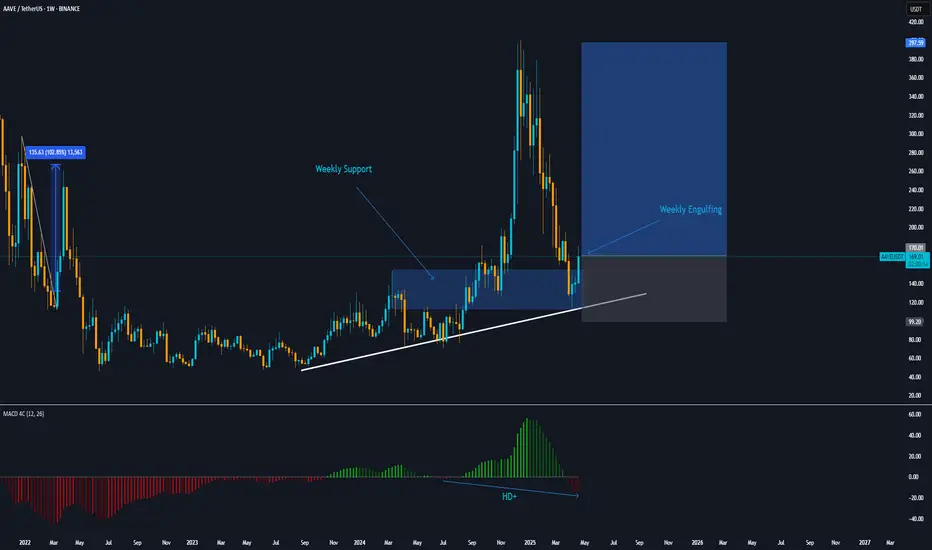
AAVE: THE PERFECT STORM SETUP FOR 340% RETURNS🔄🚀 for more details FOLLOW ME AND READ BELOW 🚀
📈 The Bullish Convergence Pattern
This AAVE/USDT weekly chart reveals a textbook pattern that's impossible to ignore. After forming a massive rounded bottom structure from 2022-2024, AAVE is now completing its correction phase with a clear descending

AAVEAAVE looking very juicy in several time frames, 1D and 4H is the most detailing tf for analysis, so if you watch closely, you will notify that AAVE it is sitting on a very well positioned support where on 4H tf, the buying volume it is already +16% and this means that when volume goes over 20-25% on

AAVEUSDT is ready to begin an UptrendWith the closing of a strong bullish candle and its engulfing, we can expect the price to grow to its previous high price range.
Aave long to $185Just now opened a long position on aave. Anticipating a breakout pump tonight to $185.
There is a decent chance that the market falls back down to my stop area, hopefully not but I did see thats probable but at the same time game confirmation to long based on my DTT strategy just now perfect.
Migh

See all ideas
Summarizing what the indicators are suggesting.
Oscillators
Neutral
SellBuy
Strong sellStrong buy
Strong sellSellNeutralBuyStrong buy
Oscillators
Neutral
SellBuy
Strong sellStrong buy
Strong sellSellNeutralBuyStrong buy
Summary
Neutral
SellBuy
Strong sellStrong buy
Strong sellSellNeutralBuyStrong buy
Summary
Neutral
SellBuy
Strong sellStrong buy
Strong sellSellNeutralBuyStrong buy
Summary
Neutral
SellBuy
Strong sellStrong buy
Strong sellSellNeutralBuyStrong buy
Moving Averages
Neutral
SellBuy
Strong sellStrong buy
Strong sellSellNeutralBuyStrong buy
Moving Averages
Neutral
SellBuy
Strong sellStrong buy
Strong sellSellNeutralBuyStrong buy
Displays a symbol's price movements over previous years to identify recurring trends.