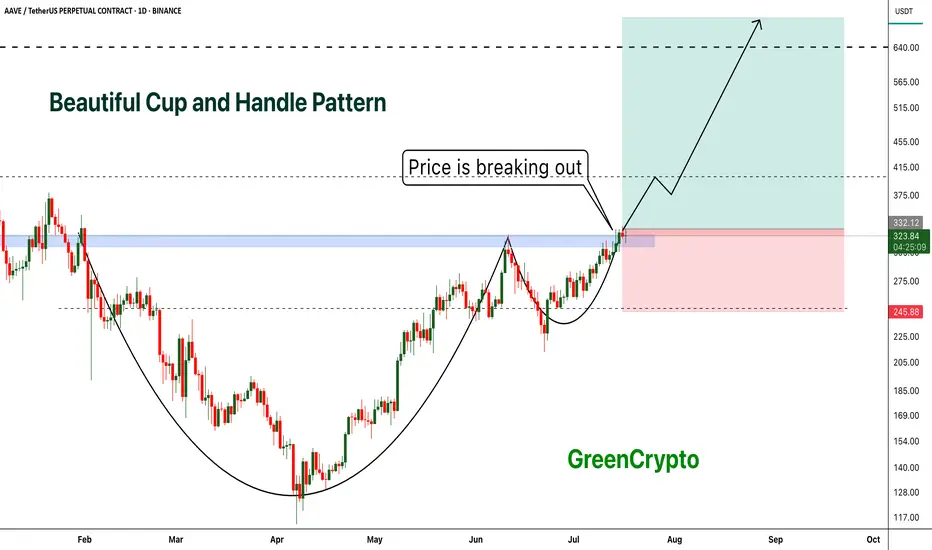
AAVE - Beautiful Cup and Handle Pattern Breakout- AAVE is breaking out from cup and handle pattern finally
- Cup and handle pattern breakout usually results in perfect trend continuation
- A huge long trade opportunity from this
Entry Price: 335 Above
Stop Loss: 245
TP1: 381.89
TP2: 429.16
TP3: 525.94
TP4: 628.78
TP5: 712.89
Max Leverage 5x:
Don't forget to keep stoploss
Cheers
GreenCrypto
AAVEUSDT trade ideas
TradeCityPro | AAVE Holds Gains as Altseason Optimism Builds👋 Welcome to TradeCity Pro!
In this analysis, I’m going to review the AAVE coin for you. It’s one of the major DeFi coins active in the lending sector and currently ranks number 1 in terms of TVL.
✔️ The token itself has a market cap of $4.58 billion and is ranked 29 on CoinMarketCap.
📅 Daily Timeframe
On the daily timeframe, since our last analysis, the price has increased by over 100%, and the trigger for long or buy positions was activated.
🔄 There was a descending trendline on this coin, and the trigger for its breakout was 148.17. After breaking that level, we could open a long position.
🚀 However, the main trigger was 194.97, and the primary uptrend started with the break of that level, continuing up to a high of 328.9.
📊 The issue with this current uptrend is that, as you can see in the second leg, there is clear weakness, which is not a good sign for the continuation of this trend.
📈 The current top at 328.9 is not far from the previous high, forming a double top-like structure, leading to a strong bearish divergence in the RSI.
💥 If RSI confirms a breakdown below 50, this divergence will become active and a correction toward 222.10 may occur. A break of that level would be the first signal of a potential trend reversal for AAVE.
⭐ On the other hand, if price wants to continue upward, we have a very important resistance at 383.59.
🔍 Breaking this resistance would initiate an uptrend in higher cycles and could even lead to a new ATH for this coin.
💼 I plan to open a long position if the 328.9 resistance is broken, and for spot purchases, I will wait for a breakout of 383.59.As long as the price remains above 279.45, I am not considering any short positions.
📝 Final Thoughts
This analysis reflects our opinions and is not financial advice.
Share your thoughts in the comments, and don’t forget to share this analysis with your friends! ❤️

AAVE/USDT — Classic Cup and Handle Pattern AnalysisThis chart highlights a significant and classic bullish pattern: the Cup and Handle.
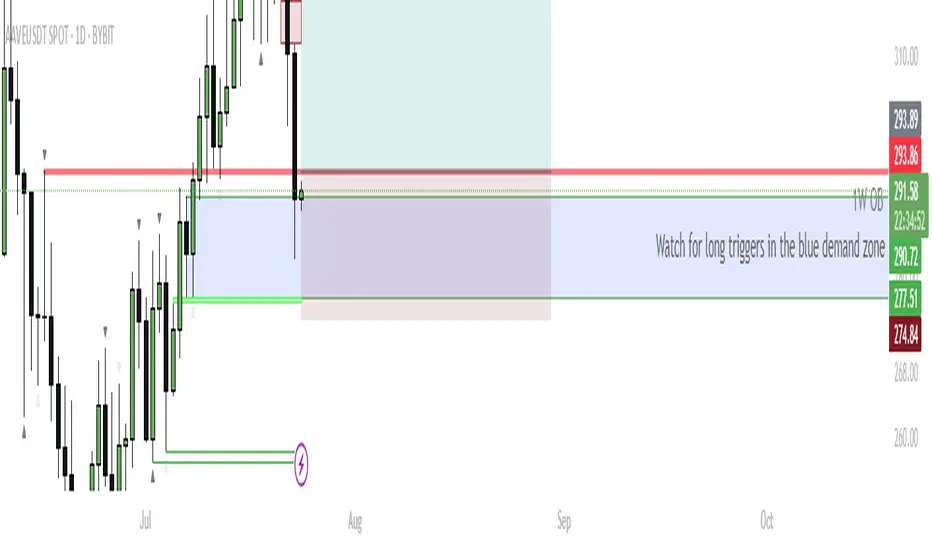
AAVE – Eyeing Reversal From Daily Demand for $400 TargetCurrent Structure:
AAVE recently rejected from 1M S/R at $332.54 and pulled back into a confluence support zone—overlapping 1W order block (OB), 1D OB, and previous resistance now flipped support ($277–$290 zone, marked blue).
Buy Zone:
Watching the blue box area for bullish reversal triggers. This is a high-probability demand zone due to multiple timeframe confluence.
Trigger:
Wait for a bullish reaction/candle confirmation inside the blue zone. Ideal scenario: bullish engulfing, sweep of the low and reclaim, or a strong bounce with rising volume.
Targets:
Primary upside target: retest of the 1M S/R at $332, then continuation toward $400 if momentum sustains.
Invalidation:
If price closes below the 1D OB ($274.84), long setup is invalidated—risk of further downside increases.
AAVE is testing a major support confluence zone, combining weekly and daily order blocks. This area previously acted as resistance and now presents a strong demand zone. If bulls defend this zone and trigger a reversal, there’s a clear runway back to previous highs and potentially $400. This setup offers a favorable risk/reward profile with tight invalidation.
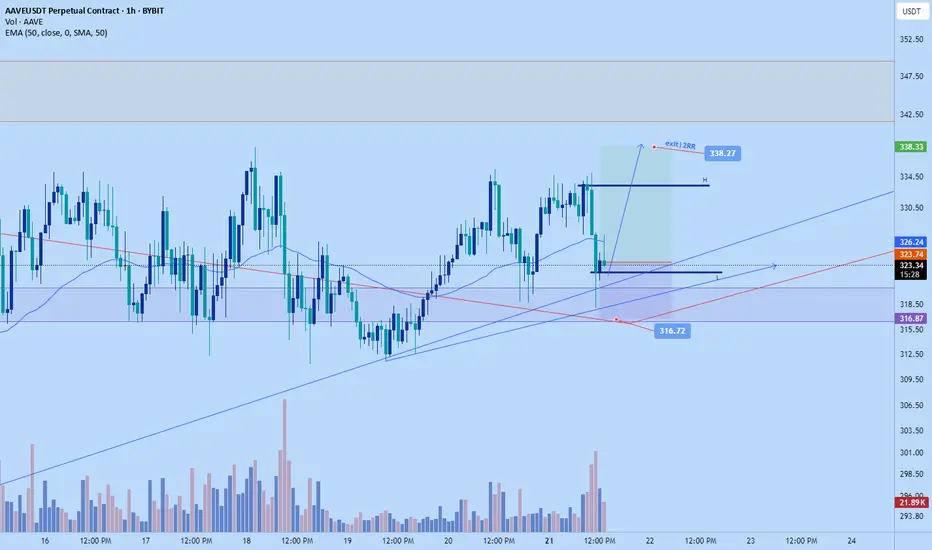
AAve scalp long to $338.27Just now opened a scalp long position on aave. I anticipate that the bulls will attempt to make new highs again soon, we're at at good level and structurally market is likely at a LL point on the hr tf, definitely not a good place to short if I was a bear
Sl: $316.72 good invalidation stop
Roughly 2RR trade.
AAVE SELL SETUP ,Sold From $333AAVE SELL SETUP
Currently $333
Sold From $333
(Trading plan If AAVE
go up to $341 will add more shorts)
Expecting target $323 OR DOWN
In the event of an early exit,
this analysis will be updated.
Its not a Financial advice

AAVE IDEA JUL/18/25Let’s try another one over the weekend.
We’re aiming for that LQ on the HTF, but we’ll catch some partials along the way
AAve Big long to $350Opened a long on aave a while ago. Setup aligns with my DTT process. Direction, target and timing.
Stop: $298.77 relatively as I anticipated little downside from here, the bulls just claimed the level a whie ago.
Let's see if they can keep it.
Tps on chart. The plan is to scale out along the way given all goes well.

aave scalp shortJust now took a short on aave.
Roughly 2rr.
Stop: $308.18
Tp: $292.22
Time sensitive

AAVE 8 Hour time frame reviewAAVE complete the inverse head and shoulder pattern, currently getting rejected from the neck line. Signs of Sell side liquidity underneath the right shoulder expecting a sweep of this then reverse to attack the neck line

AAVE DistributionI'm looking for a potential model 2 here after mitigating supply and building a good looking top. It would need confluence with BTC.D and USDT.D, since i am more focused on reaccumulations at the moment. My alert is at the POI, i will decide later if i take it or not.

AAVE Bounce or Breakdown — Trendline Test #3AAVE is testing a clean 3-touch trendline that’s held for days. Current confluence with the range low and Stoch RSI reset makes this a textbook long setup — but if the trendline fails, expect quick downside. Risk defined. Eyes on the next candle.

$aave/usdt short zonesth:
intraday short zone: htf + ltf liq + htf 78.6 fib + sh
swing short zone: htf + ltf liq + ote zone + bat & butterfly bearish harmonic

AAVE IDEA JUL11-25So here is a quick one
Let’s see how this OB works in seach of short-term liquidity 💪

AAVE buy pointsBINANCE:AAVEUSDT OKX:BTCUSDT.P
Would like to see it gets supported in a 4 h level but the 1 h Bollinger band may support it, I have opened an initial position (buy 1) and would like to add a hedge until it reaches my buy 2.

AAve long to $326.35 tonight!Just hopped into aave long. Market looks likely to continue the trend push impulsively a bit more.
Stop: $303.93
Tp: $326.35 area
Roughly 2 RR
Time sensitive scalp

Aave long to $325Just went long aave
Stop: $296.91
Tp: $325
Tp1: $310.
Tp2: $315
I might just hold until tp 2 before take profit. depends on whether its pushing strong in 1 candle or not
Time sensitive

AAVE Trend line BOAAVE has been respecting the trend line for few weeks and today it is rejected from the trend line after upmove. It will move either Up/Down from the lines.

AAVE prepares for the back-test
After a sharp decline, AAVE formed a textbook spring, signaling that strong buying demand has returned to the market.
The recent bullish leg appears to have completed a 5-wave impulse structure (H4 timeframe), suggesting a high probability that a corrective phase may follow.
Currently, EURONEXT:AAVE is testing the resistance boundary of its ascending channel. I’m looking for signs of an upthrust here, with two primary scenarios in mind:
Scenario 1: If the recent surge to $300 is confirmed as an upthrust, we could see a mild correction back to the $279 area for a support back-test—possibly forming a secondary spring within the rising channel (lower probability).
Scenario 2: If price wicks above $300 but then reverses, I anticipate a back-test at $289, which could set the stage for a new rally to break ATHs (targeting $325) and potentially reach the $370 area.
RSI is approaching overbought territory, but there’s no clear sign of a reversal yet. It’s crucial to watch for divergence signals at this stage.
Key Points:
AAVE is in a strong bullish phase, but a short-term pullback to retest the $279–$289 support zone could offer the optimal entry for the next leg up.
Risk management first: Keep stops tight below $275 to protect capital.

Aave long Opened a long on Aave not too long ago.
Scalp long
2.3RR roughly
Stop: $260.94
Market fell quite low. Anticipating a correction back up

AAVE Breakdown Could Trigger Major DropYello Paradisers — did you spot the bearish setup forming on AAVEUSDT? If not, you might already be a step behind, but there’s still a high-risk-reward opportunity on the table — if you approach it with discipline.
💎Currently, AAVEUSDT is looking increasingly bearish. The asset has confirmed a bearish Change of Character (CHoCH), broken down from a rising wedge pattern, and is showing clear bearish divergence on the chart. These combined signals suggest that the probability of further downside is increasing.
💎From here, there are two main scenarios we’re monitoring. First, AAVE could attempt a pullback to fill the Fair Value Gap (FVG) above, which would offer a clean short-entry zone with strong risk-reward potential. Alternatively, price could reject directly from the nearby Bearish Order Block (OB), offering another chance for well-structured entries. Both setups depend on confirmation and timing, so patience is key.
💎However, if AAVE breaks and closes decisively above the current resistance zone, the bearish thesis becomes invalid. In that case, the best move is to wait on the sidelines and allow new, higher-quality price action to form before re-engaging.
💎This market demands patience and discipline. You don’t need to catch every move — just the right ones. Stay sharp, stay focused, and let the market come to you.
Strive for consistency, not quick profits. Treat the market as a businessman, not as a gambler.
MyCryptoParadise
iFeel the success🌴

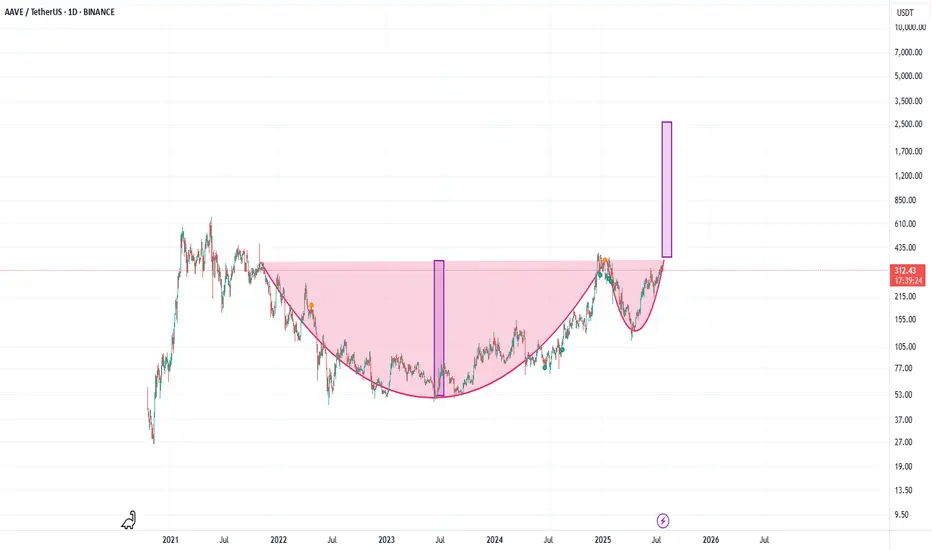
AAVE 2100$Aave
AAVE is the largest decentralized non-custodial liquidity market protocol on Ethereum Virtual Machine.
The currency has been moving in an upward trend since its launch.
This is in conjunction with ongoing development of the currency and a strong team.
The currency is considered non-inflationary.
Circulating Supply
AAVE 15.17M
(94.8% of Max Supply)
Monitor prices closely to benefit.
I wish everyone abundant profits.
Like and follow
for more.

AAVE Potential 1-2/1-2I´m keeping an eye on a quick pullback on AAVE for a potential 1-2/1-2.
The thesis is that black 2 finished in the 50% pullback and we´re currently finishing blue 1.
Blue 2´s pullback would be a great opportunity for long trades with a very tight stop loss.
The gray zone, with gave us a fake breakout for black 1, may be the temporary resistance for blue 1.
